Figure 1
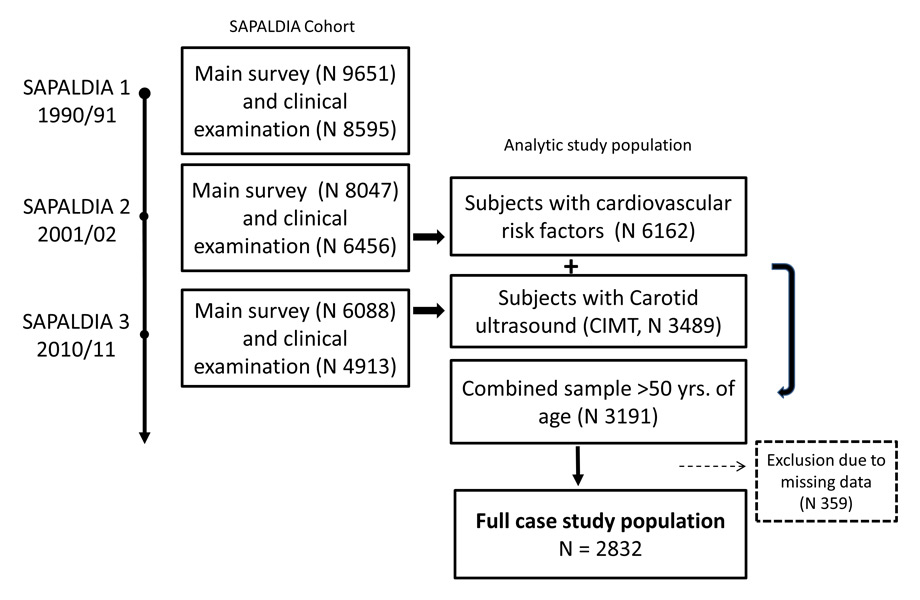
Flow chart. SAPALDIA – follow-ups and timing of data collection of cardiovascular risk factors and CIMT assessment.
DOI: https://doi.org/10.4414/smw.2014.14052
Cardiovascular Disease (CVD) remains the main cause of global mortality and morbidity. While mortality rates have decreased in developed countries, largely due to primary prevention efforts [1, 2], the burden of disease remains high and is increasing in developing countries [3]. It is in this context that prevention and good risk assessment tools become even more important in tackling cardiovascular disease on a larger scale.
Figure 1
Flow chart. SAPALDIA – follow-ups and timing of data collection of cardiovascular risk factors and CIMT assessment.
Cardiovascular risk scores allow subjects to be identified at increased risk of developing disease or suffering a fatal cardiovascular event [4]. In Europe and Switzerland the most commonly used scores are the ESC heart risk score (SCORE) [5], estimating the 10–year risk of a fatal event, and the AGLA-score, an adaptation of the PROspective CArdiovascular Münster study PROCAM score [6] by the Swiss Society of Cardiology (Arbeitsgruppe Lipide und Atherosklerose) estimating the 10–year risk of morbidity from cardiovascular disease.
Imaging techniques, such as ultrasound measurements of carotid intima media thickness (CIMT), have shown their effectiveness in identifying patients at risk [7, 8] and in improving the risk stratification [9]. Furthermore, CIMT is a good population-marker of cardiovascular risk [10, 11]. While some studies have shown cross-sectional associations between risk scores and structural and functional indicators of atherosclerosis [12], longitudinal studies have observed the long-term impact of cardiovascular risks on vascular indicators [13–15]. To our knowledge, a confirmatory study investigating the long term association of cardiovascular risk scores, commonly used in Switzerland, and CIMT in a Swiss population has not been performed before. We thus investigated, using the Swiss Air Pollution And Lung and heart Disease In Adults cohort (SAPALDIA), how well the cardiovascular risk scores calculated at SAPALDIA 2 in 2001/02 would identify subjects with thicker CIMT and incident CVD at SAPALDIA 3 in 2010/11 and thereby present first data on carotid intima media thickness in a representative Swiss population (fig. 1). Secondly, we investigated the single cardiovascular risk factor effects on CIMT and analysed the direct and indirect impact of life-style factors via the haemodynamic pathways using path analyses.
The SAPALDIA Study is a multicentre, population-based cohort of adults from eight regions of Switzerland. The cohort study started in 1991 and has been followed up twice, in 2001/2002 (SAPALDIA 2) and 2010/2011 (SAPALDIA 3) [16, 17]. SAPALDIA collected detailed data on respiratory and general health, life-style and socio-economic situation by means of interview-led questionnaires at the study centre in each survey. In 2001, cardio-metabolic diseases were added as outcomes of interest, and in turn cardio-metabolic biomarkers, objectively measured anthropometric data, blood pressure (BP) and heart rate variability were assessed. In the second follow-up survey, 2010–2011, sequential B-mode ultrasound imaging was performed in SAPALDIA 3 participants turning 50 years within the same year or older (n = 3,489). Carotid intima media thickness was introduced as a main outcome into the third SAPALDIA cohort assessment to investigate individual risks, such as physical activity, and environmental risks, such as air pollution. SAPALDIA complies with the Declaration of Helsinki and ethical approval has been granted by the respective Swiss cantonal ethical committees (supplemental file: SAPALDIA funding and acknowledgements). Participants gave written informed consent.
Carotid ultrasound measurements were conducted in the SAPALDIA Study centres by trained and certified field workers under the supervision and technical assistance of Imagelabonline & Cardiovascular, Amsterdam, and the Dept. of Sports, Exercise and Health, University of Basel, who also read and scored the images. The common carotid arterial (CCA) far wall, 1 cm proximal to the bulb, was visualised in two angles: longitudinal ear to ear and horizontal view. Images were automatically read by the image analysis programme DYnamic ARtery Analysis (DYARA) [18]. In accordance with the Mannheim Consensus [19], measurement regions containing plaque and images with insufficient quality were excluded from analysis. The analysed sequential images started and ended in end-diastole containing one to three heart cycles. The per individual average CIMT (aCIMT) was calculated using mean CIMT measures of both angles both of the right and left CCA. To investigate intra-field worker variability, duplicate CIMT exams were performed on two different days within 3 months after the first examination in a random sample of eligible SAPALDIA3 participants (n = 165, age range 50–80 years, mean (SD) 62.1 (7.3) years for age, 40.6% men, 59.4% women). The between-visit coefficient of variation for aCIMT was 3.98% (3.52–4.44), and the ICC 0.89 (0.87–0.93) [20].
The definition of current CVD at SAPALDIA 2 was based on reported doctor diagnosis of hypertension, heart disease, myocardial infarction and stroke. In SAPALDIA 3 additional information was available on heart arrhythmias, angina pectoris, and heart insufficiency/failure. Newly reported CVD disease at SAPALDIA 3 was considered incident CVD. Relevant cardiovascular treatment was considered medication for CVD, diabetes and hypercholesterolaemia.
BP was measured in the sitting position after a 10-minute rest with an interval of at least 3 minutes (automatic OMRON 705IT, OMRON HEALTHCARE, Kyoto, Japan) in SAPALDIA 2 and SAPALDIA 3. The mean of both systolic and diastolic BP measurements was calculated and used for analyses (systolic mean BP, diastolic mean BP).
Non-fasting cardio-metabolic biomarkers (glucose, HBA1C, total cholesterol, LDL cholesterol, triglycerides and hsCRP) were available for subjects in SAPALDIA 2. Details on the treatment of blood samples are described elsewhere [16, 21].
Body mass index (BMI, kg/m2), was calculated using weight and height measured at the study centres in SAPALDIA 2 and SAPALDIA 3.
Never, former and current smokers were defined based on reported smoking habits at the time of both surveys and in the past. Pack years smoked before and in between follow-ups was calculated for former and current smokers.
Participants were asked in SAPALDIA 3 if a first grade relative had had a myocardial infarction or stroke before or after the age of 60 years. The “family health questionnaire” was filled out by participants at home and sent back, resulting in a relatively high percentage of missing data (n = 965, 34%). Multivariate imputation was applied (STATA impute) and a missing dummy variable was generated.
A detailed women’s health questionnaire with data on menopausal status was filled out at home in SAPALDIA 2. Post-menopause was defined based on the STRAW definition of 12 months cessation of menstruation or medically induced menopause [22]. Menopausal status was missing from 403 women (28%).
The low risk score algorithm of SCORE was used based on data from SAPALDIA 2: age, smoking status, BP, cholesterol by sex separately ( http://www.escardio.org ). The three highest risk categories (>5%–9% n = 139, >10%–15% n = 22 and >15% n = 1) were collapsed to one (>5%) for power reasons. The AGLA score includes, in addition, diabetic status, HDL, LDL, triglycerides from SAPALDIA 2 and family CVD history taken from SAPALDIA 3 ( http://www.agla.ch ). The resulting ALGA score was divided by four in pre-menopausal women. Two distinct variables were calculated: AGLA-1 in all participants (n = 2812) using imputed data on family medical history and defining women <= 50 years as pre-menopausal [23], if data was missing, and AGLA-2 in subjects with complete data, only (n = 1586). AGLA-2 was used in sensitivity analyses.
After exclusion of participants with missing outcome or exposure data, 2,832 SAPALDIA participants were included into the analyses (fig. 1). Average CIMT was log-transformed because of a non-normal distribution. Descriptive analyses of aCIMT and single risk factors were run by sex. Age- and sex-adjusted mean CIMT were calculated by Swiss language region (German-speaking: Basel, Davos, Wald, Aarau; French-speaking: Payerne, Montana, Geneva, and Italian-speaking: Lugano). Multi-level linear regression analyses between CVD risk scores and aCIMT were adjusted for study centre as random effect, only. A second extended model was additionally adjusted for cardiovascular risk factors not included in the score algorithms, such as BMI, physical activity, pack-years and educational status. Test for trend was based on the continuous scores, investigating non-linear trends by introducing polynomials. Sensitivity analyses were run: first, differentiating in CVD healthy and CVD diagnosed participants based on reported CVD treatment or CVD diagnoses at SAPALDIA 2 or SAPALDIA 3, second using AGLA-2, and third, adjusting for heart medication intake at SAPALDIA 3. The observed differences in CIMT in SAPALDIA 3 by risk category, as defined in SAPALDIA 2, are presented as % difference of the geometric mean. The secondary analyses on the association between AGLA-1 and CVD incidence between SAPALDIA 2 and SAPALDIA 3 was estimated by mixed effect logistic regression analyses adjusted for additional health risks of disease (diabetes, COPD, lung emphysema, and creatinine at SAPALDIA 2, pack years between SAPALDIA 2 and SAPALDIA 3, and BMI at SAPALDIA 3), educational status and study centre as random variable. Covariate inclusion was based on biological plausibility and prior knowledge using a step-wise backward strategy (significance level of 0.2). All analyses were performed for the total sample and stratified by sex.
Thirdly, we ran path analyses to investigate the hypothesis that cardiovascular risk factors indirectly affect CIMT via the haemodynamic pathways, systolic and diastolic BP and heart rate. Path analyses allow structural dependencies among a set of covariates to be identified. Based on potential causal relationships the pathway model analyses the direct and indirect impact of model covariates on the outcome of interest. (STATA pathreg) [24]. Significant standardised beta-regression coefficients depicted in figure 4 allow the relative magnitude of effects to be compared (significance level of 0.05). All analyses were done in STATA 12 ( http://www.stata.com/stata12 ).
The SAPALDIA CIMT study population age ranged from 40–73 years in SAPALDIA 2 (mean 55.5, SD 8.0). The mean follow-up time between SAPALDIA 2 and SAPALDIA 3 was 8.3 years (SD 0.4). Prevalence of reported doctor diagnosed cardiovascular disease was 21% in SAPALDIA 2 and 53% in SAPALDIA 3, with a significantly higher prevalence in men compared to women (24.3% vs 17.5%; p <0.001). Furthermore, several risk factors, such as high BP or smoking, were more prevalent in SAPALDIA 3 as well as in men as compared to SAPALDIA 2 and women, respectively (supplemental table 1). The geometric mean (GM) of aCIMT was 0.728 mm (95% CI 0.723; 0.732). Men had a significantly thicker aCIMT GM (0.746 mm, 95% CI 0.739; 0.753) than women (0.710 mm, 95% CI 0.704; 0.716; p-value <0.001). Age- and sex-adjusted geometric mean aCIMT were significantly different in the language regions (German-: 0.726 mm; French-: 0.725; Italian-speaking: 0.742, p <0.001).
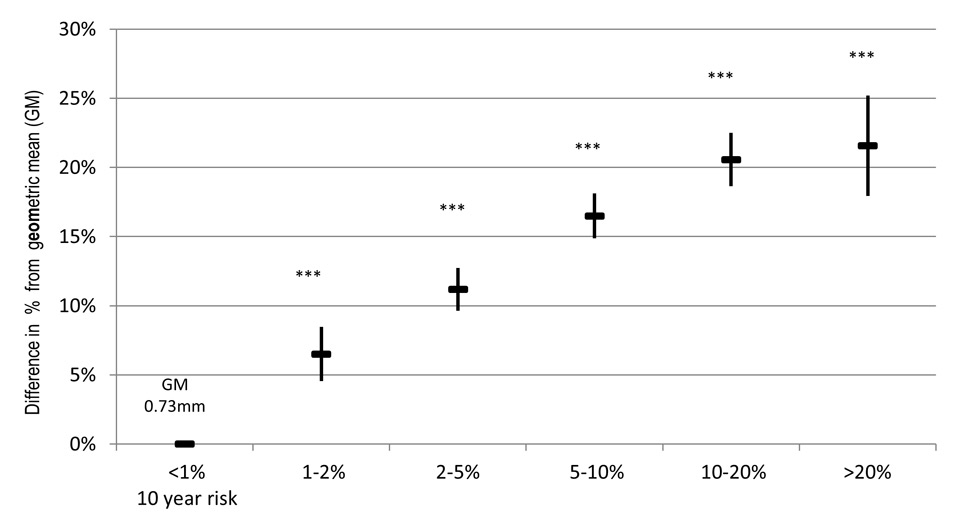
Figure 2
Association of AGLA-1 with aCIMT in SAPALDIA 3. ▬ Depicts estimated %difference of the geometric mean (GM), ▌ confidence interval of estimated %change. *** p-value <0.001, between risk and reference category, α adjusted for study area (random effect).
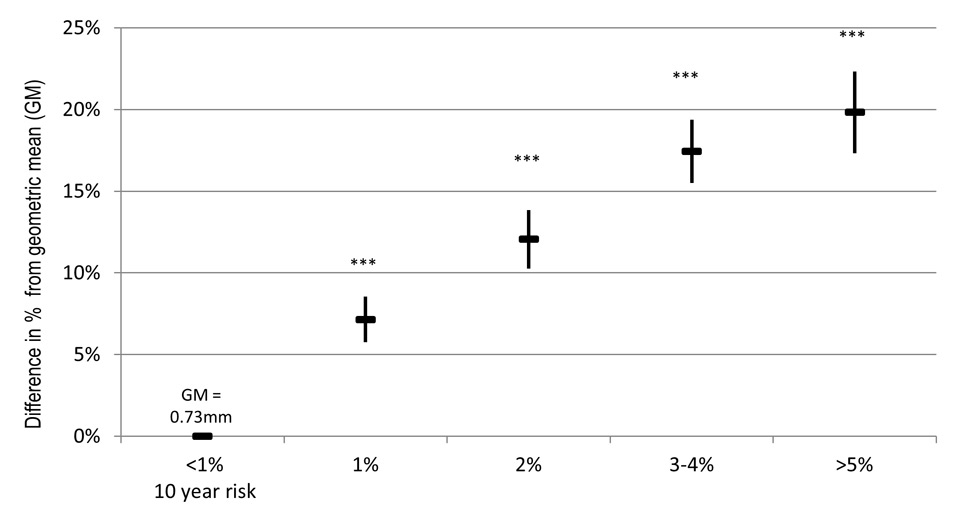
Figure 3
Association of SCORE with aCIMT in SAPALDIA 3. ▬ Depicts estimated %difference of the geometric mean (GM), ▌ confidence interval of estimated % change. *** p-value <0.001, between risk and reference category, α adjusted for study area (random effect)
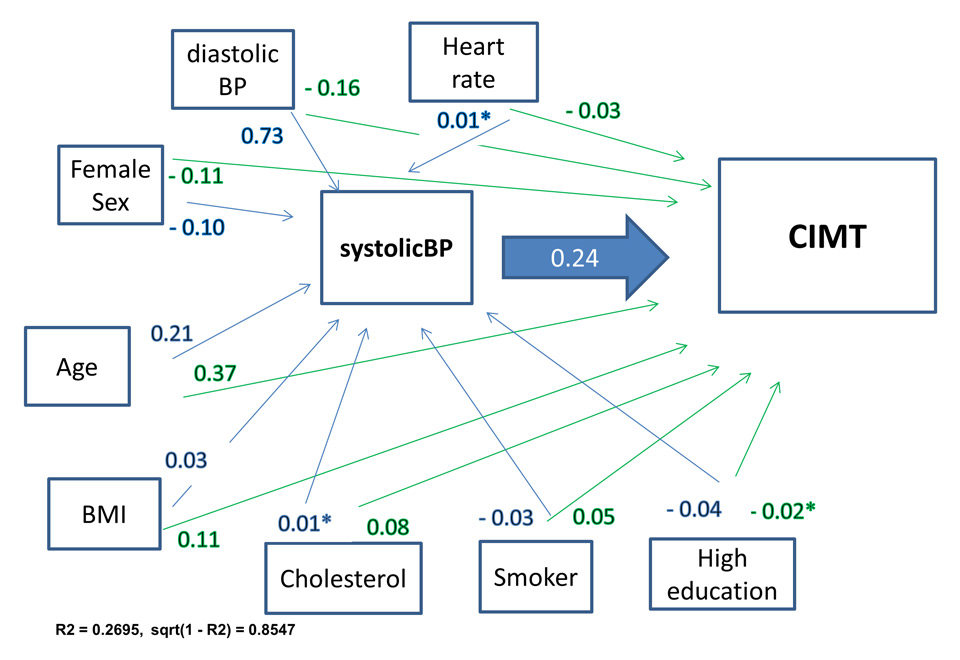
Figure 4
Path analyses: systolic blood pressure and carotid intima media thickness.
Beta coefficients in blue: direct effect on systolic BP, in green: indirect effect on CIMT, mutually adjusted and adjusted for physical activity (non-significant impact on BP and CIMT); R2 = variance explained by path model; sqrt(1–r2) = estimated error
Analyses on potential bias by non-response showed that non-responders to the women’s questionnaire were significantly older (3.65 yr, 95% CI 4.56; 2.74, p-value <0.001), of slightly higher BMI (0.75 unit BMI, 95% CI 1.25; 0.26, p-value 0.003), but did not differ significantly compared to responders with regard to systolic BP, smoking status, total cholesterol, glucose and CVD disease at either survey after age-adjustment. Non-responders to the family medical questionnaire were significantly more often male (37% male, 31% female, p-value 0.02) and, after adjustment for sex, had significantly higher values for BMI (mean BMI 26 vs 25.5, p-value 0.02), heart rate (mean 70.5 vs 70, p-value 0.03), glucose (mean 5.8 vs 5.6, p-value 0.003) and pack years (mean 18 vs 16.8, p-value 0.04).
A small percentage of the study population fell into a high risk category in SAPALDIA 2 (table 1). Women were more often assigned to lower AGLA-1 risk scores than men (AGLA-1 <1%: 10% men and 40% women), while there were small differences by sex in the high risk category (AGLA-1 risk group >20%: 2.7% men, 2.4% women). Sex differences in SCORE were significant and consistent across all risk groups.
The multivariate linear analyses yielded a significant positive association (figs 2 and 3). Between the AGLA-1 reference category and the highest risk category was a 22% difference in the GM corresponding to 0.16 mm, respectively 20% (0.15 mm) for the SCORE. Trend analyses showed an exponential relationship (quadratic polynomial, y = α + βx + (-β)x2, test for trend: p-value 0.001), levelling out in the highest categories. The associations were significantly positive in both sex (supplemental table 2) and remained unchanged after adjustment for additional cardiovascular risk (supplemental table 3).
Sensitivity analyses stratifying by participants who either reported CVD or were under relevant treatment (CVD diseased) and participants without CVD or treatment (CVD healthy) at SAPALDIA 2 or SAPALDIA 3 did not differ significantly to the main analyses (table 2), albeit a smaller percentage change in aCIMT was found in CVD diseased compared to CVD healthy subjects. Neither did the additional adjustment change the longitudinal correlation found between the scores and CIMT (supplemental table 4). The sensitivity analyses with the AGLA-2 score showed similar strength and direction of association (supplemental table 3).
The logistic regression yielded significant positive associations between AGLA-1 and CVD incidence during the follow-up time (table 3). Women, in general, were at lower odds of developing CVD. At SAPALDIA2 all pre-menopausal women were assigned the lowest AGLA risk category. Excluding these women, the results in postmenopausal women were more similar to men.
Figure 4 presents the output path model of the path analysis with the significant standardised beta-regression coefficients. Direct and indirect associations were found for all endogenous variables of the path model and aCIMT. The hypothesised haemodynamic pathway could be shown for systolic BP (fig. 4). In this model only age yielded a higher direct impact on aCIMT than systolic BP. Path-analyses of other haemodynamic proxies (diastolic BP and heart rate) showed less and non-significant direct impact on CIMT (data not shown).
| Table 1: Prevalence of risk categories AGLA-1 and SCORE – in the SAPALDIA study population (≥50 years). | ||||
| AGLA-1α | n = 2,812 | % | Men n = 1,393 | Women n = 1,439 |
| 10 yr risk <1% | 742 | 26.4 | 9.83 | 42.41 |
| 10 yr risk 1%–2% | 331 | 11.8 | 14.61 | 9.03 |
| 10 yr risk 2%–5% | 728 | 25.9 | 31.67 | 20.29 |
| 10 yr risk 5%–10% | 600 | 21.3 | 26.32 | 16.52 |
| 10 yr risk 10%–20% | 338 | 12 | 14.82 | 9.31 |
| 10 yr risk >20% | 73 | 2.6 | 2.75 | 2.45 |
| SCOREβ | n = 2,830 | |||
| 10 yr risk <1% | 1,316 | 46.5 | 25.05 | 67.2 |
| 10 yr risk 1% | 703 | 24.8 | 26.92 | 22.79 |
| 10 yr risk 2% | 354 | 12.5 | 19.96 | 5.28 |
| 10 yr risk 3%–4% | 297 | 10.5 | 17.3 | 3.89 |
| 10 yr risk >5% | 162 | 5.72 | 10.77 | 0.83 |
| α AGLA-1 corresponds to the adapted PROCAM cardiovascular risk score by the Swiss Society of Cardiology (Arbeitsgruppe Lipide und Atherosklerose) β SCORE corresponds to the ESC heart risk score | ||||
| Table 2: Association of AGLA-1 and SCORE with aCIMT in SAPALDIA 3 by doctor diagnosed CVD status in SAPALDIA 2 and SAPALDIA 3. | ||||||||
| CVD healthy study population δ | CVD diagnosed study population δ | |||||||
| n = 1,249 | n = 1,563 | |||||||
| AGLA-1 α | Estimated % differenceμ | (95% CI) | p-value | Estimated % differenceμ | (95% CI) | p-value | ||
| 10 yr risk <1% | Reference | Reference | ||||||
| 10 yr risk 1%–2% | 8 | (5.7; | 10.2) | <0.001 | 4.5 | (–2.4; | 11.4) | 0.205 |
| 10 yr risk 2%–5% | 11 | (9.1; | 13.0) | <0.001 | 4.6 | (–0.2; | 9.3) | 0.059 |
| 10 yr risk 5%–10% | 17.6 | (15.2; | 20.0) | <0.001 | 11.6 | (6.9; | 16.3) | <0.001 |
| 10 yr risk 10%–20% | 24.2 | (20.7; | 27.7) | <0.001 | 11.4 | (6.4; | 16.4) | <0.001 |
| 10 yr risk >20% | 30.3 | (19.9; | 40.6) | <0.001 | 11.6 | (3.9; | 19.3) | 0.003 |
| SCORE β | n = 1,256 | n = 1,576 | ||||||
| 10 yr risk <1% | Reference | Reference | ||||||
| 10 yr risk 1% | 8.4 | (6.5; | 10.3) | <0.001 | 5.1 | (3.0; | 7.1) | <0.001 |
| 10 yr risk 2% | 13.7 | (10.9; | 16.5) | <0.001 | 9.4 | (7.0; | 11.8) | <0.001 |
| 10 yr risk 3%–4% | 19.7 | (16.0; | 23.4) | <0.001 | 14.6 | (12.1; | 17.0) | <0.001 |
| 10 yr risk >5% | 24.7 | (19.2; | 30.2) | <0.001 | 16.6 | (13.6; | 19.6) | <0.001 |
| α AGLA-1 corresponds to the adapted PROCAM cardiovascular risk score by the Swiss Society of Cardiology (Arbeitsgruppe Lipide und Atherosklerose) β SCORE corresponds to the ESC heart risk score δCVD healthy/β CVD diseased: based on reported doctor diagnosis of hypertension, heart disease, myocardial infarction, angina pectoris, heart insufficiency or stroke at SAPALDIA 2 or SAPALDIA 3. μ The estimated % difference between the respective risk group and the reference with respect of the geometric mean CIMT (0.73 mm). | ||||||||
| Table 3: Odds of developing a cardiovascular disease over the follow-up time from SAPALDIA 2 (2001/02) to SAPALDIA 3 (2010/11) by AGLA risk score in SAPALDIA 2, stratified by sex. | ||||||||
| All n = 2,795 | Men n = 1,371 | |||||||
| AGLA-1α | Odds ratioβ | 95% CI | p-value | Odds ratioβ | 95% CI | p-value | ||
| 10 yr risk <1% | Ref. | Ref. | ||||||
| 10 yr risk 1%–2% | 1.08 | 0.80; | 1.46 | 0.603 | 1.45 | 0.85; | 2.46 | 0.175 |
| 10 yr risk 2%–5% | 1.33 | 1.06; | 1.68 | 0.015 | 2.27 | 1.41; | 3.65 | 0.001 |
| 10 yr risk 5%–10% | 1.93 | 1.51; | 2.45 | 0.000 | 2.65 | 1.63; | 4.30 | 0.000 |
| 10 yr risk 10%–20% | 2.21 | 1.66; | 2.93 | 0.000 | 3.18 | 1.89; | 5.36 | 0.000 |
| 10 yr risk >20% | 3.71 | 2.24; | 6.13 | 0.000 | 8.70 | 3.85; | 19.69 | 0.000 |
| AGLA-1α | Women n = 1,424 | Women, post-menopausal at SAPALDIA 2, n = 565 | ||||||
| 10 yr risk <1% | Ref. | Ref. | ||||||
| 10 yr risk 1%–2% | 1.10 | 0.72; | 1.68 | 0.651 | 3.18 | 1.22; | 8.28 | 0.018 |
| 10 yr risk 2%–5% | 0.95 | 0.69; | 1.30 | 0.731 | 2.07 | 0.85; | 5.02 | 0.109 |
| 10 yr risk 5%–10% | 1.92 | 1.40; | 2.65 | 0.000 | 4.61 | 1.87; | 11.34 | 0.001 |
| 10 yr risk 10%–20% | 2.09 | 1.40; | 3.11 | 0.000 | 4.89 | 1.89; | 12.61 | 0.001 |
| 10 yr risk >20% | 2.14 | 1.06; | 4.30 | 0.033 | 5.67 | 1.60; | 20.15 | 0.007 |
| α AGLA-1 corresponds to the adapted PROCAM cardiovascular risk score by the Swiss Society of Cardiology (Arbeitsgruppe Lipide und Atherosklerose) β adjusted for education, chronic bronchitis, smoking status at SAP3, creatinine, BMI at SAP3 and study area as random variable | ||||||||
We found the two CVD risk scores, AGLA and SCORE, based on clinical SAPALDIA data from 2001/02, to be significantly and positively associated with the CIMT data measured approximately 10 years later, both in SAPALDIA subjects with known CVD disease as well as in “CVD healthy” subjects. Our findings are greatly in agreement with other investigations, but in addition the analysis demonstrates that cardiovascular risk scores, originally developed to estimate the risk of cardiovascular morbidity or fatal events, also have a predictive power for early stage disease, a time in which prevention is most effective. The association was, however, not strictly linear. The increase in CIMT levelled out in higher risk categories. Similarly, we found significantly increased odds of newly diagnosed CVD in higher risk categories, but the result was lower than to be expected from the estimated score. Possibly, the high risk groups of 2001 underwent more personal life-style modifications and received more therapeutic interventions compared to lower risk groups. A methodological explanation may be the exclusion of plaque images and thereby aCIMT measures >1.5 mm. Furthermore, a healthy selection bias is possible, leading to an underestimation of the risk association.
Vascular aging, a normal physiological process, can be accelerated by exposure to risk factors. We showed significant direct impact on CIMT by single risk factors, as well as indirect effects. Age was the determinant with the largest impact on intima media thickness in the path analyses. Including follow-up time into the analysis did not change the results, indicating that the factor age is more than just “time passing”. It stands for the exposure time to risk factors, corresponding cellular processes and pathomechanisms. Sex, another non-modifiable risk factor, proved to be significantly associated with aCIMT, as well as with the prevalence of risk factors and CVD. Consistent with literature, female sex was associated with a thinner aCIMT. However, our sensitivity analyses in post-menopausal women in SAPALDIA 2 showed a comparable risk of CVD incidence to that of men, in line with the delayed occurrence of clinical CVD in women [25, 26]. Menopause-related hormonal or metabolic changes add to and accentuate the overall cardiovascular risk [27, 28].
Hypertension is a CVD risk factor with a direct impact on CIMT [29], and is therefore included in all cardiovascular risk scores, next to life-style risks and age. The later risk factors are shared by high BP and CIMT, but very few studies have looked into this complex interplay [30]. The presented path analysis supports the hypothesised indirect effects of life-style risks on CIMT via haemodynamic pathway. Considering the high prevalence of many of these risk factors and prevalent under-treatment of high BP or non-compliance [31, 32], primary and secondary prevention must be strengthened. We assumed a uni-directional causal association, despite some indications of a bi-directional association for functional vascular parameters and hypertension [33]. Life-style risk factors will most certainly also impact via the inflammatory pathway [30, 34]. Some evidence for an inflammatory pathway in pathological vascular aging can be deduced from the impact of the inflammatory proxy obesity (BMI). We found no association between hsCRP and aCIMT, possibly due to a high intra-individual variability of CRP, and CRP being rather an acute biomarker.
The incremental value of CIMT to the general risk score assessment in therapeutic settings has been disputed, even though combining score and CIMT has been shown to reclassify patients’ risk [8, 9]. Inconsistency in the findings partly relates to different study designs. Although adding CIMT to the Framingham risk score in a general population did not show an improvement of the risk prediction [35], other studies investigating specific sub-groups, such as women [36] or hypertensive subjects [37] have observed an additive value. Based on the current knowledge, the ESC guidelines 2012 value the added information by carotid ultrasound examinations beyond the assessment of traditional risk factors to help in decision-making about the necessity medical treatment [38]. The predictive value of plaque compared to intimal medial thickening is also subject of discussion. Plaques, corresponding strongly to the atherogenic process, have been found to better predict vascular age [39] and cardiovascular events, especially stroke, and therapy success in individuals than CIMT alone [40, 41]. Maximal IMT also showed improved cardiovascular risk classifications [9]. On a population level, CIMT seems to be a very good estimator of cardiovascular risk, even more since CIMT combines vascular structural changes due to haemodynamic and atherogenic risk factors [11, 42]. CIMT is also known to be predictive of atherosclerosis in other blood vessels [43], while plaques, beyond being methodologically more time consuming to ascertain, are often localised pathologies. In view of the public health effort, the identification of early stage disease on a population-level must be a major aim.
We present first data of a large Swiss population-based study on CIMT. While our presented analysis was not a primary aim from the start of the cohort in 1991, which could potentially be viewed as a limitation, the value and strength of epidemiological cohorts lies in collecting individual and environmental data over the life course and to be able to investigate future relevant study questions. Thus our prospectively collected cardiovascular biomarkers and risk factors, and the high quality standards of the carotid artery ultrasound data allowed us to successfully characterise the cardiovascular risk profile of the SAPALDIA participants and confirm the predictive association of locally applied risk scores with vascular health indicators in Switzerland. Having focused on CIMT without an assessment of the total plaque area (TPA), we could, however, not compare the two indicators, CIMT and TPA. Among thelimiting factors of longitudinal studies is loss to follow-up with a risk of a healthy selection; a concern in our population as well. The study design did not allow for fasting blood samples limiting the use of certain blood lipids and glucose levels. Since cardiovascular health history was assessed in more detail in SAPALDIA 3 compared to SAPALDIA 2, an overestimation of CVD incidence at SAPALDIA 3 is possible, thereby overestimating the association with the AGLA score. For the sensitivity analyses, however, we expect that by excluding subjects classified “CVD diseased” in SAPALDIA 3, one would have excluded the participants, which the earlier SAPALDIA 2 questionnaire on cardiovascular disease might have missed. Moreover, some covariates were self-reported and misclassification cannot be excluded. Misclassification would not be expected to be differential. Missing data, such as data on family CVD history, could have led to error; although sensitivity analyses yielded robust results and no indication of bias.
In conclusion, this first population-based Swiss study on CIMT confirms the longitudinal association between cardiovascular risk factors and intima media thickening, both in “CVD healthy” and in participants with diagnosed CVD. On a population-level, CIMT adds to a more robust estimation of the population at risk for early stage disease, relevant for prevention policies and health system planning. Our study supports the clinical use of risk scores not only to estimate risk of disease incidence, but also early vascular pathology. The haemodynamic pathway analysis underscores that optimal haemodynamics are of high clinical and public health concern. Combining risk scores with CIMT measures and visualising the vascular impact may constitute an additional motivational argument in individual treatment settings.
Study directorate: T Rochat (p), NM Probst Hensch (e/g), N Künzli (e/exp), C Schindler (s), JM Gaspoz (c)
Scientific team: JC Barthélémy (c), W Berger (g), R Bettschart (p), A Bircher (a), O Brändli (p), C Brombach (n), M Brutsche (p), L Burdet (p), M Frey (p), U Frey (pd), MW Gerbase (p), D Gold (e/c/p), E de Groot (c), W Karrer (p), R Keller (p), B Martin (pa), D Miedinger (o), U Neu (exp), L Nicod (p), M Pons (p), F Roche (c), T Rothe (p), E Russi (p), P Schmid-Grendelmeyer (a), A Schmidt-Trucksäss (pa), A Turk (p), J Schwartz (e), D. Stolz (p), P Straehl (exp), JM Tschopp (p), A von Eckardstein (cc), E Zemp Stutz (e).
Scientific team at coordinating centres: M Adam (e/g), C Autenrieth (pa), PO Bridevaux (p), D Carballo (c), E Corradi (e), I Curjuric (e), J Dratva (e), A Di Pasquale (s), E Dupuis Lozeron (s), E Fischer (e), M Germond (s), L Grize (s), D Keidel (s), S Kriemler (pa), A Kumar (g), M Imboden (g), N Maire (s), A Mehta (e), H Phuleria (exp), E Schaffner (s), GA Thun (g) A Ineichen (exp), M Ragettli (e), M Ritter (exp), T Schikowski (e), M Tarantino (s), M Tsai (e)
(a) allergology, (c) cardiology, (cc) clinical chemistry, (e) epidemiology, (exp) exposure, (g) genetic and molecular biology, (m) meteorology, (n) nutrition, (o) occupational health, (p) pneumology, (pa) physical activity, (pd) paediatrics, (s) statistics
The Swiss National Science Foundation (grants no 33CSCO-134276/1, 33CSCO-108796, 3247BO-104283, 3247BO-104288, 3247BO-104284, 3247-065896, 3100-059302, 3200-052720, 3200-042532, 4026-028099, PMPDP3_129021/1, PMPDP3_141671/1), the Federal Office for Forest, Environment and Landscape, the Federal Office of Public Health, the Federal Office of Roads and Transport, the canton's government of Aargau, Basel-Stadt, Basel-Land, Geneva, Luzern, Ticino, Valais, and Zürich, the Swiss Lung League, the canton's Lung League of Basel Stadt/ Basel Landschaft, Geneva, Ticino, Valais, Graubünden and Zurich, Stiftung ehemals Bündner Heilstätten, SUVA, Freiwillige Akademische Gesellschaft, UBS Wealth Foundation, Talecris Biotherapeutics GmbH, Abbott Diagnostics, European Commission 018996 (GABRIEL), Wellcome Trust WT 084703MA.
The study could not have been done without the help of the study participants, technical and administrative support and the medical teams and field workers at the local study sites. Local fieldworkers : Aarau: S Brun, G Giger, M Sperisen, M Stahel, Basel: C Bürli, C Dahler, N Oertli, I Harreh, F Karrer, G Novicic, N Wyttenbacher, Davos: A Saner, P Senn, R Winzeler, Geneva: F Bonfils, B Blicharz, C Landolt, J Rochat, Lugano: S Boccia, E Gehrig, MT Mandia, G Solari, B Viscardi, Montana: AP Bieri, C Darioly, M Maire, Payerne: F Ding, P Danieli A Vonnez, Wald: D Bodmer, E Hochstrasser, R Kunz, C Meier, J Rakic, U Schafroth, A Walder.
Administrative staff: C Gabriel, R Gutknecht.
SAPALDIA 3 was reviewed and approved by the following Swiss ethical commissions (– reference number):
Kantonale Ethikkommission Aargau – KEK 2009/056
Kantonale Ethikkommission beider Basel – 219/09
Comité départemental d'éthique de médicine interne et médicine communautaire – 09/174
Commission cantonale valaisanne d'éthique médicale – CCVEM 033/09
Commission d'éthique de la recherche clinique, Lausanne – 200/09
Comitato etico cantonale, Bellinzona CE 2276
| Supplemental table 1: Cardiovascular risk profile in the study population in SAPALDIA 2 and SAPALDIA 3. | ||||||
| All n = 2832 | Men n = 1392 | Women n = 1438 | ||||
| SAPALDIA 2 | Mean | SD | Mean | SD | Mean | SD |
| Age (yr) | 55.5 | 8.0 | 55.6 | 8.0 | 55.5 | 8.1 |
| BMI (kg/m2)*** | 25.7 | 4.0 | 26.5 | 3.4 | 25.0 | 4.3 |
| Systolic blood pressure (mm Hg)*** | 127.4 | 19.1 | 133.4 | 17.6 | 121.9 | 18.8 |
| Diastolic blood pressure (mm Hg)*** | 80.4 | 10.9 | 83.4 | 10.6 | 77.6 | 10.3 |
| Heart rate | 70.0 | 10.3 | 69.3 | 10.9 | 70.7 | 9.6 |
| Total Cholesterol | 6.1 | 1.1 | 6.1 | 1.1 | 6.2 | 1.1 |
| HDL*** | 1.5 | 0.4 | 1.3 | 0.4 | 1.7 | 0.4 |
| Triglycerides*** | 1.8 | 1.1 | 2.1 | 1.3 | 1.6 | 0.9 |
| Glucose*** | 5.6 | 1.4 | 5.8 | 1.6 | 5.4 | 1.0 |
| Pack years*** | 10.2 | 17.3 | 12.7 | 17.9 | 6.5 | 11.9 |
| % | % | % | ||||
| Educational statusα,*** Low | 5.5 | 3.2 | 7.8 | |||
| Middle | 66.2 | 59.5 | 72.7 | |||
| High | 28.3 | 37.3 | 19.5 | |||
| Smoking status*** Never | 43.9 | 35.4 | 52.2 | |||
| Former | 35.3 | 42.0 | 28.8 | |||
| Current | 20.8 | 22.6 | 19.1 | |||
| Physical Activityβ,*** Low | 36.4 | 30.3 | 42.3 | |||
| Middle | 33.4 | 32.0 | 34.8 | |||
| High | 30.2 | 37.7 | 22.9 | |||
| Diabetes, physician diagnosed*** | 2.2 | 3.4 | 1.0 | |||
| Hypertension, physician diagnosed*** | 17.1 | 20.0 | 14.2 | |||
| CVDγ, physician diagnosed*** | 20.9 | 24.3 | 17.5 | |||
| SAPALDIA 3 | Mean | SD | Mean | SD | Mean | SD |
| CIMT average (mm) | 0.74 | 0.13 | 0.76 | 0.13 | 0.72 | 0.12 |
| BMI (kg/m2)*** | 26.3 | 4.3 | 27.0 | 3.7 | 25.5 | 4.7 |
| Systolic blood pressure (mm Hg)*** | 135.3 | 18.7 | 138.3 | 17.7 | 132.4 | 19.3 |
| Diastolic blood pressure (mm Hg)*** | 79.3 | 10.3 | 80.9 | 10.3 | 77.6 | 10.0 |
| Pack years*** | 13.0 | 20.6 | 16.4 | 23.1 | 9.0 | 16.4 |
| % | % | % | ||||
| Smoking Status*** Never | 43.1 | 34.8 | 51.3 | |||
| Former | 41.8 | 49.4 | 34.4 | |||
| Current | 15.1 | 15.8 | 14.4 | |||
| CVDδ, physician diagnosed*** | 54.9 | 59.9 | 50.0 | |||
| α Educational status: based on reported highest educational degree; β physical activity: reported hours of vigorous physical activity; γ CVD in SAPALDIA 2: doctor diagnosis of hypertension, heart disease, myocardial infarction or stroke; δ CVD in SAPALDIA 3: doctor diagnosis same as SAPALDIA 2 plus arrhythmias, angina pectoris, heart insufficiency; difference by gender (chi2, ANOVA) *** p<0.001 | ||||||
| Supplemental table 2: Association of AGLA-1 and SCORE with average carotid intima media thickness in SAPALDIA 3 by sex. | ||||||||
| Men n = 1383 | Women n = 1429 | |||||||
| AGLA | Estimated % differenceβ | 95% CI | p-value | Estimated % differenceβ | 95% CI | p-value | ||
| <1% 10-year risk | Reference | |||||||
| 1%‒2% | 6.90 | 3.32 | 10.40 | <0.001 | 5.90 | 3.23 | 8.50 | <0.001 |
| 2%‒5% | 11.90 | 8.81 | 15.10 | <0.001 | 10.10 | 8.16 | 12.10 | <0.001 |
| 5%‒10% | 16.70 | 13.53 | 19.90 | <0.001 | 16.30 | 14.17 | 18.40 | <0.001 |
| 10%‒20% | 21.30 | 17.75 | 24.80 | <0.001 | 19.60 | 17.01 | 22.20 | <0.001 |
| >20% | 20.00 | 14.19 | 25.90 | <0.001 | 23.20 | 18.41 | 27.90 | <0.001 |
| SCORE | ||||||||
| <1% 10-year risk | Reference | |||||||
| 1% | 4.70 | 2.32 | 7.00 | <0.001 | 9.20 | 7.40 | 11.00 | <0.001 |
| 2% | 9.90 | 7.36 | 12.40 | <0.001 | 17.00 | 13.68 | 20.40 | <0.001 |
| 3%‒4% | 15.60 | 12.97 | 18.20 | <0.001 | 21.70 | 17.84 | 25.60 | <0.001 |
| >5% | 18.50 | 15.41 | 21.60 | <0.001 | 26.60 | 18.37 | 34.80 | <0.001 |
| β The estimated % difference refers to the difference from the geometric mean CIMT (0.728 mm) | ||||||||
| Supplemental table 3: Association between AGLA-1 and SCORE and aCIMT, adjusted for BMI, pack years, physical activity and educational status at SAPALDIA 2. | ||||
| AGLA-1α | β-coeff.β | 95% CI | p-value | |
| <1% 10-year risk | Reference | |||
| 1%‒2% | 6.0 | 4.0 | 8.0 | <0.001 |
| 2%‒5% | 10.2 | 8.6 | 11.8 | <0.001 |
| 5%‒10% | 15.0 | 13.3 | 16.7 | <0.001 |
| 10%‒20% | 19.0 | 17.0 | 21.1 | <0.001 |
| >20% | 20.1 | 16.4 | 23.8 | <0.001 |
| SCOREα | β-coeff.β | 95% CI | p-value | |
| <1% 10-year risk | References | |||
| 1% | 6.5 | 5.1 | 7.9 | <0.001 |
| 2% | 11.0 | 9.2 | 12.9 | <0.001 |
| 3%‒4% | 16.1 | 14.1 | 18.1 | <0.001 |
| >5% | 18.2 | 15.5 | 20.8 | <0.001 |
| α For BMI, pack years, physical activity and educational status, study centre (random effect) at SAPALDIA 2; β the estimated % difference refers to the difference from the geometric mean CIMT (0.728 mm) | ||||
| Supplemental table 4: Association between AGLA-1 and aCIMT, adjusted for heart medication intake at SAPALDIA 3. | ||||
| AGLA-1 risk score* | β-coeff. | 95% CI | p-value | |
| 10-year risk <1% | ||||
| 1%‒2% | 0.065 | 0.046 | 0.085 | 0.000 |
| 2%‒5% | 0.110 | 0.095 | 0.126 | 0.000 |
| 5%‒10% | 0.162 | 0.146 | 0.179 | 0.000 |
| 10%‒20% | 0.202 | 0.183 | 0.222 | 0.000 |
| >20% | 0.213 | 0.176 | 0.249 | 0.000 |
| * Adjusted for heart medication intake at SAPALDIA 3 and study area as random effect | ||||
1 Unal B, Critchley JA, Capewell S. Explaining the Decline in Coronary Heart Disease Mortality in England and Wales Between 1981 and 2000. Circulation. 2004;109(9):1101–7.
2 Kahn R, Robertson RM, Smith R, Eddy D. The Impact of Prevention on Reducing the Burden of Cardiovascular Disease. Circulation. 2008;118(5):576–85.
3 Murray CJL, Vos T, Lozano R, Naghavi M, Flaxman AD, Michaud C, et al. Disability-adjusted life years (DALYs) for 291 diseases and injuries in 21 regions, 1990–2010: a systematic analysis for the Global Burden of Disease Study 2010. The Lancet. 2012;380(9859):2197–223.
4 Gohlke H. Primary prevention of coronary artery disease: is there a role for risk scores? Herz. 2012;37(1):75–80.
5 Conroy RM, Pyorala K, Fitzgerald AP, Sans S, Menotti A, De Backer G, et al. Estimation of ten-year risk of fatal cardiovascular disease in Europe: the SCORE project. Eur Heart J. 2003;24(11):987–1003.
6 Assmann G, Cullen P, Schulte H. Simple Scoring Scheme for Calculating the Risk of Acute Coronary Events Based on the 10–Year Follow-Up of the Prospective Cardiovascular Münster (PROCAM) Study. Circulation. 2002;105(3):310–5.
7 Campuzano R, Moya JL, Garcia-Lledo A, Tomas JP, Ruiz S, Megias A, et al. Endothelial dysfunction, intima-media thickness and coronary reserve in relation to risk factors and Framingham score in patients without clinical atherosclerosis. J Hypertens. 2006;24(8):1581–8.
8 Nambi V, Chambless L, He M, Folsom AR, Mosley T, Boerwinkle E, et al. Common carotid artery intima–media thickness is as good as carotid intima–media thickness of all carotid artery segments in improving prediction of coronary heart disease risk in the Atherosclerosis Risk in Communities (ARIC) study. Eur Heart J. 2012;33(2):183–90.
9 Baldassarre D, Hamsten A, Veglia F, de Faire U, Humphries SE, Smit AJ, et al. Measurements of Carotid Intima-Media Thickness and of Interadventitia Common Carotid Diameter Improve Prediction of Cardiovascular Events: Results of the IMPROVE (Carotid Intima Media Thickness [IMT] and IMT-Progression as Predictors of Vascular Events in a High Risk European Population) Study. J Am Coll Cardiol. 2012;60(16):1489–99.
10 Costanzo P, Perrone-Filardi P, Vassallo E, Paolillo S, Cesarano P, Brevetti G, et al. Does carotid intima-media thickness regression predict reduction of cardiovascular events? A meta-analysis of 41 randomized trials. J Am Coll Cardiol. 2010;56(24):2006–20.
11 Lorenz MW, Polak JF, Kavousi M, Mathiesen EB, Volzke H, Tuomainen TP, et al. Carotid intima-media thickness progression to predict cardiovascular events in the general population (the PROG-IMT collaborative project): a meta-analysis of individual participant data. Lancet. 2012;379(9831):2053–62.
12 Kieltyka L, Urbina EM, Tang R, Bond MG, Srinivasan SR, Berenson GS. Framingham risk score is related to carotid artery intima-media thickness in both white and black young adults: the Bogalusa Heart Study. Atherosclerosis. 2003;170(1):125–30.
13 Raiko JR, Magnussen CG, Kivimaki M, Taittonen L, Laitinen T, Kahonen M, et al. Cardiovascular risk scores in the prediction of subclinical atherosclerosis in young adults: evidence from the cardiovascular risk in a young Finns study. Eur J Cardiovasc Prev Rehabil. 2010;17(5):549–55.
14 von Sarnowski B, Lüdemann J, Völzke H, Dörr M, Kessler C, Schminke U. Common Carotid Intima-Media Thickness and Framingham Risk Score Predict Incident Carotid Atherosclerotic Plaque Formation: Longitudinal Results From the Study of Health in Pomerania. Stroke. 2010;41(10):2375–7.
15 Herder M, Johnsen SH, Arntzen KA, Mathiesen EB. Risk Factors for Progression of Carotid Intima-Media Thickness and Total Plaque Area: A 13–Year Follow-Up Study: The Tromsø Study. Stroke. 2012;43(7):1818–23.
16 Ackermann-Liebrich U, Kuna-Dibbert B, Probst-Hensch NM, Schindler C, Felber Dietrich D, Stutz EZ, et al. Follow-up of the Swiss Cohort Study on Air Pollution and Lung Diseases in Adults (SAPALDIA 2) 1991–2003: methods and characterization of participants. Soz Praventivmed. 2005;50(4):245–63.
17 Martin BW, Ackermann-Liebrich U, Leuenberger P, Kunzli N, Stutz EZ, Keller R, et al. SAPALDIA: methods and participation in the cross-sectional part of the Swiss Study on Air Pollution and Lung Diseases in Adults. Soz Praventivmed. 1997;42(2):67–84.
18 Teynor A, Caviezel S, Dratva J, Kunzli N, Schmidt-Trucksass A. An automated, interactive analysis system for ultrasound sequences of the common carotid artery. Ultrasound Med Biol. 2012;38(8):1440–50.
19 Touboul PJ, Hennerici MG, Meairs S, Adams H, Amarenco P, Bornstein N, et al. Mannheim carotid intima-media thickness and plaque consensus (2004–2006–2011). An update on behalf of the advisory board of the 3rd, 4th and 5th watching the risk symposia, at the 13th, 15th and 20th European Stroke Conferences, Mannheim, Germany, 2004, Brussels, Belgium, 2006, and Hamburg, Germany, 2011. Cerebrovasc Dis. 2012;34(4):290–6.
20 Caviezel S, Dratva J, Schaffner E, Teynor A, Baumstark MW, Schindler C, et al. Variability and reproducibility of carotid structural and functional parameters assessed with transcutaneous ultrasound – Results from the SAPALDIA Cohort Study. Atherosclerosis. 2013;231(2):448–55.
21 Felber Dietrich D, Schindler C, Schwartz J, Barthélémy J-C, Tschopp J-M, Roche F, et al. Heart rate variability in an ageing population and its association with lifestyle and cardiovascular risk factors: results of the SAPALDIA study. Europace. 2006;8(7):521–9.
22 Dratva J, Zemp E, Staedele P, Schindler C, Constanza MC, Gerbase M, et al. Variability of reproductive history across the Swiss SAPALDIA cohort--patterns and main determinants. Ann Hum Biol. 2007;34(4):437–53.
23 Dratva J, Gomez Real F, Schindler C, Ackermann-Liebrich U, Gerbase MW, Probst-Hensch NM, et al. Is age at menopause increasing across Europe? Results on age at menopause and determinants from two population-based studies. Menopause. 2009;16(2):385–94.
24 Everitt BS, Dunn G. Applied multivariate data analysis 2nd ed. London: Arnold 2001.
25 Bernini GP, Moretti A, Sgro M, Argenio GF, Barlascini CO, Cristofani R, et al. Influence of endogenous androgens on carotid wall in postmenopausal women. Menopause. 2001;8(1):43–50.
26 Nabulsi AA, Folsom AR, White A, Patsch W, Heiss G, Wu KK, et al. Association of hormone-replacement therapy with various cardiovascular risk factors in postmenopausal women. The Atherosclerosis Risk in Communities Study Investigators. N Engl J Med. 1993;328(15):1069–75.
27 Meadows JL, Vaughan DE. Endothelial biology in the post-menopausal obese woman. Maturitas. 2011;69(2):120–5.
28 Muscelli E, Kozakova M, Flyvbjerg A, Kyriakopoulou K, Astiarraga BD, Glintborg D, et al. The effect of menopause on carotid artery remodeling, insulin sensitivity, and plasma adiponectin in healthy women. Am J Hypertens. 2009;22(4):364–70.
29 Femia R, Kozakova M, Nannipieri M, Gonzales-Villalpando C, Stern MP, Haffner SM, et al. Carotid Intima-Media Thickness in Confirmed Prehypertensive Subjects: Predictors and Progression. Arteriosclerosis, Thrombosis, and Vascular Biology. 2007;27(10):2244–9.
30 Kerkhof GF, Duivenvoorden HJ, Leunissen RW, Hokken-Koelega AC. Pathways leading to atherosclerosis: a structural equation modeling approach in young adults. Hypertension. 2011;57(2):255–60.
31 Kotseva K, Wood D, De Backer G, De Bacquer D, Pyorala K, Keil U, et al. Cardiovascular prevention guidelines in daily practice: a comparison of EUROASPIRE I, II, and III surveys in eight European countries. Lancet. 2009;373(9667):929–40.
32 Banegas JR, Lopez-Garcia E, Dallongeville J, Guallar E, Halcox JP, Borghi C, et al. Achievement of treatment goals for primary prevention of cardiovascular disease in clinical practice across Europe: the EURIKA study. Eur Heart J. 2011;32(17):2143–52.
33 Kaess BM, Rong J, Larson MG, Hamburg NM, Vita JA, Levy D, et al. Aortic stiffness, blood pressure progression, and incident hypertension. JAMA. 2012;308(9):875–81.
34 Schmitz G, Torzewski M. Atherosclerosis: an inflammatory disease. In: Mehta JL, editor. Inflammatory and Infectious Baseis of Atherosclerosis. Basel: Birkhäuser Verlag 2001. p. 1–21.
35 Den Ruijter HM, Peters SA, Anderson TJ, Britton AR, Dekker JM, Eijkemans MJ, et al. Common carotid intima-media thickness measurements in cardiovascular risk prediction: a meta-analysis. JAMA. 2012;308(8):796–803.
36 Elias-Smale SE, Kavousi M, Verwoert GC, Koller MT, Steyerberg EW, Mattace-Raso FU, et al. Common carotid intima-media thickness in cardiovascular risk stratification of older people: the Rotterdam Study. Eur J Prev Cardiol. 2012;19(4):698–705.
37 Bots ML, Groenewegen KA, Anderson TJ, Britton AR, Dekker JM, Engstrom G, et al. Common carotid intima-media thickness measurements do not improve cardiovascular risk prediction in individuals with elevated blood pressure: the USE-IMT collaboration. Hypertension. 2014;63(6):1173–81.
38 Perk J, De Backer G, Gohlke H, Graham I, Reiner Z, Verschuren M, et al. European Guidelines on cardiovascular disease prevention in clinical practice (version 2012). The Fifth Joint Task Force of the European Society of Cardiology and Other Societies on Cardiovascular Disease Prevention in Clinical Practice (constituted by representatives of nine societies and by invited experts). Eur Heart J. 2012;33(13):1635–701.
39 Romanens M, Ackermann F, Sudano I, Szucs T, Spence JD. Arterial age as a substitute for chronological age in the AGLA risk function could improve coronary risk prediction. Swiss Med Wkly. 2014;144:w13967.
40 Inaba Y, Chen JA, Bergmann SR. Carotid plaque, compared with carotid intima-media thickness, more accurately predicts coronary artery disease events: A meta-analysis. Atherosclerosis. 2012;220(1):128–33.
41 Wannarong T, Parraga G, Buchanan D, Fenster A, House AA, Hackam DG, et al. Progression of carotid plaque volume predicts cardiovascular events. Stroke. 2013;44(7):1859–65.
42 Finn AV, Kolodgie FD, Virmani R. Correlation Between Carotid Intimal/Medial Thickness and Atherosclerosis: A Point of View From Pathology. Arterioscler Thromb Vasc Biol. 2010;30(2):177–81.
43 Bots ML, Hofman A, De Jong PT, Grobbee DE. Common carotid intima-media thickness as an indicator of atherosclerosis at other sites of the carotid artery. The Rotterdam Study. Ann Epidemiol. 1996;6(2):147–53.
Funding / potential competing interests: SAPALDIA has been funded by the SNF and other regional and administrative organisations (see supplement). Authors state no conflict of interest.