DOI: https://doi.org/10.4414/smw.2014.13986
Abbreviations
ACS Acute coronary syndrome
AMIS Acute myocardial infarction in Switzerland
ANOVA Analysis of variance
BMI Body Mass Index
CI Confidence interval
MI Myocardial infarction
OR Odds ratio
PCI Percutaneous coronary intervention
ROC Receiver operating curve
STEMI ST-elevation myocardial infarction
WHO World Health Organisation
The observation that obese patients seem to have better outcomes than normal weight patients in a variety of disease conditions is known as “the obesity paradox” [1–3]. In the context of acute coronary syndromes (ACSs), some studies found a reduced short- or long-term mortality in obese patients after an acute event [4–6] although obesity is causally linked to several adverse effects, such as insulin resistance, dyslipidaemia and increased systemic inflammation [7]. It was therefore suggested that obesity may have protective effects in patients with ACS [8]. Careful verification is required given the well-known role obesity plays as a risk factor for developing cardiovascular diseases, still the most common cause of death worldwide [9].
Conflicting results are available on the obesity paradox in hospitalised patients with ST-elevation myocardial infarction (STEMI) who underwent PCI. Previous studies showed a lower in-hospital mortality rate for obese patients but the significant negative relationship was attenuated by correcting for confounders [10–12], thus weakening the hypothesis that obesity may be an independent protection factor in this patient group. However, a meta-analysis that combined the results of five observational cohort studies supported the hypothesis that overweight and obesity have a significant protective effect [13]. Therefore, it is still not clearly understood whether the paradoxical relationship between obesity and mortality is causal or not and only limited data are available.
The aim of this study was to investigate the impact of Body Mass Index (BMI) on in-hospital mortality in Swiss patients who suffered a STEMI and underwent PCI, and to assess if confounding factors may explain the obesity paradox.
The analysis was based on data from the AMIS Plus registry, an on-going nationwide prospective registry of patients admitted with ACS to hospitals in Switzerland. Since January 1997, the AMIS Plus registry collects data on patients with acute myocardial infarction (AMI) who are hospitalised and treated in Swiss hospitals. Details have been previously published [14, 15]. The participation of hospitals is voluntary and since 1997, 82 hospitals, ranging from community-level institutions to large tertiary facilities, have been collecting temporarily or continuously data for AMIS Plus. The registry has been approved by the Supra-Regional Ethics Committee for Clinical Studies, the Swiss Board for Data Security, and the Cantonal Ethics Commissions.
For this analysis, patients enrolled between 1 January 2005 and 9 July 2012 with a discharge diagnosis of STEMI were included. In AMIS Plus, STEMI is defined by characteristic symptoms, ST-elevation and/or new left bundle branch block on the initial ECG, and total creatine kinase or creatine kinase MB fraction at least twice the upper limit of normal or troponin I or T above individual hospital cut-off levels for AMI. Patients with missing BMI data were excluded. The analysis was limited to patients who underwent PCI in order to reduce biases due to different therapeutic and reperfusion strategies. Patients were stratified into BMI groups according to the international classifications of the World Health Organisation (WHO) [16]: underweight (BMI <18.5 kg/m2), normal weight (BMI 18.5–24.9 kg/m2), overweight (BMI 25–29.9 kg/m2), obese class I (BMI 30–34.9 kg/m2), obese class II (BMI 35–39.9 kg/m2) and obese class III (BMI ≥40 kg/m2). As only 85 patients were in obese class III, obese class II and obese class III were combined into one group so that in the end only five BMI groups were used for analysis.
The endpoint of interest was in-hospital mortality; cardiac and non-cardiac causes of death were included. Covariate selection was based on prior knowledge – for example known risk factors for cardiovascular disease were included [17]. All covariates are listed in table 1. BMI was calculated using height and weight at admission and treated in the analysis as a categorical variable as described above. Age was used as a continuous variable. All other covariates were dichotomous. Of the risk factors considered, diabetes mellitus, arterial hypertension and dyslipidaemia were assumed to be present if the patient had previously been treated and/or diagnosed by a physician. Documentation of risk factors was accepted as provided by the treating hospital. Family history of ischaemic heart disease was defined as the presence of ischaemic heart disease in a first-degree relative younger than 60 years. History of coronary artery disease was defined as a report of previous angina pectoris and/or myocardial infarction. A patient was defined as a current smoker if he had smoked at least 100 cigarettes in his life and was currently smoking. Co-morbidities were assessed using the Charlson Index [18]. Description of acute clinical status at admission was based on the need for resuscitation prior to admission, presence of atrial fibrillation and Killip class (≤ 2 versus >2). Multivessel disease was regarded as being present if the angiography during hospitalisation identified more than one involved vessel.
Discrete variables are presented as frequencies and the Pearson chi-square test was used to compare frequencies between BMI groups. Continuous variables are described as means (standard deviation [SD]) and analysis of variance or the Kruskal-Wallis test were used to compare BMI group differences for normally distributed and non-normally distributed variables, respectively.
Logistic regression analysis was used to assess univariate associations between in-hospital mortality and BMI groups or covariates, as well as for multivariate analysis. For the unadjusted and adjusted analyses, BMI groups were entered as categorical variables and normal weight was set as the reference category. All available covariates were included in the multivariate model if they showed a p-value <0.2 in the univariate analysis. The Hosmer-Lemeshow goodness of fit test was used to assess model fit and receiver operating characteristic (ROC) curve analysis was used to determine the discrimination power of the model.
For all statistical analyses SPSS (Chicago, Illinois, USA) for Windows XP (version 20.0) was used. A p-value ≤0.05 was considered to indicate statistical significance for all tests.
| Table 1: Admission characteristics and angiographic data according to BMI. | |||||||
| BMI groups | |||||||
| Underweight | Normal weight | Overweight | Obese class I | Obese class II/III | p-value | ||
| Number of patients | n | 67 | 2294 | 3123 | 1105 | 349 | |
| Male | n (%) | 20 (29.9) | 1630 (71.1) | 2576 (82.5) | 888 (80.4) | 236 (67.6) | <0.001 |
| Age in years | mean (SD) | 67.8 (13.9) | 64.2 (13.2) | 62.7 (12.0) | 60.7 (11.9) | 60.9 (12.2) | <0.001 |
| range | 32.1–88.9 | 21.8–97.8 | 23.9–94.9 | 19.2–88.9 | 24.4–86.8 | ||
| BMI [kg/m2] | mean (SD) | 17.4 (0.8) | 23.0 (1.5) | 27.2 (1.4) | 31.9 (1.4) | 38.6 (3.8) | <0.001 |
| range | 14.6–18.4 | 18.5–24.9 | 25.0–29.9 | 30.0–34.9 | 35.0–61.6 | ||
| History of coronary artery disease | n (%) | 11/66 (16.7) | 589/2274 (25.9) | 866/3080 (28.1) | 285/1088 (26.2) | 90/346 (26.0) | 0.116 |
| Risk factors | |||||||
| Diabetes mellitus | n (%) | 6/62 (9.7) | 224/2206 (10.2) | 456/3010 (15.1) | 252/1064 (23.7) | 130/337 (38.6) | <0.001 |
| Arterial hypertension | n (%) | 35/67 (52.2) | 1058/2163 (48.9) | 1586/2945 (53.9) | 702/1058(66.4) | 258/334 (77.2) | <0.001 |
| Dyslipidaemia | n (%) | 21/61 (34.4) | 874/2025 (43.2) | 1402/2748 (51.0) | 515/968 (53.2) | 183/307 (59.6) | <0.001 |
| Current smoker | n (%) | 33/55 (60.0) | 980/2100 (46.7) | 1213/2858 (42.4) | 480/1024 (46.9) | 132/324 (40.7) | 0.001 |
| Family history | n (%) | 10/57 (17.5) | 639/1978 (32.3) | 942/2716 (34.7) | 341/960 (35.5) | 94/302 (31.1) | 0.018 |
| Co-morbidities | |||||||
| Cancer | n (%) | 5/65 (7.7) | 113/2247 (5.0) | 142/3042 (4.7) | 39/1082 (3.6) | 10/341 (2.9) | 0.134 |
| Moderate to severe renal disease | n (%) | 12/65 (18.5) | 103/2247 (4.6) | 101/3042 (3.3) | 34/1082 (3.1) | 15/341 (4.4) | <0.001 |
| Peripheral vascular disease (ST III/IV) | n (%) | 9/65 (13.8) | 65/2247 (2.9) | 76/3042 (2.5) | 35/1082 (3.2) | 17/341 (5.0) | <0.001 |
| Cardiac insufficiency (NYHA III/IV) | n (%) | 5/65 (7.7) | 34/2247 (1.5) | 42/3042 (1.4) | 15/1082 (1.4) | 10/341 (2.9) | <0.001 |
| Resuscitation prior to admission | n (%) | 3/67 (4.5) | 148/2294 (6.5) | 174/3123 (5.6) | 57/1105 (5.2) | 17/349 (4.9) | 0.451 |
| Killip class | |||||||
| Killip class >2 | n (%) | 7/67 (10.4) | 156/2276 (6.9) | 178/3102 (5.7) | 62/1103 (5.6) | 22/346 (6.4) | 0.235 |
| Heart rhythm | |||||||
| Atrial fibrillation | n (%) | 3/67 (4.5) | 64/2294 (2.8) | 84/3121 (2.7) | 36/1105 (3.3) | 12/349 (3.4) | 0.730 |
| Angiographic findings | |||||||
| Multi vessel disease | n (%) | 38/63 (60.3) | 1284/2272 (56.5) | 1803/3100 (58.2) | 613/1094 (56.0) | 200/347 (57.6) | 0.648 |
| BMI, Body Mass Index | |||||||
| Table 2: In-hospital death and complications according to BMI. | |||||||
| BMI groups | |||||||
| Underweight | Normal weight | Overweight | Obese class 1 | Obese class II/III | p-value | ||
| In-hospital death | n (%) | 6/67 (9.0) | 80/2294 (3.5) | 94/3123 (3.0) | 22/1105 (2.0) | 15/349 (4.3) | 0.005 |
| Reinfarction | n (%) | 0/67 (0.0) | 22/2294 (1.0) | 19/3122 (0.6) | 9/1104 (0.8) | 3/349 (0.9) | 0.602 |
| Cerebrovasc. event | n (%) | 0/67 (0.0) | 17/2294 (0.7) | 20/3122 (0.6) | 7/1104 (0.6) | 3/349 (0.9) | 0.930 |
| Cardiogenic shock | n (%) | 6/67 (9.0) | 95/2294 (4.1) | 98/3122 (3.1) | 32/1104 (2.9) | 19/349 (5.4) | 0.006 |
| BMI, Body Mass Index | |||||||
Between 1 January 2005 and 9 July 2012, 18,525 patients with ACS were enrolled in the AMIS Plus registry. From the 9,949 patients classified as having STEMI, 7,891 patients underwent PCI. Of these, 6,938 (87.9%) patients with valid data on BMI were included in the analysis. The mean (SD) age of the patients included was 62.8 (12.5) years; the age range was 19.2 to 97.8 years and 77.1% of them were male. According to the defined BMI groups, 67 patients (1%) were underweight, 2294 (33.1%) were of normal weight, 3123 (45.0%) were overweight, 1105 (15.9%) had class I-obesity and 349 (5%) had class II/III-obesity.
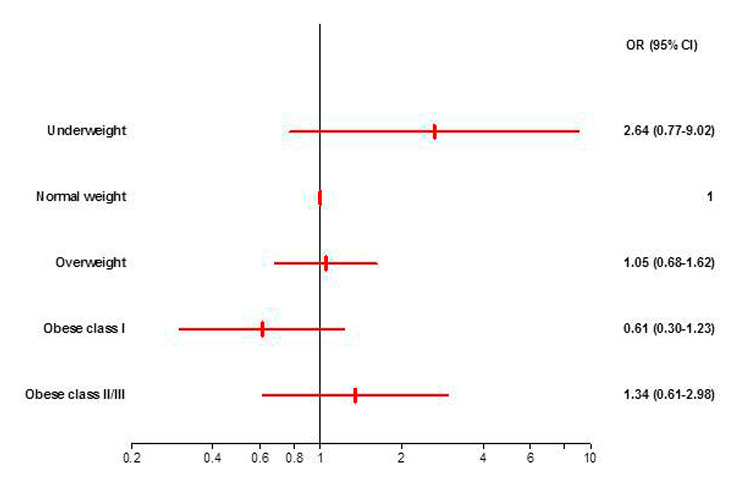
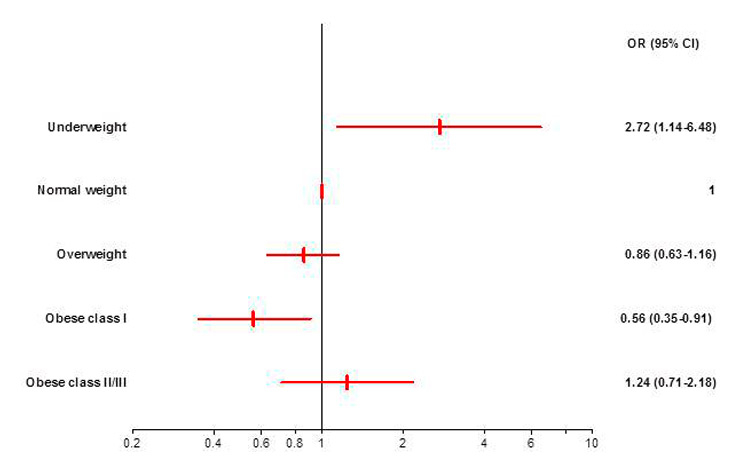
Figure 1
a: Unadjusted odds ratios with 95% CI for in-hospital mortality by BMI categories with normal weight patients as the reference. The odds for in-hospital mortality were significantly higher for underweight and significantly lower for obese class I patients. OR, Odds Ratio. CI, Confidence Interval.
b: Adjusted odds ratios with 95% CI for in-hospital mortality by BMI categories with normal weight patients as the reference. None of the BMI groups differed significantly in the odds for in-hospital mortality compared with normal weight patients. OR, Odds Ratio. CI, Confidence Interval.
Table 1 shows patient characteristics on admission and angiographic findings for BMI groups. With increasing BMI, patients were younger and more likely to be diabetic and dyslipidaemic. The occurrence of arterial hypertension also increased with increasing BMI, except for underweight patients who were more likely to be hypertensive than normal weight patients. The underweight group had the highest prevalence for moderate to severe renal disease, peripheral vascular disease as well as cardiac insufficiency. Proportions of patients with history of coronary artery disease or cancer did not differ significantly between BMI groups. There was also no significant difference in the percentage of patients with Killip class >2 or atrial fibrillation at admission and the need for resuscitation prior to admission was similar in all groups. Angiographic findings did not show significant differences in the prevalence of multivessel disease.
Of the 6,938 patients, 217 (3.1%) died during hospitalisation. The mortality rate was higher in females (3.7%) than in males (3.0%) but the difference was not significant (p = 0.171). In-hospital mortality differed significantly between BMI groups (p = 0.005). It showed a U-shaped distribution with the lowest mortality in patients with class I obesity (2.0%) and the highest mortality in underweight patients (9.0%) (table 2).
Table 2 shows the occurrence of complications during hospitalisation by BMI group. The occurrence of re-infarction and cerebrovascular events did not differ between the groups. In contrast, the occurrence of cardiogenic shock during hospitalisation differed significantly (p = 0.006) between BMI groups; it was highest in underweight (9.0%) and class II/III-obese (5.4%) patients.
Overall, BMI groups were significantly associated with in-hospital mortality (p = 0.008) in the unadjusted analysis. In relation to the normal weight category, the odds for in-hospital mortality were significantly lower for patients with obesity class I (OR 0.56; 95% CI 0.35–0.91) and significantly higher for underweight patients (OR 2.72; 95% CI 1.14–6.48). The odds for overweight and obese class II/III patients did not differ significantly from the normal weight category (fig. 1a). The ORs for all BMI groups indicated a U-shaped relationship of BMI and in-hospital mortality (fig. 1a).
After statistical adjustment, BMI groups were no longer significantly associated with in-hospital mortality (p = 0.224). The odds for in-hospital mortality of the underweight, overweight, obese class I and obese class II/III patients did not differ significantly from the odds of the normal weight group but a U-shaped relationship was still visible (fig. 1b).
As visible in table 3, the strongest independent predictors of in-hospital mortality in the multivariate model were age per additional year (OR 1.06; 95% CI 1.04–1.09), history of diabetes (OR 2.15; 95% CI 1.37–3.38), moderate to severe renal disease (OR 2.32; 95% CI 1.28–4.21), resuscitation prior to admission (OR 5.58; 95% CI 3.40–9.18) and Killip class >2 (OR 8.01; 95%CI 5.18–12.37). All these covariates showed a positive significant association with in-hospital mortality whereas the other covariates did not show a significant impact in the multivariate analysis.
The Hosmer-Lemeshow goodness of fit test showed no significance (p = 0.505), indicating that the predicted values of the model do not differ significantly from the observed values. The ROC analysis showed an area under the curve of 0.877 (p = 0.001; 95%CI 0.85–0.91) indicating excellent discriminatory power of the model.
| Table 3: Adjusted effects on in-hospital mortality (logistic regression model, N = 5,400). | |||
| Variables | B | OR (95% CI) | p |
| BMI groups | – | 0.224 | |
| Underweight | 0.970 | 2.64 (0.77–9.02) | 0.122 |
| Normal weight | – | 1 | – |
| Overweight | 0.047 | 1.05 (0.68–1.62) | 0.831 |
| Obese class I | –0.503 | 0.61 (0.30–1.23) | 0.167 |
| Obese class II/III | 0.295 | 1.34 (0.61–2.98) | 0.468 |
| Female | 0.082 | 1.09 (0.70–1.67) | 0.709 |
| Age (per additional year) | 0.062 | 1.06 (1.04–1.09) | <0.001 |
| History of coronary artery disease | 0.286 | 1.33 (0.86–2.05) | 0.194 |
| Diabetes mellitus | 0.766 | 2.15 (1.37–3.38) | 0.001 |
| Arterial hypertension | –0.157 | 0.86 (0.55–1.33) | 0.489 |
| Dyslipidaemia | –0.126 | 0.88 (0.59–1.33) | 0.547 |
| Current smoker | –0.011 | 0.99 (0.62–1.59) | 0.964 |
| Cancer | 0.563 | 1.76 (0.93–3.32) | 0.083 |
| Moderate to severe renal disease | 0.843 | 2.32 (1.28–4.21) | 0.005 |
| Peripheral vascular disease (ST III/IV) | –0.120 | 0.89 (0.36–2.16) | 0.792 |
| Cardiac insufficiency (NYHA III/IV) | 0.419 | 1.52 (0.64–3.60) | 0.340 |
| Resuscitation prior to admission | 1.720 | 5.58 (3.40–9.18) | <0.001 |
| Killip class >2 | 2.080 | 8.01 (5.18–12.37) | <0.001 |
| Constant | –8.833 | <0.001 | |
| BMI, Body Mass Index. OR, Odds Ratio | |||
This study showed that an apparent obesity paradox in Swiss patients with acute STEMI who underwent PCI can be, at least partly, explained by confounders. The descriptive analysis showed a U-shaped distribution of the crude in-hospital mortality rate across BMI groups with the lowest mortality in class I obese patients. Unadjusted logistic regression analysis indicated that obesity class I patients were significantly less likely and underweight patients significantly more likely to die during hospitalisation compared with normal weight patients. However, after adjustment for covariates these differences between BMI groups were substantially reduced and BMI group was no longer a significant predictor of in-hospital mortality in this specific patient population.
Therefore, even if this study revealed a U-shaped association between BMI and crude in-hospital mortality with best outcome for class I obese patients, it remains unclear how much BMI directly contributes to this protective effect and it seems that at least a part of the obesity paradox can be explained by covariates. These findings are in line with previous studies, which investigated the obesity paradox in patients hospitalised for STEMI [11, 12, 19]. Studies that focused, as this study, on PCI-treated patients showed an attenuation of an inverse association between BMI and in-hospital mortality after adjustment for confounders [10, 20, 21]. A meta analysis of five observational cohort studies supported a significant protective effect of overweight and obesity [13] but the included studies did not all use the WHO classification system for BMI and correction for confounders may be different in all these studies. Many other studies focused on the association of BMI and long-term mortality after PCI. In 2006, a meta analysis of cohort studies with follow ups between one to five years showed a clear U-shaped distribution of the adjusted relative risks for mortality among BMI groups for PCI patients, but only the underweight group showed a significant difference compared to the normal weight patients [22]. However, in the ensuing years, several studies strengthened the hypothesis that higher BMI brings a direct protective long-term effect in patients treated with PCI [8, 23, 24]. In general, it is difficult to evaluate the effect of obesity on mortality as not only are there multiple factors that influence mortality but also because only observational data can be used to address this question. The variation in the choice of confounders used in studies may explain the discrepant results on this topic.
In our study, obese class I patients were younger and had a lower renal disease rate than the other BMI groups. In the multivariate model, these two factors were independent predictors of in-hospital mortality and may therefore provide a partial explanation for the favourable mortality outcome in this group. In previous studies, age and persisting renal disease were also important factors attenuating the association of BMI and in-hospital mortality [10, 21] A recent study which investigated the impact of age on the prognostic value of BMI suggested that the obesity paradox should possibly be age-contextualised as they found that BMI only influenced mortality in patients <75 years [25]. The strongest predictor of in-hospital mortality in our patient sample was a Killip class >2. The occurrence of this risk factor was again lowest in the obese class I patients. On the other hand, obesity class I patients were more likely to have diabetes compared to the groups with lower BMI and this was shown in the multivariate model to significantly worsen the prognosis. Arterial hypertension and dyslipidaemia, two well-known risk factors for arteriosclerosis and AMI and often present in obese patients, seemed to have no significant influence on in-hospital mortality after STEMI.
The fact that not all studies work with the same BMI classification system makes it difficult to compare results. The question arises whether the WHO classification used here is ideal for investigating the topic studied. According to the WHO, normal weight includes patients with a BMI between 18.5–24.9 kg/m2, a range which may include severely ill persons in the lower part. Several co-morbidities or chronic disease states are related to low body weight [26] and a low BMI may reflect an increased metabolic demand, catabolic or inflammatory state, or a generally poorer health condition. Critical voices hold that in studies using a BMI range of 18.5–<25 kg/m2 for normal weight, the mortality in the normal weight group may thus be increased, leading to an apparent protective effect of a higher BMI [27]. However, an additional multivariate logistic regression analysis where we excluded patients with a BMI below 20 kg/m2 showed minimal changes in the odds ratios of BMI groups and all other covariates (data not shown). The underweight group in this study had an increased crude in-hospital mortality compared with the normal weight group but the relationship became non-significant after adjustment, probably due to the low number of patients in the underweight group.
The use of registry data implies some inevitable limitations. As only hospitalised patients are registered, there may be a survival bias and it is not possible to characterise the fraction of patients who die before reaching hospital. The fact that hospitals are not obliged to include all their patients with AMI may lead to additional selection effects. A further limitation is that the data on height and weight to calculate BMI might be rather anamnestic instead of measured in the case of most patients. Furthermore, the analysis is limited to the variables which are registered and potentially important factors may not be taken into account, such as for example compliance with medical treatment, cardiorespiratory fitness of patients or the differentiation between fat mass and lean mass. A study which investigated the impact of lean mass index and body fat on survival of patients with coronary heart disease found that, within three years, mortality was inversely related with lean mass index and body fat [28]. Therefore, further studies taking into account the body composition might provide an interesting basis for investigating if adipose tissue, now recognised as an endocrine organ [29], brings a direct protective effect.
An important strength of this study is that the analysis was performed with a well-defined study population as only PCI- treated patients were included. The exclusion of patients registered before 2005 reduced the influence of technical progress, changes in clinical management, and quality, which have improved over the years.
To our knowledge this is the first study to investigate the obesity paradox in patients with STEMI in Switzerland and may contribute to a better understanding of the risk profile of a patient after AMI. Further studies are needed to investigate the reasons for lower mortality in obese patients, which may have implications for the treatment of BMI groups at higher risk.
This study showed a persistent U-shaped association between in-hospital mortality rates and BMI groups in patients with STEMI who underwent PCI in Switzerland with the lowest mortality in patients with obesity class I. However, the differences between BMI groups were not significant after correction for covariates. Lower age of obese patients when suffering an AMI seems to partly explain the obesity paradox and simultaneously underlines the importance of prevention for young, obese patients to reduce the risk of AMI at a young age. Other factors such as differences in medical treatment, absence of co-morbidities or direct protective effects of adipose tissue may additionally influence post-PCI mortality and should be studied further to fully understand the impacts responsible for the lower mortality in moderately obese patients.
Acknowledgements: The authors would like to thank our sponsors for their financial support. We also thank Jenny Piket for proofreading the manuscript.
1 Chrysant SG, Chrysant GS. New insights into the true nature of the obesity paradox and the lower cardiovascular risk. J Am Soc Hypertens. 2013;7(1):85–94.
2 McAuley PA, Blair SN. Obesity paradoxes. J Sports Sci. 2011;29(8):773–82.
3 Amundson DE, Djurkovic S, Matwiyoff GN. The obesity paradox. Crit Care Clin. 2010;26(4):583–96.
4 Buettner HJ, Mueller C, Gick M, Ferenc M, Allgeier J, Comberg T, et al. The impact of obesity on mortality in UA/non-ST-segment elevation myocardial infarction. Eur Heart J. 2007;28(14):1694–701.
5 Kadakia MB, Fox CS, Scirica BM, Murphy SA, Bonaca MP, Morrow DA. Central obesity and cardiovascular outcomes in patients with acute coronary syndrome: observations from the MERLIN-TIMI 36 trial. Heart. 2011;97(21):1782–7.
6 Sierra-Johnson J, Wright SR, Lopez-Jimenez F, Allison TG. Relation of body mass index to fatal and nonfatal cardiovascular events after cardiac rehabilitation. Am J Cardiol. 2005 Jul;96(2):211–4.
7 Lavie CJ, Milani RV, Ventura HO. Obesity and cardiovascular disease: risk factor, paradox, and impact of weight loss. J Am Coll Cardiol. 2009;53(21):1925–32.
8 Angeras O, Albertsson P, Karason K, Ramunddal T, Matejka G, James S, et al. Evidence for obesity paradox in patients with acute coronary syndromes: a report from the Swedish Coronary Angiography and Angioplasty Registry. Eur Heart J. 2012 Sep 4.
9 World Health Organization. Global status report on noncommunicable diseases. Geneva, Switzerland: World Health Organization. p. v.
10 Kosuge M, Kimura K, Kojima S, Sakamoto T, Ishihara M, Asada Y, et al. Impact of body mass index on in-hospital outcomes after percutaneous coronary intervention for ST segment elevation acute myocardial infarction. Circ J. 2008;72(4):521–5.
11 Das SR, Alexander KP, Chen AY, Powell-Wiley TM, Diercks DB, Peterson ED, et al. Impact of body weight and extreme obesity on the presentation, treatment, and in-hospital outcomes of 50,149 patients with ST-Segment elevation myocardial infarction results from the NCDR (National Cardiovascular Data Registry). J Am Coll Cardiol. 2011;58(25):2642–50.
12 Wienbergen H, Gitt AK, Juenger C, Schiele R, Heer T, Towae F, et al. Impact of the body mass index on occurrence and outcome of acute ST-elevation myocardial infarction. Clin Res Cardiol. 2008;97(2):83–8.
13 Oreopoulos A, Padwal R, Norris CM, Mullen JC, Pretorius V, Kalantar-Zadeh K. Effect of obesity on short- and long-term mortality postcoronary revascularization: A meta-analysis. Obesity. 2008;16(2):442–50.
14 Radovanovic D, Erne P. AMIS Plus: Swiss registry of acute coronary syndrome. Heart. 2010;96(12):917–21.
15 Stauffer JC, Goy JJ, Duvoisin N, Radovanovic D, Rickli H, Erne P. Dramatic effect of early clopidogrel administration in reducing mortality and MACE rates in ACS patients. Data from the Swiss registry AMIS-Plus. Swiss Med Wkly. 2012;142:w13573.
16 World Health Organization (2009) Global Database on Body Mass Index: BMI Classification. [database on the Internet] [cited 2014 Jan 20.]. Available from: http://apps.who.int/bmi/index.jsp?introPage=intro_3.html.
17 Yusuf S, Hawken S, Ounpuu S, Dans T, Avezum A, Lanas F, et al. Effect of potentially modifiable risk factors associated with myocardial infarction in 52 countries (the INTERHEART study): case-control study. Lancet. 2004;364(9438):937–52.
18 Charlson ME, Pompei P, Ales KL, MacKenzie CR. A new method of classifying prognostic comorbidity in longitudinal studies: development and validation. J Chronic Dis. 1987;40(5):373–83.
19 Goldberg RJ, Cui J, Olendzki B, Spencer F, Yarzebski J, Lessard D, et al. Excess body weight, clinical profile, management practices, and hospital prognosis in men and women after acute myocardial infarction. Am Heart J. 2006;151(6):1297–304.
20 Gurm HS, Whitlow PL, Kip KE. The impact of body mass index on short- and long-term outcomes inpatients undergoing coronary revascularization. Insights from the bypass angioplasty revascularization investigation (BARI). J Am Coll Cardiol. 2002;39(5):834–40.
21 Nikolsky E, Stone GW, Grines CL, Cox DA, Garcia E, Tcheng JE, et al. Impact of body mass index on outcomes after primary angioplasty in acute myocardial infarction. Am Heart J. 2006;151(1):168–75.
22 Romero-Corral A, Montori VM, Somers VK, Korinek J, Thomas RJ, Allison TG, et al. Association of bodyweight with total mortality and with cardiovascular events in coronary artery disease: a systematic review of cohort studies. Lancet. 2006;368(9536):666–78.
23 Oreopoulos A, McAlister FA, Kalantar-Zadeh K, Padwal R, Ezekowitz JA, Sharma AM, et al. The relationship between body mass index, treatment, and mortality in patients with established coronary artery disease: a report from APPROACH. Eur Heart J. 2009;30(21):2584–92.
24 Hastie CE, Padmanabhan S, Slack R, Pell AC, Oldroyd KG, Flapan AD, et al. Obesity paradox in a cohort of 4880 consecutive patients undergoing percutaneous coronary intervention. Eur Heart J. 2010;31(2):222–6.
25 Lazzeri C, Valente S, Chiostri M, Attana P, Picariello C, Sorini Dini C, et al. Impact of age on the prognostic value of body mass index in ST-Elevation myocardial infarction. Nutr Metab Cardiovasc Dis. 2013;23(3):205–11.
26 von Haehling S, Anker SD. Cachexia as major underestimated unmet medical need: Facts and numbers. Int J Cardiol. 2012;161(3):121–3.
27 Heymsfield SB. Does Body Mass Index Adequately Convey a Patient’s Mortality Risk? (vol 309, pg 87, 2013). Jama – J Am Med Assoc. 2013;309(5):442–.
28 Lavie CJ, De Schutter A, Patel DA, Romero-Corral A, Artham SM, Milani RV. Body composition and survival in stable coronary heart disease: impact of lean mass index and body fat in the “obesity paradox”. J Am Coll Cardiol. 2012;60(15):1374–80.
29 Fischer-Posovszky P, Wabitsch M, Hochberg Z. Endocrinology of adipose tissue – an update. Horm Metab Res. 2007;39(5):314–21.
Funding / potential competing interests: The AMIS Plus registry is funded by unrestricted grants from the Swiss Heart Foundation and from Abbot AG, Switzerland; Astra-Zeneca AG, Switzerland; Bayer (Schweiz) AG, Switzerland; Biotronik AG, Switzerland; Bristol-Myers Squibb AG, Switzerland; Daiichi-Sankyo/Lilly AG, Switzerland; Johnson & Johnson AG–Cordis Division, Switzerland; A Menarini AG, Switzerland; Merck Sharp & Dohme-Chibret AG, Switzerland; Medtronic AG, Switzerland; Pfizer AG, Switzerland; St. Jude Medical, Switzerland; Takeda Pharma AG, Switzerland, Vascular Medical GmbH, Switzerland. The sponsors did not play any role in the design, data collection, analysis, or interpretation of the registry.
1 Collaborators
AMIS Plus Participants 2005–2012: The authors would like to express their gratitude to the teams of the following hospitals (listed in alphabetical order with the names of the local principal investigators): Aarau, Kantonsspital (P Lessing); Affoltern am Albis, Spital (F Hess); Altdorf, Kantonsspital (R Simon); Baden, Kantonsspital (U Hufschmid); Basel, St. Claraspital (B Hornig); Bern, Beau-Site Klinik (S Trummler);Bern, Inselspital (S Windecker); Bern, Tiefenauspital (P Loretan); Biel, Spitalzentrum (C Roethlisberger); Bülach, Spital (G Mang); Burgdorf, Regionalspital Emmental (D Ryser); Davos, Spital (W Kistler); Dornach, Spital (T Hongler); Einsiedeln, Regionalspital (S Stäuble); Flawil, Spital (G Freiwald); Frauenfeld, Kantonsspital (HP Schmid); Fribourg, Hôpital cantonal (JC Stauffer/S Cook); Frutigen, Spital (K Bietenhard); Genève, Hôpitaux universitaires (M Roffi); Grenchen, Spital (R Schönenberger); Herisau, Kantonales Spital (M Schmidli); Horgen, See Spital (B Federspiel); Interlaken, Spital (EM Weiss); Kreuzlingen, Herzzentrum Bodensee (K Weber); Lachen, Regionalspital (I Poepping); Langnau im Emmental, Regionalspital (A Hugi); Laufenburg, Gesundheitszentrum Fricktal (E Koltai); Lugano, Cardiocentro Ticino (G Pedrazzini); Luzern, Kantonsspital (P Erne); Männedorf, Kreisspital (T Heimes); Mendrisio, Ospedale regionale (A Pagnamenta); Meyrin, Hôpital de la Tour (P Urban); Moutier, Hôpital du Jura bernois (C Stettler); Münsingen, Spital (F Repond); Münsterlingen, Kantonsspital (F Widmer); Muri, Kreisspital für das Freiamt (C Heimgartner); Nyon, Group. Hosp. Ouest lémanique (R Polikar); Olten, Kantonsspital (S Bassetti); Rheinfelden, Gesundheitszentrum Fricktal (HU Iselin); Rorschach, Spital (M Giger); Sarnen, Kantonsspital Obwalden (T Kaeslin); Schaffhausen, Kantonsspital (A Fischer); Schlieren, Spital Limmattal (T Herren), Scuol Ospidal d’Engiadina Bassa (C Neumeier/G Flury); Solothurn, Bürgerspital (R Vogel); Stans, Kantonsspital Nidwalden (B Niggli); St. Gallen, Kantonsspital (H Rickli); Sursee, Luzerner Kantonsspital (J Nossen); Thun, Spital (U Stoller); Uster, Spital (E Bächli); Wetzikon, GZO Spital (U Eriksson); Winterthur, Kantonsspital (T Fischer), Wolhusen, Luzerner Kantonsspital (M Peter); Zofingen, Spital (S Gasser); Zollikerberg, Spital (R Fatio); Zürich, Hirslanden Klinik im Park (O Bertel); Zürich, Universitätsspital (M Maggiorini); Zürich, Stadtspital Triemli (F Eberli); Zürich, Stadtspital Waid (S Christen).