Admissions of patients with alcohol intoxication in the Emergency Department: a growing phenomenon
DOI: https://doi.org/10.4414/smw.2014.13982
Nicolas
Bertholet, Angéline
Adam, Mohamed
Faouzi, Olivier
Boulat, Bertrand
Yersin, Jean-Bernard
Daeppen, David
Clerc
Summary
QUESTION UNDER STUDY: To investigate the change over time in the number of ED admissions with positive blood alcohol concentration (BAC) and to evaluate predictors of BAC level.
METHODS: We conducted a single site retrospective study at the ED of a tertiary referral hospital (western part of Switzerland) and obtained all the BAC performed from 2002 to 2011. We determined the proportion of ED admissions with positive BAC (number of positive BAC/number of admissions). Regression models assessed trends in the proportion of admissions with positive BAC and the predictors of BAC level among patients with positive BAC.
RESULTS: A total of 319,489 admissions were recorded and 20,021 BAC tests were performed, of which 14,359 were positive, divided 34.5% female and 65.5% male. The mean (SD) age was 41.7(16.8), and the mean BAC was 2.12(1.04) permille (g of ethanol/liter of blood). An increase in the number of positive BAC was observed, from 756 in 2002 to 1,819 in 2011. The total number of admissions also increased but less: 1.2 versus 2.4 times more admissions with positive BAC. Being male was independently associated with a higher (+0.19 permille) BAC, as was each passing year (+0.03). A significant quadratic association with age indicated a maximum BAC at age 53.
CONCLUSION: We observed an increase in the percentage of admissions with positive BAC that was not limited to younger individuals. Given the potential consequences of alcohol intoxication, and the large burden imposed on ED teams, communities should be encouraged to take measures aimed at reducing alcohol intoxication.
Introduction
Unhealthy alcohol use is consumption that is associated with negative health consequences, including abuse and dependence. It is a major public health concern and accounts for a significant portion of the disease burden in Switzerland and worldwide [1–4]. Binge drinking and acute alcohol intoxication are associated with an increased risk of injuries, trauma, violence and other negative health outcomes, especially among young individuals [2, 5–7].
The burden of unhealthy alcohol use on hospitals is noteworthy. In an inner-city general hospital in the UK, 6.2% of all admissions and 12% of accident and emergency admissions were due to alcohol-related problems. The proportion of accident and emergency visits due to alcohol-related problems reached 50% for individuals aged 18– 39 [8]. Specifically, hospitalisations due to acute alcohol intoxications represent a burden for emergency department (ED) workers and account for a significant part of the resources in emergency departments [9, 10]. One study conducted in Bern, Switzerland showed an increase in hospital admissions for alcohol intoxication from 1.4% of all admissions in 2000 to 3.3% in 2007 [11]. In French-speaking Lausanne, the local media have reported a large increase in social problems and hospital admissions related to alcohol intoxication that corresponds to the clinical observations reported by ED staff.
The challenges addressed by alcohol intoxication-related admissions to the ED system are complex, and characterising the phenomenon is important to developing adequate interventions and responses. A better understanding of the change over time of ED admissions related to alcohol intoxication, its sex and age distribution, and the characterisation of potential changes in the level of observed intoxications will yield information on what measures could be implemented. The media strongly focuses on young individuals (especially young males), but even if alcohol use has a strong disease burden on young men [1], it remains to be determined whether or not the alcohol-related ED admissions are mainly observed in young men or are more generally spread across age and sex.
Therefore we investigated the change in the number of admissions of patients with positive blood alcohol concentrations (BAC) to a large ED (including a level I trauma centre). We also evaluated the predictors of BAC level among patients with positive BAC.
Methods
The research is a single site retrospective study conducted at a tertiary referral university hospital. It was done at the Lausanne University Hospital that serves the Canton Vaud (population 720,000) in the western part of Switzerland. Over the 2002–2011 period, results for every BAC performed at the ED were collected retrospectively from the ED lab registry, except for court-ordered BAC that is unobtainable for legal reasons. The total number of patients admitted to the ED each year over the 10year period was identified from ED lab data and admission records.
All admissions of patients aged 16 and over were included, regardless of type of admission or duration of stay. At the Lausanne facility, the ED physicians order all BAC based on clinical evaluation. There is no systematic screening procedure to identify individuals with unhealthy alcohol use, and the protocol for obtaining BAC did not change during the study period. All tests were analysed in the central lab of the Lausanne University Hospital. BAC were classified as negative (<2.2 mmol ethanol/l) or positive (≥2.2 mmol ethanol/l), according to the analytical detection method. Positive BAC were later transformed from [mmol of ethanol/l] to permille [g of ethanol/l, where 1 permille = 1 g of ethanol/liter of blood]. This method is often used in scientific publications and in news reports. It is also a useful way of interpreting BAC in clinical, legal and general populations.
This research is part of a larger study on alcohol intoxication conducted at the Lausanne University Hospital. It has been approved by the Ethics Committee for Clinical Research of the Lausanne University Medical School (protocol 265/2013).
Analyses
We recorded the total number of ED admissions over the entire study period and determined the number of admissions with positive BAC for each year of observation between 2002 and 2011. Among positive BAC, we determined the sexual composition and the mean positive BAC in the full sample and by sex from 2002 to 2011. We also determined the absolute number of positive BAC by permille level (≤1, >1 to ≤2, >2 to ≤3, >3 to ≤4, >4). Patients could be admitted multiple times to the ED, so in order to assess the proportion of those admitted only once, we computed (for each year) the proportion of “single” admissions.
Outcomes
We considered three main outcomes: 1) proportion of ED admissions with positive BAC (positive BAC/total admissions), 2) proportion of admissions with BAC >2 permille (BAC>2 permille/all admissions with positive BAC), and 3) BAC level as a continuous measure.
Proportion of admissions with positive BAC
In order to investigate the association of time with the proportion of positive BAC admissions, Spearman rank correlations were computed between the numbers of admissions with positive BAC and the total number of admissions and time (year of observation between 2002 and 2011). To investigate the association further and to quantify changes over time, we used a robust regression procedure. This model indicates the percent change in the proportion of admissions with positive BAC over time.
Proportion of admissions with BAC>2 permille
In order to assess possible changes in the severity and clinical significance of those with positive BAC, changes over time in the proportion of admissions with BAC>2 permille among patients was investigated. We considered admissions with BAC of 2 permille or greater to be clinically significant alcohol intoxications. A robust regression model was used to indicate the percent change over time in the proportion of number of patients with BAC>2 permille relative to the total number of positive BAC.
Continuous BAC level
Age, gender, and year of observation were entered in a robust regression model to assess their association with BAC level as a continuous variable among patients with positive BAC. These predictors were chosen a priori based on the published literature and clinical experience. Because of data collection limitations, there are no detailed subject characteristics other than age, sex and date of admission. BAC level as a continuous variable could be analysed using a simple regression model. However, the distribution of BAC level deviated slightly from a normal distribution so we preferred a linear robust regression model to simple regression in order to obtain more robust parameter estimations.
First, all predictor variables were tested separately, then all predictors were entered in a multivariate model.
All analyses were performed with STATA 11 (StataCorp. 2009. Stata Statistical Software: Release 11. College Station, TX: StataCorp LP) with statistical significance set at alpha = 0.05 on all tests.
Results
There were 319,489 ED admissions recorded over the study period; 20,021 BAC tests were performed and of these, 14,359 (72%) were positive. Table 1 presents the number of ED admissions, number of patients admitted (one patient could be admitted more than once), number of admissions with positive BAC, percentage of admissions with positive BAC, and mean positive BAC in the full sample and by sex from 2002 to 2011. A large increase in the absolute number of positive BAC occurred over the study period (from 756 in 2002 to 1,819 in 2011). An overall increase in admissions at the unit also occurred (from 29,408 in 2002 to 35,899 in 2011). The increase in absolute BAC numbers was more pronounced (2.4 times more in 2011 than in 2002) than it was for the total number of admissions (1.2 times more). From 2002 to 2011, the percentage of admissions with positive BAC (positive BAC/total admissions) was 4.5.
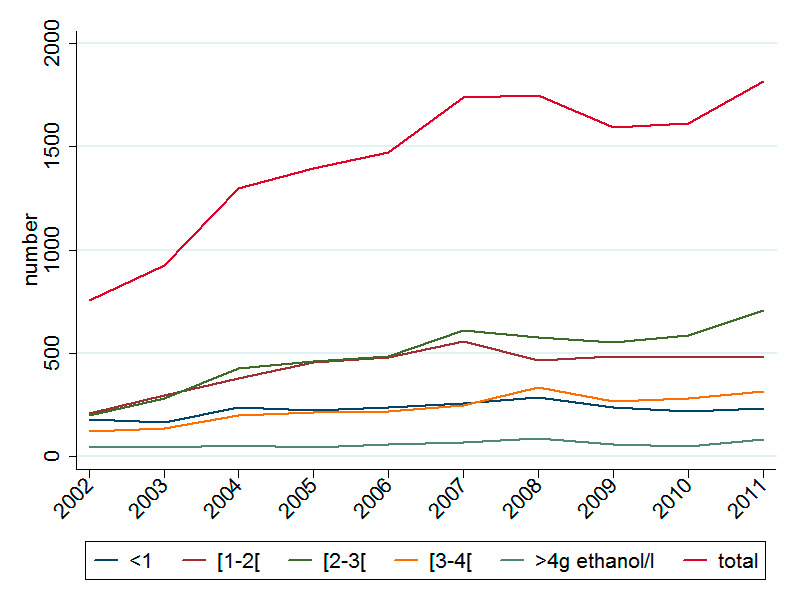
Figure 1
Total number of positive BAC ≤1, >1 to ≤2, >2 to ≤3, >3 to ≤4, >4 permille (g of ethanol per liter) over time.
BAC: blood alcohol concentration
A significant increase in the percentage of admissions with a positive BAC was observed over time (robust regression, coefficient (SE) for each year of observation = 0.0022 (0.0009), p = 0.04) corresponding to a 0.22% increase in the percentage of admissions with positive BAC each year.
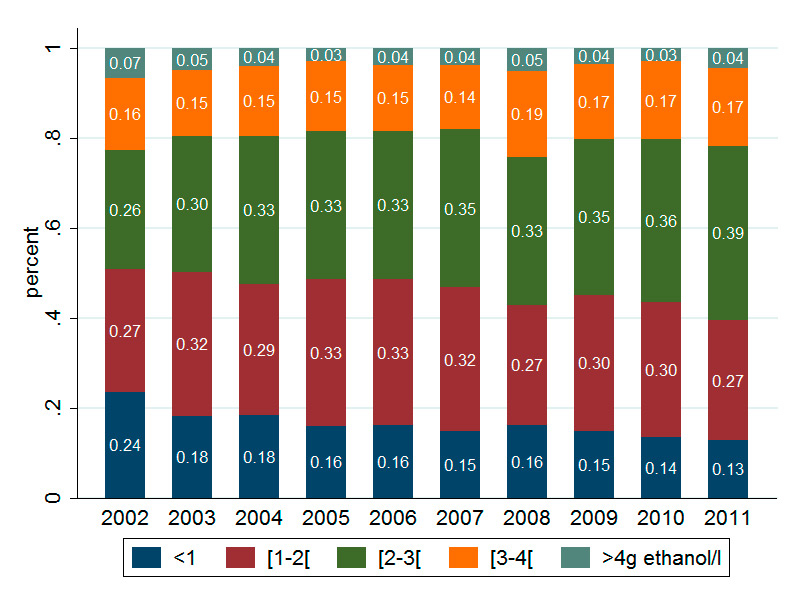
Figure 2
Partition of positive BAC across 5 BAC levels: ≤1, >1 to ≤2, >2 to ≤3, >3 to ≤4, >4 permille (g of ethanol per liter of blood).
BAC: blood alcohol concentration
Note: The percentage of subjects in each category is indicated in the bars
There were 4,951 females (34.5%) and 9,408 males (65.5%) with positive BAC and the mean (SD) age was 41.7 (16.8). Over the ten-year period, the mean (SD) positive BAC was 2.12 (1.04) permille in the full sample, 2.18 (1.04) permille among males, and 2.01 (1.00) permille among females. The absolute number of positive BAC for five levels (≤1, >1 to ≤2, >2 to ≤3, >3 to ≤4, >4 permille) over time are presented in figure 1. The partition of positive BAC from 2002 to 2011 across five BAC levels is shown in figure 2.
The proportion of “single” admissions (percentage of admissions by patients admitted only once) per year was 79.6%. The same proportion (79.1%) was seen when positive BAC admissions only were taken into account. Therefore, approximately 20% of admissions are due to patients that are readmitted to the ED, whether or not they have positive BAC.
Outcomes
Proportion of admissions with positive BAC
A Spearman rank correlation calculation showed a positive relationship between the proportion of admissions with positive BAC (positive BAC/total admissions) and time (rho = 0.60, p = 0.0667). A significant increase in the percentage of admissions with positive BAC was demonstrated over time with a robust regression (coefficient (SE) for each year of observation = 0.0022 (0.0009), p = 0.04), corresponding to a 0.22% increase in the percentage of admissions with positive BAC each year.
Proportion of admissions with BAC>2 permille
The proportion of admissions with BAC >2 permille among positive admissions increased over time (from 49% in 2002 to 61% in 2011). In the robust regression model, there was a significant increase in the proportion of admissions with BAC >2 permille of 1.1% (coefficient (SE) per year of observation = 0.011 (0.002), (p = 0.001), corresponding to a 1.1% increase in BAC>2 permille each year.
Continuous BAC level
The BAC level among positive patients was analysed as a continuous outcome. The following predictors were assessed: age, sex, and year of observation. The functional relationship between BAC level and age was clearly quadratic, thus an (age)2 variable was added in the regression models. In univariate models, all variables were associated with BAC level. In the multivariate model, all predictors remained significant at alpha level 0.05. Being male was independently associated with a higher BAC (+0.19 permille), as was each year of observation. Each passing year from 2002 to 2011 was associated with an increase of 0.03 permille in mean BAC. For age, the BAC level increased to the maximum at 53 years, and then decreased.
Results of the univariate and multivariable models are presented in table 2.
|
Table 1:Number of ED admissions with positive BAC over time. |
| |
2002
|
2003
|
2004
|
2005
|
2006
|
2007
|
2008
|
2009
|
2010
|
2011
|
|
Full sample:
|
|
|
|
|
|
|
|
|
|
|
| Number of ED admissions |
29,408 |
30,242 |
29,495 |
29,224 |
31,027 |
30,979 |
33,097 |
35,019 |
35,099 |
35,899 |
| Number of patients* |
23,075 |
23,882 |
23,670 |
23,582 |
24,854 |
24,960 |
26,280 |
27,801 |
27,793 |
28,284 |
| Total number of BAC tests performed |
1,174 |
1,490 |
1,871 |
1,944 |
2,022 |
2,360 |
2,390 |
2,219 |
2,173 |
2,378 |
| Number of BAC+/total number of BAC tests performed |
64% |
62% |
69% |
72% |
73% |
74% |
73% |
72% |
74% |
76% |
| Number of ED admissions with BAC+ |
756 |
923 |
1,299 |
1,394 |
1,474 |
1,737 |
1,749 |
1,595 |
1,613 |
1,819 |
| Number of patients with BAC+* |
655 |
781 |
1,031 |
1,092 |
1,119 |
1,330 |
1,294 |
1,290 |
1,274 |
1,374 |
| Percentage of admissions with BAC+ |
2.6% |
3.1% |
4.4% |
4.8% |
4.8% |
5.6% |
5.3% |
4.6% |
4.6% |
5.1% |
| Mean (SD) positive BAC (in permille) |
2.03 (1.18) |
2.06 (1.09) |
2.09 (1.05) |
2.06 (1.01) |
2.07 (1.02) |
2.10 (1.01) |
2.20 (1.09) |
2.13 (1.02) |
2.15 (0.99) |
2.24 (1.02) |
|
By sex:
|
|
|
|
|
|
|
|
|
|
|
|
Males
|
|
|
|
|
|
|
|
|
|
|
| Number of ED admissions |
15,461 |
16,148 |
15,802 |
15,557 |
16,569 |
16,463 |
17,670 |
18,631 |
18,841 |
19,594 |
| Number of ED admissions with BAC+ |
489 |
587 |
845 |
903 |
918 |
1,120 |
1,177 |
1,047 |
1,076 |
1,246 |
| Percentage of admissions with BAC+ |
3.2% |
3.6% |
5.3% |
5.8% |
5.5% |
6.8% |
6.7% |
5.6% |
5.7% |
6.4% |
| Mean (SD) positive BAC (in permille) |
2.05 (1.20) |
2.04 (1.09) |
2.08 (1.03) |
2.12 (1.02) |
2.12 (1.05) |
2.22 (1.05) |
2.28 (1.10) |
2.20 (1.05) |
2.18 (0.99) |
2.33 (1.03) |
|
Females
|
|
|
|
|
|
|
|
|
|
|
| Number of ED admissions |
13,947 |
14,094 |
13,693 |
13,667 |
14,458 |
14,516 |
15,427 |
16,388 |
16,258 |
16,305 |
| Number of ED admissions with BAC+ |
267 |
336 |
454 |
491 |
556 |
617 |
572 |
548 |
537 |
573 |
| Percentage of admissions with BAC+ |
1.9% |
2.4% |
3.3% |
3.6% |
3.8% |
4.3% |
3.7% |
3.3% |
3.3% |
3.5% |
| Mean (SD) positive BAC (in permille) |
1.99 (1.15) |
2.08 (1.09) |
2.09 (1.09) |
1.94 (0.99) |
1.98 (0.96) |
1.89 (0.89) |
2.03 (1.06) |
2.00 (0.96) |
2.07 (0.97) |
2.06 (0.97) |
| BAC: blood alcohol concentration
ED: Emergency Department
*: patients could be admitted more than once per year (including with an alcohol intoxication), so number of admissions and number of patients are provided |
|
Table 2:Predictors of BAC level. |
| |
coefficient
|
SE
|
P
|
|
Univariate models
|
|
|
|
|
Model 1: age
|
|
|
|
| Age |
0.059 |
0.003 |
<.0001 |
| (age)2
|
–0.0006 |
0.00003 |
<.0001 |
|
Model 2: sex
|
|
|
|
| Sex (male) |
0.190 |
0.019 |
<.0001 |
|
Model 3: year of observation
|
|
|
|
| Year of observation |
0.024 |
0.003 |
<.0001 |
|
Multivariable model:
|
|
|
|
| Age |
0.060 |
0.003 |
<.0001 |
| (age)2
|
–0.0006 |
0.00003 |
<.0001 |
| Sex (male) |
0.189 |
0.019 |
<.0001 |
| Year of observation |
0.026 |
0.003 |
<.0001 |
| BAC: blood alcohol concentration
Note: Among BAC positive patients, the following predictors were assessed: age, sex, and year of observation. Because of a quadratic association between age and BAC level, an (age)2 variable was added along with the age variable in regression models. |
Discussion
Alcohol intoxication is associated with an increased risk of intentional and unintentional injuries and violence, and is therefore an important public health problem [12]. There was a significant increase in the percentage of admissions with positive BAC among patients 16 years and older admitted to a tertiary university referral center in western Switzerland between 2002 and 2011. This is consistent with prior reports elsewhere in Switzerland [11]. The proportions of positive BAC herein are higher than in other studies [9, 11] and may reflect that we did not limit our analysis to patients admitted for alcohol intoxication, but included all cases with positive BAC. Every BAC result was analysed, whether or not the patient was admitted for alcohol intoxication or for some other problem. Therefore, it should not lead to the conclusion that all the patients with a positive BAC had an alcohol-related ED admission, because it is not known if a patient would or would not have been hospitalised in the absence of being intoxicated.
Since 2005, in Lausanne approximately 5% of all admissions have presented with positive BAC over 2 permille. This represents a large burden on the ED clinical teams and significant costs to society. Even though per capita alcohol use in Switzerland has decreased over the past ten years, a change has been observed in alcohol consumption patterns; there are more frequent cases of intoxication, especially among young individuals [13]. Changes in population drinking patterns may explain the observed increase in the percentage of admissions with positive BAC, but it is important to remember that the observed increase was not solely among younger persons. The mean age of individuals admitted with positive BAC was over 40 years, with the maximal BAC observed at age 53. In terms of sex, there were a higher proportion of admissions with positive BAC among males, and the BAC level was higher among them. This has been documented in other studies as well [11, 14].
Several studies have shown that admissions with positive BAC are observed mostly among middle-aged men [9, 11, 15]. Therefore, the increase in admissions with positive BAC cannot be attributed primarily to young individuals. Environmental changes in access to alcohol, greater tolerance to intoxication, and limited constraints are likely to influence drinking practices and possibly encourage alcohol intoxication. This trend is likely to apply to the entire population [16].
The clinical significance of alcohol intoxication is prone to vary by age, and calls for different types of interventions after immediate and urgent care have been delivered. Given the natural history of alcohol use disorders, the likelihood of an alcohol use disorder is less among younger individuals than it is among older individuals. If it is present, it is probably milder in severity [17]. Among middle-aged individuals, severe alcohol intoxications (>= 3 permille) represent more of a marker of alcohol dependence than does an isolated episode of intoxication [18]. In terms of interventions dedicated to secondary prevention, younger individuals without severe alcohol use disorders are more likely to benefit [19]. Therefore, alcohol intoxication outside of the context of alcohol dependence will call for secondary prevention measures, whereas intoxication among people with alcohol dependence will call for a more specialised type of care.
There is evidence of efficacy of secondary preventive intervention for unhealthy alcohol use, but it remains limited and applies mainly to persons identified through systematic screening. A recent study showed reductions in drinking 12 months after an intervention conducted by emergency practitioners (attending physicians and residents, physician associates and advanced practice registered nurses) at an ED among adults with hazardous and harmful drinking. This suggests that interventions delivered by ED personnel can lead to significant reductions in alcohol use among their patients [20]. Nevertheless, efficacy of brief interventions should not be generalised to populations that were not screened, and, hence, not to the population we studied in the current research. There is a lack of knowledge about effective interventions for individuals admitted to the ED for alcohol intoxication, especially among those suffering from alcohol use disorders. Additional measures or different strategies may thus be necessary for individuals hospitalised for intoxication. Liaison consults and interventions delivered by addiction specialists are among the potentially appropriate techniques [21].
The present study has several limitations. As previously mentioned, all BAC results were included and admissions with positive BAC are not necessarily related to an alcohol problem. The presence of alcohol intoxication may be identified as the result of a clinical evaluation of another health problem. There is no standardised procedure at the Lausanne ED for ordering a BAC test; it is a clinical decision that is likely to be influenced by patient context and clinician experience. Additional limitations pertain to the study design. This research was conducted at a single centre, limiting the generalisability of the results beyond western Switzerland. Additionally, the retrospective design coupled with the absence of standardised clinical procedures at admission for detecting potential alcohol intoxications makes it impossible to exclude selection bias. Clinicians may have chosen to order or to bypass BAC based on characteristics of certain patients, such as male or female, and young or old. These decisions may have influenced the results.
The number of patients who refused to be tested is unknown, though BAC itself does not require consent separately from other blood tests at the Lausanne ED. In addition, we did not have access to triage or admission information within this project, so we could not determine whether patients did or did not present symptoms related to alcohol use. Moreover, court-ordered BAC could not be obtained for any of the analyses.
The present study, even though it provides good information from the Lausanne ED, excludes an unknown number of patients with potentially positive BAC. Due to a retrospective design and restrictions on data collection, we do not have detailed information regarding subject characteristics beyond age, sex and date of admission. This places limits on our ability to predict BAC level.
Nevertheless, we believe this research provides an important look at the change over time in admissions with positive BAC. We did see a rather large increase over time in the percentage of admissions with positive BAC, including a preponderance of male patients. This increase was not limited to younger individuals but was observed across all age categories. Given the potential harmful consequences of alcohol intoxication, the personal and societal costs of this problem and the huge burden it places on ED teams, communities should be encouraged to take measures aiming at reducing it. Strategies could include increasing alcohol taxes, limiting availability and creating more effective preventive measures [22, 23]. At the hospital level, the management of patients admitted with alcohol intoxication may require specific secondary prevention interventions or specialised interventions for individuals with alcohol use disorders [20, 21, 24]. These interventions should take into account the high proportion of admissions with positive BAC among middle-aged men and the sharp increase seen in overall admissions that may be a reflection of changes in Swiss drinking patterns.
In conclusion, admissions with alcohol intoxication are common and increasing in number. This development is problematic for ED units. Implementing appropriate responses at the hospital level that can maintain good quality of care and ease the burden on ED teams presents a challenge that calls for further research.
References
1 Rehm J, et al. Alcohol consumption and alcohol-attributable burden of disease in Switzerland, 2002. Int J Public Health. 2007;52(6):383–92.
2 Rehm J. The risks associated with alcohol use and alcoholism. Alcohol Res Health. 2011;34(2):135–43.
3 Shield KD, et al. Alcohol-attributable burden of disease and injury in Canada, 2004. Int J Public Health. 2012;57(2):391–401.
4 Whiteford HA, et al. Global burden of disease attributable to mental and substance use disorders: findings from the Global Burden of Disease Study 2010. Lancet. 2013;382(9904):1575–86.
5 McGinnis JM, Foege WH. Mortality and morbidity attributable to use of addictive substances in the United States. Proc Assoc Am Physicians. 1999;111(2):109–18.
6 Shield KD, et al. Global burden of injuries attributable to alcohol consumption in 2004: a novel way of calculating the burden of injuries attributable to alcohol consumption. Popul Health Metr. 2012;10(1):9.
7 Kuntsche E, Gmel G. Alcohol consumption in late adolescence and early adulthood – where is the problem? Swiss Med Wkly. 2013;143:w13826.
8 Pirmohamed M, et al. The burden of alcohol misuse on an inner-city general hospital. Qjm. 2000;93(5):291–5.
9 Verelst S, et al. Emergency department visits due to alcohol intoxication: characteristics of patients and impact on the emergency room. Alcohol Alcohol. 2012;47(4):433–8.
10 Imlach Gunasekara F, et al. How do intoxicated patients impact staff in the emergency department? An exploratory study. N Z Med J. 2011;124(1336):14–23.
11 Haberkern M, Exadaktylos AK, Marty H. Alcohol intoxication at a university hospital acute medicine unit – with special consideration of young adults: an 8-year observational study from Switzerland. Emerg Med J. 2010;27(3):199–202.
12 Gmel G, et al. Injury and repeated injury – what is the link with acute consumption, binge drinking and chronic heavy alcohol use? Swiss Med Wkly. 2007;137(45–46):642–8.
13 Gmel G, et al. Who drinks most of the total alcohol in young men – risky single occasion drinking as normative behaviour. Alcohol Alcohol. 2008;43(6):692–7.
14 O’Farrell A, et al. The burden of alcohol misuse on emergency in-patient hospital admissions among residents from a health board region in Ireland. Addiction. 2004;99(10):1279–85.
15 Pletcher MJ, Maselli J, Gonzales R. Uncomplicated alcohol intoxication in the emergency department: an analysis of the National Hospital Ambulatory Medical Care Survey. Am J Med. 2004;117(11):863–7.
16 Murphy JG, Correia CJ, Barnett NP. Behavioral economic approaches to reduce college student drinking. Addict Behav. 2007;32(11):2573–85.
17 Schuckit MA, et al. The time course of development of alcohol-related problems in men and women. J Stud Alcohol. 1995;56(2):218–25.
18 Neves P, Neuffer N, Yersin B. Massive alcoholic poisoning in the emergency department: how many, who, what and how? Rev Med Suisse. 2011;7(302):1445–9.
19 Sommers MS, et al. Emergency Department-Based Brief Intervention to Reduce Risky Driving and Hazardous/Harmful Drinking in Young Adults: A Randomized Controlled Trial. Alcohol Clin Exp Res. 2013;37(10):1753–62.
20 D’Onofrio G, et al. A brief intervention reduces hazardous and harmful drinking in emergency department patients. Ann Emerg Med. 2012;60(2):181–92.
21 Schwan R, et al. Usefulness of brief intervention for patients admitted to emergency services for acute alcohol intoxication. Eur J Emerg Med. 2012;19(6):384–8.
22 Rice P, Drummond C. The price of a drink: the potential of alcohol minimum unit pricing as a public health measure in the UK. Br J Psychiatry. 2012;201(3):169–71.
23 Lhachimi SK, et al. Health impacts of increasing alcohol prices in the European Union: a dynamic projection. Prev Med. 2012;55(3):237–43.
24 Academic, E.D.S.R.C., The impact of screening, brief intervention and referral for treatment in emergency department patients’ alcohol use: a 3–, 6– and 12–month follow-up. Alcohol Alcohol. 2010;45(6):514–9.