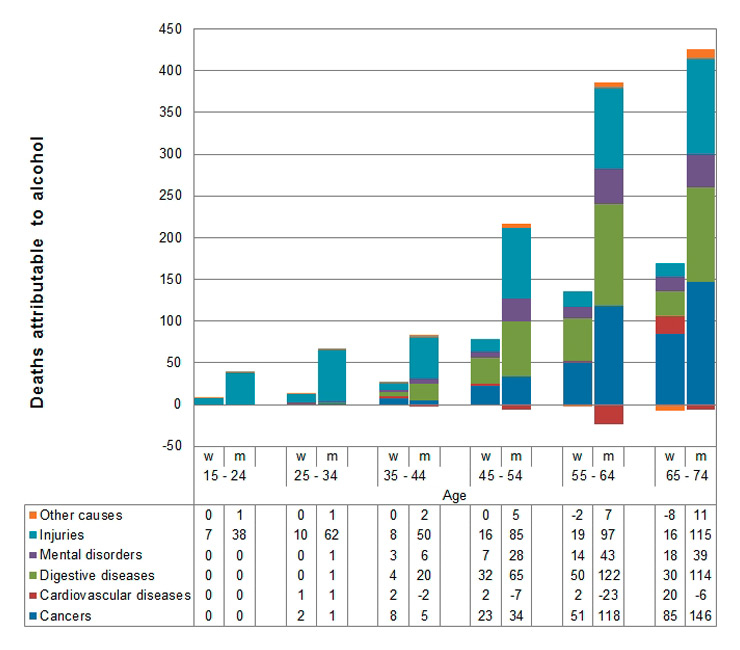
Figure 1
Alcohol-attributable deaths by age and sex and broad categories. For definition of categories see supplementary table A1.
DOI: https://doi.org/10.4414/smw.2014.13947
List of abbreviations:
AAF Alcohol-attributable fraction
AMIS Addiction Monitoring in Switzerland
CRA Comparative Risk Assessment
GBD Global Burden of Disease
HIV Human Immunodeficiency Virus
ICD International Classification of Diseases
IHD Ischaemic Heart Disease
RR Relative Risk
RSOD Risky single occasion drinking
YLL Years of life lost
Alcohol consumption is a major risk factor of avoidable burden of disease and injury. The Comparative Risk Assessment (CRA) within the Global Burden of Disease (GBD) Study 2010 [1] estimated it to be the fifth largest cause of burden of disease worldwide and the sixth largest cause in Western Europe [2]. Compared with earlier CRA estimates, methods for estimating alcohol-attributable mortality have been largely refined [2, 3]. The present study estimates alcohol-attributable mortality in Switzerland in detail with the newest available data in Switzerland for 2011, using the CRA methodology.
Alcohol consumption has a long tradition in Switzerland and is common in many parts of life, resulting in a substantial alcohol consumption of 10.5 litres (recorded [4] and unrecorded [5, 6] of pure alcohol per adult (15+ years), almost twice of that worldwide (6.1 litres [7]), causing marked premature mortality each year. While there are about 30 ICD-10 [8] codes which are 100% alcohol-attributable (e.g. alcoholic liver disease or alcohol dependence syndrome), there are additionally about 200 causes that are partially attributable to alcohol use and for which alcohol-attributable fractions (AAF) can be estimated [9, 10] to quantify the proportion of disease and mortality caused by alcohol. The fraction attributable to alcohol does not only depend on the specific cause of death, but also on the alcohol consumption patterns (average volume and risky single occasion drinking (RSOD), defined as occasions with five or more standard drinks for men, respectively four or more for women) which vary across age and sex groups. Accordingly, alcohol-attributable mortality as well as the composition of different causes to the overall mortality vary between regions, e.g. one would expect a greater share of overall mortality due to acute causes such as injuries in regions with predominantly RSOD on weekends compared with countries where regular alcohol use is more integrated into everyday life, resulting in a higher share of chronic diseases.
For the average drinking amount per day, the risk curves for most chronic causes of death are exponential, so heavy drinking should cause a disproportionately high fraction of alcohol-attributable disease. One of the aims of this publication is to quantify the proportion of mortality caused by heavy drinking in Switzerland. This is important for theoretical reasons, as it will inform the discussion on the so-called Preventive Paradox [11, 12], which states that most of the harm due to alcohol is in drinkers who drink on average light to moderately. It is also important with respect to prevention, as it is relevant for choosing the most effective prevention strategy.
The World Health Organization stresses the importance of monitoring alcohol consumption and resulting harms and benefits at the country level in order to inform alcohol policies that serve individual country needs [13]. In Switzerland, there is a good availability of data to estimate alcohol consumption, and the corresponding causes contributing to the overall mortality, and can thus serve as an example for established market economies in Europe.
There are earlier estimates of alcohol-attributable mortality for Switzerland [5, 14, 15] but those estimates have become outdated, the last one using data from the year 2004. As noted above, the methods have received considerable updates; newer relative risk estimates from meta-analyses have been integrated [9], and mortality caused by some diseases, for example tuberculosis, have been shown to be causally attributable to alcohol and are now included in estimates of alcohol-attributable harm [16]. The Relative Risk (RR) functions are now handled continuously and the inclusion of binge drinking has been refined. Additionally, it is today also possible to integrate RR for former drinkers, as more data have become available. This is important because former drinkers are known to have risks that differ from those of drinkers and lifetime abstainers [e.g. 17].
The list of alcohol-attributable diseases and injuries (see supplementary Web-Appendix table A1) was adapted [9] from the Comparative Risk Assessment (CRA) for alcohol which is part of the Global Burden of Disease and Injury (GBD) 2010 study [1]. However, as Switzerland has a detailed death registry, some of the smaller causes of death categories 100% attributable to alcohol (e.g. alcoholic cardiomyopathy or alcoholic liver disease) could be used. While the results were calculated for all categories presented in Web Appendix table A1, for the sake of presentation some more refined causes were subsumed under broad categories of injuries, cancers, cardiovascular diseases, digestive diseases, mental disorders, and others (for category assignment see also supplementary Web-Appendix table A1). Although there are some causes which are 100% alcohol-attributable, and for which number of deaths and years of life lost (YLL) can be directly estimated from the mortality registry, most of the diseases and injuries are partially alcohol-attributable. For these diseases the Alcohol-Attributable-Fraction (AAF) methodology [18–20] was used.
The AAF represents the proportion of deaths that would not have occurred if a counterfactual scenario was true. The counterfactual scenario used in the present study and GBD was lifetime abstention from alcohol. AAFs were calculated for every condition partially attributable to alcohol use, separately for both sexes and seven age categories.
Formula 1: Alcohol-attributable fraction
As can be seen in formula 1, the AAF methodology needs four determinants: the prevalence of abstainers (Pabs), former (Pformer) and current (Pcurrent) (past 12 months) drinkers, and the relative risk functions at different levels of alcohol consumption volume (RRcurrent(x)). Basically, the formula weights the prevalence of drinking at different levels with the relative risk at the corresponding drinking level, compared with the counterfactual scenario. Negative AAF (e.g. for ischaemic heart disease (IHD)) can be interpreted as avoided deaths due to alcohol use. Uncertainty of the AAF was calculated using a method described by Gmel and colleagues [21], based on a Monte-Carlo simulation (see [22] for an introduction).
For three disease/injuries categories the AAF methodology had to be adapted. Firstly, for IHD, RSOD frequency was additionally considered, because the protective effect for IHD disappears for individuals with RSOD at least monthly [23, 24]. Therefore, RR for IHD were set to 1 for individuals with at least monthly RSOD (defined in the present study as 5+ and 4+ standard drinks on one occasion). Secondly, AAFs for mortality from human immunodeficiency virus (HIV) attributable to non-adherence to highly active anti-retroviral treatment were calculated using the method outlined by Gmel and colleagues [25]. This calculation does not use formula 1, but it is based on the proportion of HIV-patients in treatment and estimates the number of non-adherence to highly active anti-retroviral treatment and consequences due to alcohol consumption. Thirdly, the AAFs for injuries (separately for motor vehicle accidents and non-motor vehicle accidents) were calculated using the method outlined by Shield and colleagues [26], which takes different drinking patterns into account (average consumption and RSOD) that have also been shown to differentially impact injury risk in Switzerland [27].
Although we mostly followed the methodology of the comparative risk assessment in the GBD 2010 study, there were three significant differences. Firstly, the aim of GBD is to compare results across countries and different risk factors. Therefore, the GBD uses the same standard life expectancy table [1] for every country and for both sexes. While this may be a preferred approach for comparative studies, country-specific life tables offer a more direct approach for estimating YLL due to alcohol in a specific country and were used here. Secondly, the GBD method for liver disease used the total number of liver disease cases (alcoholic and non-alcoholic) and applied an AAF, because globally no data are available for small categories such as alcoholic liver cirrhosis [28, 29]. In the present study this approach would have underestimated alcohol-attributable liver disease compared with the use of 100% alcohol-attributable diagnostic codes of alcoholic liver diseases. Finally, we were able to include deaths from other 100% alcohol-attributable causes such as alcoholic cardiomyopathy, for which no data exist on the global level.
Alcohol consumption data, i.e. abstinence, former drinker and drinking prevalence rates as well as mean amount of alcohol consumed and estimates for binge drinking were taken from the Addiction Monitoring in Switzerland (AMIS [30]), based on 11,000 participants in the year 2011.
To account for the underestimation of alcohol consumed as estimated by surveys [31, 32], the volume (in g /day) derived from AMIS was upshifted to 80% of the adult total per capita alcohol consumption, as estimated by the addition of recorded [4] and unrecorded alcohol consumption [5, 6]. Unrecorded alcohol consumption is defined as alcohol that was not taxed in the country where it was consumed [33]. This could be homebrew, illegally produced spirits, non-declared wine, or even non-beverage alcohol such as medicinal alcohol or cosmetics such as mouthwash or after-shaves. An estimate for Switzerland is 0.5 litres of unrecorded consumption per capita [6, 34]. The upshifting to 80% was based on the recommendations of the World Health Organization (WHO) Technical Advisory Group on Alcohol Epidemiology (see discussion on this value below).
AMIS estimates covered about a third (33.7%) of the overall adult per capita consumption including unrecorded consumption in 2011, which is at the lower end of coverage rates reported in the literature [35, 36]. Eighty percent of total per capita consumption was used because some of the alcohol sold may be lost through spilled-over, left-over in glasses, debauched during stocking, or used with cooking [37]. A lower than 100% value also takes into account that the observational epidemiological studies that provide the risk relation data may themselves underestimate alcohol consumption [31]. Basically, the method of up-estimation uses the sex-by-age proportions of total consumption from surveys and applies these proportions to the per capita consumption. The alcohol-consumption distribution was modelled as a continuous Gamma function [31, 32].
The continuous relative risk functions for diseases in part attributable to alcohol were also taken from the CRA [2, 9]. Table 1 gives an evaluation of these functions for men and women at different consumption levels.
The latest available death statistics for the year 2010 (as an estimate for 2011) with detailed ICD-10 Codes of the primary death cause and age at death from the Swiss Federal Statistical Office were used as outcome data. These data can be obtained upon request as anonymized microdata from the Swiss Federal Statistical Office [38]. Aggregated data can be found in the Statistical Yearbook [39]. Age-specific life expectancy tables to calculate YLL were extracted from the Swiss Federal Statistical Office database [40, 41]. Age-specific means that the life-expectancy varies with age. For example, at the age of 20 a women in Switzerland has a life-expectancy of 85 years (65 remaining years on average), whereas the life expectancy at 60 years is 87 (27 remaining years on average).
Number of deaths and YLL were calculated for the age range of 15–74 years. This was done because alcohol-attributable deaths for older people are subject to increased methodological problems, i.e. inaccuracy of death certificates [42]. Particularly, deaths certificates for cardiovascular deaths have a limited reliability in this age group [e.g. 43]. For example, possible false-attribution of deaths to “beneficial” diagnoses such as IHD compared with detrimental diagnoses such as hypertension would grossly influence the overall estimate of alcohol-attributable mortality, as most deaths in this age group are attributable to cardiovascular disease. Additionally, relative risks commonly decrease with age and move towards 1 [17, 44]. Therefore, using RRs for alcohol-attributable-mortality mainly stemming from estimates among younger populations would exaggerate alcohol-attributable deaths caused and avoided in older age groups.
Calculations for number of deaths and YLLs were done for the total population and separately for heavy drinkers, where heavy drinking was defined as 60 g or more of pure alcohol for men and 40 g or more for women. Outcomes were separated into beneficial effects (e.g. due to IHD), detrimental effects and net effects (detrimental-beneficial).
The R system for statistical computing version 2.11.1 [45] was used for calculating the AAF, SPSS version 20 was used for calculating deaths and YLL.
| Table 1: Values of the continuous relative risk functions at 20/40/60/80 g/day. | ||||||||
| Women | Men | |||||||
| 20g/day | 40g/day | 60g/day | 80g/day | 20g/day | 40g/day | 60g/day | 80g/day | |
| Oral cavity and pharynx cancer | 1.66 | 2.56 | 3.71 | 5.04 | 1.66 | 2.56 | 3.71 | 5.04 |
| Oesophagus cancer | 1.30 | 1.69 | 2.19 | 2.82 | 1.30 | 1.69 | 2.19 | 2.82 |
| Colon cancer | 1.04 | 1.08 | 1.12 | 1.16 | 1.04 | 1.08 | 1.12 | 1.16 |
| Rectal cancer | 1.07 | 1.15 | 1.23 | 1.32 | 1.07 | 1.15 | 1.23 | 1.32 |
| Liver cancer | 1.15 | 1.31 | 1.48 | 1.65 | 1.15 | 1.31 | 1.48 | 1.65 |
| Larynx cancer | 1.33 | 1.76 | 2.31 | 3.00 | 1.33 | 1.76 | 2.31 | 3.00 |
| Breast cancer | 1.19 | 1.42 | 1.69 | 2.02 | 1.00 | 1.00 | 1.00 | 1.00 |
| Epilepsy | 1.29 | 1.64 | 2.10 | 2.69 | 1.29 | 1.64 | 2.10 | 2.69 |
| Lower respiratory infections | 1.10 | 1.21 | 1.33 | 1.46 | 1.10 | 1.21 | 1.33 | 1.46 |
| Haemorrhagic stroke | 1.34 | 1.80 | 2.41 | 3.23 | 1.15 | 1.32 | 1.51 | 1.74 |
| Tuberculosis | 1.00 | 2.96 | 2.96 | 2.96 | 1.00 | 2.96 | 2.96 | 2.96 |
| Diabetes mellitus | 0.60 | 0.74 | 1.18 | 1.18 | 0.87 | 0.91 | 1.00 | 1.16 |
| Hypertension | 1.20 | 2.12 | 3.59 | 5.85 | 1.20 | 1.44 | 1.72 | 2.07 |
| Liver disease | 4.31 | 7.85 | 12.46 | 18.39 | 1.76 | 3.07 | 5.37 | 9.39 |
| Conduction disorders and other dysrhythmias | 1.12 | 1.26 | 1.41 | 1.58 | 1.12 | 1.26 | 1.41 | 1.58 |
| Pancreatitis | 1.06 | 1.27 | 1.72 | 2.62 | 1.06 | 1.27 | 1.72 | 2.62 |
| Ischaemic stroke 15–34 | 0.66 | 0.90 | 1.39 | 2.28 | 0.90 | 1.03 | 1.19 | 1.37 |
| Ischaemic stroke 35–64 | 0.68 | 0.91 | 1.36 | 2.16 | 0.90 | 1.03 | 1.18 | 1.34 |
| Ischaemic stroke 65+ | 0.76 | 0.93 | 1.25 | 1.75 | 0.93 | 1.02 | 1.13 | 1.24 |
| Ischaemic heart disease 15–34 | 0.87 | 1.00 | 1.00 | 1.00 | 0.80 | 0.79 | 1.002) | 1.00 |
| Ischaemic heart disease 35–64 | 0.88 | 1.00 | 1.00 | 1.00 | 0.81 | 0.81 | 1.002) | 1.00 |
| Ischaemic heart disease 65+ | 0.91 | 1.00 | 1.00 | 1.00 | 0.86 | 0.85 | 1.002) | 1.00 |
| Remarks: 1) Ischaemic heart disease and stroke RR's were calculated for 3 different age groups. 2) For ischaemic heart disease, RR is set to 1 for chronic heavy drinkers and risky single occasion drinkers (at least once monthly). For evidence on the effects of chronic heavy drinking see [23], for risky single occasion drinking see [24]. 3) RR for injuries are not shown because AAF's for Mortality are derived from the Morbidity AAF and because the calculation also accounts for binge drinking. 4) RR for HIV are not shown because the calculation does not use a dose dependent relative risk function. 5) For the source of the original RR, see [9]. | ||||||||
| Table 2: Alcohol-attributable mortality in Switzerland for 2011 by sex, for age 15–74. | |||
| Women | Men | Total | |
| Alcohol-attributable beneficial effect | –42 | –126 | –168 |
| Alcohol-attributable detrimental effect (deaths) | 461 | 1,307 | 1,768 |
| Alcohol-attributable net effect (net deaths) | 419 | 1,181 | 1,600 |
| Total deaths in alcohol-attributable categories | 2,853 | 5,251 | 8,104 |
| Average AAF for these categories | 14.7% | 22.5% | 19.7% |
| Total deaths | 6,936 | 11,550 | 18,486 |
| Proportion of deaths attributable to alcohol | 6.0% | 10.2% | 8.7% |
| Alcohol-attributable death rate per 100,000 population | 13.79 | 38.79 | 26.3 |
| Years of life lost due to alcohol | 11,747 | 30,880 | 42,627 |
| Proportion of years of life lost attributable to alcohol | 6.6% | 11.8% | 9.7% |
| Years of life lost per 100,000 | 386 | 1,015 | 701 |
Overall in 2011, 1,600 individuals (95% confidence intervals -CI: 1,472 – 1,728) died due to alcohol between 15 and 74 years, almost three times more men than women (419 women and 1,181 men). This corresponds to a rate of 13.8 women and 38.8 men per 100,000. The uncertainty introduced by the AAF results in a confidence range of 374 to 465 for women and 1,061 to 1,301 for men (for AAF estimates see supplementary Web-Appendix tables A2 and A3). These are net deaths, as shown in table 2; net deaths resulted from subtracting deaths avoided (168) from deaths caused by alcohol (1,768). Totally, 42,627 years of life (95% CI: 40,245 – 45,008) were lost due to alcohol. Overall, based on net estimates, 8.7% of all deaths and 9.7% of all YLL in the age group of 15 to 74 years were due to alcohol consumption.
Figure 1
Alcohol-attributable deaths by age and sex and broad categories. For definition of categories see supplementary table A1.
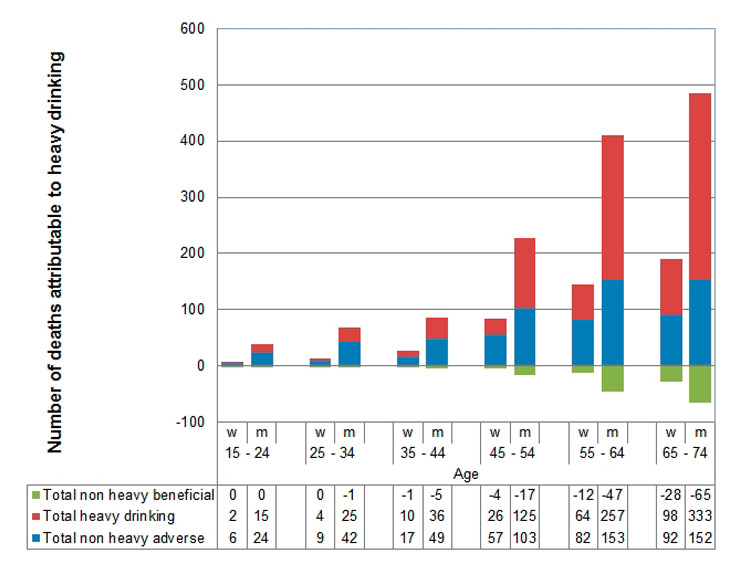
Figure 2
Alcohol-attributable deaths due to heavy drinking (60 g+/day for men, 40 g+/day for women) and non-heavy drinking.
The single most important cause of death due to alcohol among men was alcoholic liver disease, followed by self-inflicted injuries (table 3). For women, alcoholic liver disease was the single most important cause, followed by breast cancers. Overall, in broader categories, most alcohol-attributable deaths were due to injuries (522 deaths), cancers (473 deaths) and digestive diseases (440 deaths).
In younger ages alcohol-attributable deaths mainly stem from injuries, whereas with increasing age, digestive diseases (predominantly liver disease) and cancers gain increasing importance (fig. 1). Among women, breast cancer alone accounts for about one quarter of all alcohol-attributable deaths.
Overall, the share of alcohol-attributable YLL (9.7%, table 4) is higher than the share of alcohol-attributable deaths (8.7%), indicating that alcoholic deaths occur earlier than deaths from other causes in the age group 15–74. Although, there are relatively few alcohol-attributable deaths at younger ages, the proportion of alcohol-attributable deaths on all deaths is especially high in young men. More than 20% of all deaths of men aged 15–34 are due to alcohol. Among women in this age group more than 8% are due to alcohol. Most of the alcohol-attributable deaths in younger age groups were injuries, while chronic diseases prevail in higher age groups (table 4). Overall, there were about six-fold more injury deaths attributable to alcohol among men (446 deaths) compared with women (75 deaths), whereas the difference in deaths from chronic diseases was slightly higher than two-fold between men (734 deaths) and women (344 deaths).
Figure 2 shows that a substantial part of alcohol-attributable deaths is due to heavy drinking, defined as 60+ g/day for men and 40+ g/day for women. In total, 62% of all alcohol-attributable deaths (56% of all alcohol-attributable YLL, not tabulated) are due to heavy drinking. The share of heavy drinking increases with age. However, the share of heavy drinking stems mainly from men 45 years and older. In women except for the oldest age group, deaths from non-heavy drinking outnumber those of heavy drinking. Most of the caused deaths from non-heavy drinking in women (total net deaths = 216) stem from breast cancer (69 deaths) and injuries (47 deaths). Overall, the share of heavy drinking is 67% for men and 48% of women. Beneficial effects of non-heavy drinking only occur in older age groups. There are no beneficial effects of heavy drinking and the beneficial effects of non-heavy drinking do not outnumber (neither in number of deaths nor in terms of YLL (results not shown)) detrimental effects of non-heavy alcohol use in any age group.
| Table 3: Deaths, death rates and years of life lost per disease, by sex for age 15–74. | ||||||
| Condition | Deaths | Rate per 100,000 | YLL | |||
| Women | Men | Women | Men | Women | Men | |
| Cancers | 169 | 304 | 6.00 | 10.00 | 4,179 | 6,286 |
| Oral Cavity and Pharynx Cancer | 21 | 117 | 0.70 | 3.84 | 525 | 2,578 |
| Oesophagus Cancer | 10 | 77 | 0.31 | 2.55 | 221 | 1,551 |
| Colon Cancer | 12 | 21 | 0.38 | 0.69 | 260 | 406 |
| Rectum Cancer | 7 | 19 | 0.22 | 0.64 | 155 | 379 |
| Liver Cancer | 10 | 52 | 0.32 | 1.71 | 231 | 1,032 |
| Larynx Cancer | 3 | 17 | 0.09 | 0.55 | 57 | 340 |
| Breast Cancer | 107 | 3.52 | 0.00 | 2,729 | ||
| Cardiovascular diseases | 27 | –38 | 1.00 | –1.00 | 613 | –889 |
| Hypertension | 11 | 19 | 0.37 | 0.62 | 200 | 334 |
| Haemorrhagic Stroke | 29 | 29 | 0.96 | 0.96 | 705 | 602 |
| Ischaemic Stroke | –14 | 5 | –0.45 | 0.15 | –313 | 66 |
| Ischaemic heart disease | –7 | –120 | –0.22 | –3.94 | –180 | –2,541 |
| Conduction disorders and other dysrhythmias | 4 | 15 | 0.14 | 0.50 | 99 | 326 |
| Alcoholic cardiomyopathy | 3 | 14 | 0.10 | 0.46 | 102 | 323 |
| Digestive diseases | 116 | 324 | 4.00 | 11.00 | 3,285 | 7,646 |
| Pancreatitis | 1 | 9 | 0.03 | 0.28 | 17 | 190 |
| Liver Disease | 115 | 315 | 3.78 | 10.35 | 3,268 | 7,456 |
| Injuries | 75 | 446 | 2.00 | 15.00 | 2,734 | 14,351 |
| Motor Vehicle Accidents | 6 | 49 | 0.21 | 1.61 | 231 | 1,926 |
| Falls | 9 | 72 | 0.31 | 2.36 | 264 | 1,656 |
| Other unintentional injuries | 23 | 127 | 0.75 | 4.18 | 864 | 4,410 |
| Self inflicted injuries | 35 | 193 | 1.14 | 6.35 | 1,276 | 6,171 |
| Assault | 2 | 5 | 0.08 | 0.17 | 98 | 189 |
| Mental disorder due to use of alcohol | 42 | 117 | 1.38 | 3.84 | 1,106 | 2,797 |
| Mental disorder due to use of alcohol | 42 | 117 | 1.38 | 3.84 | 1,106 | 2,797 |
| Other | –10 | 28 | 0.00 | 1.00 | –170 | 689 |
| Epilepsy | 4 | 9 | 0.13 | 0.30 | 114 | 260 |
| Lower respiratory infections | 5 | 15 | 0.16 | 0.48 | 109 | 284 |
| Tuberculosis | 1 | 1 | 0.02 | 0.05 | 15 | 42 |
| HIV | 1 | 2 | 0.02 | 0.06 | 22 | 57 |
| Diabetes Mellitus | –22 | –6 | –0.71 | –0.20 | –464 | –127 |
| Other 100% alcohol-attributable1 | 2 | 7 | 0.07 | 0.23 | 34 | 173 |
| Total beneficial | –42 | –126 | –1.38 | –4.15 | –957 | –2,678 |
| Total adverse | 461 | 1,307 | 15.17 | 42.94 | 12,704 | 33,558 |
| Total net | 419 | 1,181 | 13.79 | 38.79 | 11,747 | 30,880 |
| Remark: 1 Degeneration of nervous system due to alcohol, Alcoholic polyneuropathy. | ||||||
| Table 4: Alcohol-attributable deaths and years of life lost (YLL) by age and injuries versus diseases. | |||||||
| Women | |||||||
| 15 – 24 | 25 – 34 | 35 – 44 | 45 – 54 | 55 – 64 | 65 – 74 | Total | |
| Injury deaths | 7 | 10 | 8 | 16 | 19 | 16 | 75 |
| Disease deaths | 3 | 18 | 63 | 115 | 145 | 344 | |
| Total deaths | 7 | 13 | 26 | 79 | 133 | 162 | 419 |
| % of total deaths | 8.7% | 9.0% | 7.1% | 8.2% | 6.8% | 4.7% | 6.0% |
| Injury YLL | 446 | 551 | 380 | 558 | 512 | 288 | 2,734 |
| Disease YLL | 10 | 161 | 771 | 2,267 | 3,112 | 2,692 | 9,013 |
| Total YLL | 456 | 712 | 1151 | 2,825 | 3,623 | 2,980 | 11,747 |
| % of total YLL | 8.6% | 9.0% | 7.0% | 8.2% | 7.0% | 4.8% | 6.6% |
| Men | |||||||
| 15 – 24 | 25 – 34 | 35 – 44 | 45 – 54 | 55 – 64 | 65 – 74 | Total | |
| Injury deaths | 38 | 62 | 50 | 85 | 97 | 115 | 446 |
| Disease deaths | 1 | 5 | 31 | 126 | 267 | 305 | 734 |
| Total deaths | 39 | 67 | 81 | 211 | 363 | 420 | 1,181 |
| % of total deaths | 20.9% | 24.3% | 12.7% | 13.4% | 11.0% | 7.5% | 10.2% |
| Injury YLL | 2,299 | 3,215 | 2,044 | 2,733 | 2,251 | 1,809 | 14,351 |
| Disease YLL | 71 | 244 | 1,245 | 3,969 | 6,168 | 4,833 | 16,528 |
| Total YLL | 2,370 | 3,459 | 3,289 | 6,702 | 8,418 | 6,642 | 30,880 |
| % of total YLL | 20.9% | 24.4% | 12.7% | 13.4% | 11.1% | 7.8% | 11.8% |
| Total | |||||||
| 15 – 24 | 25 – 34 | 35 – 44 | 45 – 54 | 55 – 64 | 65 – 74 | Total | |
| Injury deaths | 45 | 72 | 58 | 100 | 115 | 131 | 522 |
| Disease deaths | 1 | 8 | 48 | 189 | 381 | 450 | 1,078 |
| Total deaths | 46 | 80 | 106 | 289 | 497 | 581 | 1,600 |
| % of total deaths | 17.2% | 19.0% | 10.6% | 11.4% | 9.5% | 6.4% | 8.7% |
| Injury YLL | 2,745 | 3,766 | 2,424 | 3,291 | 2,762 | 2,097 | 17,085 |
| Disease YLL | 82 | 405 | 2,016 | 6,235 | 9,279 | 7,525 | 25,541 |
| Total YLL | 2,826 | 4,171 | 4,440 | 9,526 | 12,042 | 9,622 | 42,627 |
| % of total YLL | 17.0% | 18.9% | 10.5% | 11.3% | 9.5% | 6.5% | 9.7% |
Overall, with 8.7% of all deaths caused and 9.7% of all YLL among 15–74 year old people, alcohol is a major risk factor for avoidable mortality in Switzerland. The most important alcohol-attributable death causes were injuries (including self-inflicted injuries), followed by cancers and digestive diseases (mostly liver disease). About three quarters of all alcohol-attributable deaths occur in men, and the difference between men and women is larger for injuries than for chronic diseases. Injuries accounted for over a third of alcohol-attributable mortality in men, but only about a sixth in women. In younger ages (15–34) injuries are by far the most important cause of alcohol-attributable deaths causing more than 20% of all deaths in men (more than 8% among women) at ages between 15 and 34 years old. This corresponds well to the literature that alcohol use is the leading cause of mortality (and also morbidity) in adolescence and early adulthood [46, 47]. A major factor for alcohol related injuries has been found to be RSOD [48], which is the predominant drinking style among young people in Switzerland, particularly among men [30, 49, 50].
Later in life (35–54 years) digestive diseases, mainly alcoholic liver disease, and cancers become the most relevant factors, with cancer being the dominant cause in the oldest age group (65–74 years). About a quarter (107 deaths) of alcohol-attributable deaths in women is caused by breast cancer alone. The greater part of those breast cancer deaths (69 deaths, 65% of all alcohol-attributable breast cancers) are caused by non-heavy drinking, i.e. relative low amounts of alcohol consumption. This indicates that, especially for women, even low levels of alcohol may not be advisable, which is corroborated by the fact that the number of deaths by breast cancer due to non-heavy drinking alone exceeded the total beneficial effects of alcohol in women between 15 and 74 years old. This finding is also consistent with earlier reviews [14] and was confirmed by a recent meta-analysis on light drinking (one drink or less), showing that a relevant share of breast cancer mortality is caused by light to moderate drinking [51]. Thus, particularly for women, preventive actions that target alcohol use at all levels and not only heavy drinking are important.
Overall, 62% of all alcohol-attributable deaths and 56% of all alcohol-attributable YLL are caused by heavy drinking defined as 60+ grams per day for men, and 40+ grams per day for women. However, this effect is mainly due to heavy drinking among men (67% of all alcohol-attributable deaths), especially among those aged 45 years and older, and its impact on chronic diseases. Nevertheless, these findings show that targeted preventive approaches for heavy drinking and alcohol dependence are needed.
The present study also showed some protective effects, which stem mainly from ischaemic heart disease and were more prominent in men. The reason for the gender difference in protective effects is that the protective effect for ischaemic heart disease is lower for women and that women die less often from IHD before the age of 74. Protective effects only occurred in non-heavy drinkers and never outnumbered deaths or YLL in any age group. Protective effects of alcohol consumption have received significant attention in the past and were estimated to be high in earlier studies in Switzerland [14, 46]. In the estimate for the year 1998 [14], prevented deaths even outweighed caused deaths over all age groups. This conflicting findings [14] were mainly due to the oldest age group of 75+ years, i.e. the total number of alcohol caused deaths was about equal to the number of prevented death among people aged 75 years and older. In the present study with a restricted age range of 15–74 years, prevented deaths (168 deaths) were less than 10% of the deaths caused (1,768 deaths) by alcohol. Besides the age effect, the low proportion of prevented deaths is also due to the fact that in earlier estimates the lack of protective effects in people with RSOD has not been incorporated, as was done in the present study. A further reason is that, compared to the present study, former drinkers could not be excluded from the reference group, which resulted in an overestimate of the protective effect compared to using lifetime abstainers as reference. The present findings indicate that prevented deaths should not be used as an argument to promote moderate drinking as a general population goal [52].
The present study has certain limitations: The uncertainty estimates around alcohol-attributable deaths and YLLs account for neither the uncertainty introduced by the upshifting to per capita consumption, nor for the uncertainty of the death statistics. Studies show that the uncertainty introduced by the latter might be considerable [42, 53]. Such uncertainty may affect total mortality statistics less if causes of death are misclassified between categories with similar AFFs (e.g. different alcohol-attributable cancers), however it may strongly affect overall estimates if, for example, there is uncertainty [e.g. 43, 54] between diagnosing IHD (mainly beneficial) and detrimental causes (hypertension, cancers) as a cause of death. The method for estimating alcohol consumption volume by upshifting to 80% of the per capita consumption is another possible source of bias in the mortality estimates. Upshifting relies on the difficult to prove assumptions that surveys underestimate alcohol consumption more than the clinical studies from which the relative risk data were taken, that surveys do not reach a relevant part of the heavy drinking population (such as homeless or institutionalized people) and that per capita consumption is the better indicator for overall alcohol consumption volume. A sensitivity analysis using data from the United States (US) with and without up-estimation of alcohol consumption from survey data to per capita consumption showed that alcohol-related death would be 11% and YLL around 9% lower without up-estimation (for alcohol related mortality in the US see [7], for further sensitivity analyses on this assumption see [55]).
While the present methods accounts for many causes of death for which a causal alcohol link is established, there are still some causes for which a causal relation to alcohol is likely, for example infection with sexually transmitted diseases [56] or depression [57], but evidence is not yet strong enough or quantification is not possible. For example, because the role of depression induced by alcohol cannot be separated from the role of alcohol as self medication in depression.
Despite some limitations, the relevance of heavy drinking, non-heavy drinking and RSOD for alcohol-attributable mortality points to the importance of multiple preventive approaches as different drinking styles are relevant for alcohol-attributable mortality. Heavy drinking is overall responsible for the majority of alcohol-attributable deaths. RSOD is relevant for injuries and especially relevant for deaths among young people [58]. Although the individual risk of non-heavy drinking is smaller compared to heavy drinking, it still causes a relevant share of alcohol-attributable deaths through the large number of people in the non-heavy drinking group. Thus, a mixture of approaches such as treatment for heavy and dependent drinking [59], preventive measures to reduce RSOD but also harm from RSOD, as well as measures to reduce overall exposure to alcohol, e.g. by taxation [60], are needed to reduce alcohol-attributable mortality. The first two approaches are already core parts of the national alcohol program in Switzerland [61], while the reduction of drinking through universal preventive approaches currently receives relatively little attention in Switzerland.
A much discussed concept in alcohol research is the preventive paradox [11, 12], stating that the majority of health risks stem not from the heaviest drinking group, but from the moderate drinkers because of their relatively higher numbers compared to heavy drinkers. The present studies results indicate that a relevant share of alcohol-attributable mortality is indeed due to non-heavy drinking, especially in women. The overall larger part of alcohol-attributable mortality, however, is due to heavy drinking, showing clearly the relevance of approaches targeting heavy drinkers [62]. One promising and effective approach is the use of screening and brief intervention through general practitioners [63]. Much of the alcohol-attributable burden stems from an age onwards where visits to health professionals become more and more likely. Health professionals should systematically screen their patients for alcohol use and provide adequate interventions when necessary. Brief interventions or advice to reduce drinking are already indicated in people that drink relatively little alcohol and the effectiveness of such brief Interventions has also been shown in Switzerland among young people [e.g. 64, 65]. Some promising approaches to promote delivering of brief interventions by general practitioners exist in Switzerland [66] and should be implemented on a large scale.
Correspondence: Simon Marmet, lic. phil.,Addiction Switzerland, Av. Louis-Ruchonnet 14, CH-1003 Lausanne, Switzerland, smarmet[at]addictionsuisse.ch
| Table A1: Disease and injury categories causally impacted by alcohol. | |
| Category | ICD-10 code |
| Cancers | |
| Mouth, nasopharynx, other pharynx and oropharynx cancer | C00–C14 |
| Oesophagus cancer | C15 |
| Colon and rectal cancer | C18–C21 |
| Liver cancer | C22 |
| Larynx cancer | C32 |
| Breast cancer (female) | C50 |
| Cardiovascular diseases | |
| Hypertensive heart disease | I11–I13 |
| Ischaemic heart disease | I20–I25 |
| Cardiomyopathy | |
| Alcoholic cardiomyopathy | I42.6 |
| Conduction disorders and other dysrhythmias | I47–I49 |
| Cerebrovascular disease | |
| Haemorrhagic and other non-ischaemic stroke | I60–I62, I69.0, I69.1, I69.2 |
| Ischaemic stroke | I63–I67, I69.3 |
| Digestive diseases | |
| Alcoholic gastritis | K29.2 |
| Alcoholic liver disease | K70 |
| Alcoholic fatty liver | K70.0 |
| Alcoholic hepatitis | K70.1 |
| Alcoholic fibrosis and sclerosis of liver | K70.2 |
| Alcoholic cirrhosis of liver | K70.3 |
| Alcoholic hepatic failure | K70.4 |
| Alcoholic liver disease, unspecified | K70.9 |
| Pancreatitis (we used AAF for the larger category based on RR) | K85, K86.0, 86.1 |
| Alcohol-induced acute pancreatitis | K85.2 |
| Alcohol-induced chronic pancreatitis | K86.0 |
| Injuries | |
| Toxic effect of alcohol | T51 |
| Ethanol | T51.0 |
| Methanol | T51.1 |
| Other alcohols | T51.8 |
| Alcohol unspecified | T51.9 |
| Unintentional injuries | |
| Motor‐vehicle accidents | § |
| Poisoning | X40–X49 |
| Accidental poisoning by and exposure to alcohol | X45 |
| Falling | W00‐W19 |
| Fires | X00‐X09 |
| Drowning | W65‐W74 |
| Other unintentional injury | †Rest of V‐series and W20‐W64, |
| W 75‐W99, X10‐X39, X50‐X59, Y40‐Y86, Y88, and Y89.1–89.9, Y15 | |
| Intentional injuries | |
| Self-inflicted injuries | X60–X84, Y87.0 |
| Intentional self-poisoning by and exposure to alcohol | X65 |
| Violence | X85‐Y09, Y87.1 |
| Other intentional injury | Y35, Y89.0 |
| Mental and behavioural disorders due to use of alcohol | F10 |
| Acute intoxication | F10.0 |
| Harmful use | F10.1 |
| Dependence syndrome | F10.2 |
| Withdrawal state | F10.3 |
| Withdrawal state with delirium | F10.4 |
| Psychotic disorder | F10.5 |
| Amnesic syndrome | F10.6 |
| Residual and late-onset psychotic disorder | F10.7 |
| Other mental and behavioural disorders | F10.8 |
| Unspecified mental and behavioural disorder | F10.9 |
| Other diseases | |
| Tuberculosis | A15–A19, B90 |
| HIV/AIDS | B20–B24 |
| Diabetes mellitus | E11–E14 |
| Degeneration of nervous system due to alcohol | G31.2 |
| Alcohol-induced pseudo-Cushing's syndrome | E24.4 |
| Epilepsy | G40, G41 |
| Alcoholic polyneuropathy | G62.1 |
| Alcoholic myopathy | G72.1 |
| Lower respiratory infections: pneumonia | J09–J22, J85 |
| Finding of alcohol in blood | R78.0 |
| § V021–V029, V031–V039, V041–V049, V092, V093, V123–V129, V133–V139, V143–V149, V194–V196, V203–V209, V213–V219, V223– V229, V233–V239, V243–V249,V253–V259, V263–V269, V273–V279, V283–V289, V294–V299, V304–V309, V314–V319, V324–V329, V334– V339, V344–V349, V354–V359, V364–V369, V374–V379, V384–V389, V394–V399, V404–V409, V414–V419, V424–V429, V434–V439, V444–V449, V454–V459, V464–V469, V474–V479, V484–V489, V494–V499, V504–V509, V514–V519, V524–V529, V534–V539, V544–V549, V554–V559, V564–V569, V574–V579, V584–V589, V594–V599, V604–V609, V614–V619, V624–V629, V634–V639, V644–V649, V654–V659, V664–V669, V674–V679, V684–V689, V694–V699, V704–V709, V714–V719, V724–V729, V734–V739, V744–V749, V754–V759, V764–V769, V774–V779, V784–V789, V794–V799, V803–V805, V811, V821, V830–V833, V840–V843, V850–V853, V860–V863, V870–V878, V892. Remark: shaded causes are 100% alcohol-attributable. Adapted from Rehm et al. [9] | |
| Table A2: Alcohol-attributable fractions, women 2011. | ||||||||||||
| Disease | Age | |||||||||||
| 15 – 24 | 25 – 34 | 35 – 44 | 45 – 54 | 55 – 64 | 65 – 74 | |||||||
| AAF | SD | AAF | SD | AAF | SD | AAF | SD | AAF | SD | AAF | SD | |
| Oral cavity and pharynx cancer | 23.57% | 0.0248 | 30.11% | 0.0281 | 26.01% | 0.0264 | 27.85% | 0.0278 | 33.78% | 0.0311 | 36.40% | 0.0312 |
| Oesophagus cancer | 13.20% | 0.0140 | 18.10% | 0.0175 | 14.84% | 0.0153 | 15.97% | 0.0165 | 19.85% | 0.0201 | 22.10% | 0.0210 |
| Colon cancer | 3.51% | 0.0075 | 6.18% | 0.0112 | 4.14% | 0.0085 | 4.33% | 0.0090 | 4.97% | 0.0107 | 6.32% | 0.0122 |
| Rectal cancer | 4.83% | 0.0065 | 7.78% | 0.0100 | 5.59% | 0.0074 | 5.91% | 0.0078 | 6.97% | 0.0091 | 8.42% | 0.0105 |
| Liver cancer | 7.78% | 0.0129 | 11.28% | 0.0163 | 8.81% | 0.0142 | 9.38% | 0.0152 | 11.22% | 0.0183 | 12.83% | 0.0194 |
| Larynx cancer | 14.08% | 0.0157 | 19.17% | 0.0196 | 15.80% | 0.0173 | 17.01% | 0.0187 | 21.14% | 0.0227 | 23.45% | 0.0236 |
| Breast cancer | 9.32% | 0.0115 | 13.31% | 0.0150 | 10.55% | 0.0128 | 11.31% | 0.0137 | 13.89% | 0.0169 | 15.76% | 0.0181 |
| Epilepsy | 12.88% | 0.0183 | 17.60% | 0.0230 | 14.44% | 0.0201 | 15.51% | 0.0219 | 19.18% | 0.0274 | 21.37% | 0.0290 |
| Lower respiratory infections | 5.89% | 0.0173 | 9.08% | 0.0221 | 6.77% | 0.0193 | 7.19% | 0.0208 | 8.60% | 0.0261 | 10.14% | 0.0281 |
| Haemorrhagic stroke | 13.62% | 0.0387 | 17.97% | 0.0523 | 15.24% | 0.0432 | 16.54% | 0.0469 | 21.08% | 0.0594 | 23.12% | 0.0654 |
| Tuberculosis | 7.38% | 0.0195 | 13.38% | 0.0261 | 9.28% | 0.0226 | 10.57% | 0.0248 | 15.31% | 0.0319 | 18.20% | 0.0340 |
| Diabetes mellitus | –23.13% | 0.0382 | –22.09% | 0.0455 | –23.54% | 0.0413 | –24.22% | 0.0445 | –23.27% | 0.0528 | –21.08% | 0.0551 |
| Hypertension | 1.11% | 0.0876 | 10.58% | 0.1011 | 4.44% | 0.0942 | 7.15% | 0.0999 | 18.65% | 0.1108 | 23.64% | 0.1118 |
| Liver cirrhosis | 64.38% | 0.0413 | 71.74% | 0.0427 | 67.09% | 0.0412 | 68.72% | 0.0404 | 73.29% | 0.0380 | 75.70% | 0.0377 |
| Ischaemic stroke | –25.71% | 0.0677 | –20.94% | 0.0755 | –23.28% | 0.0655 | –23.06% | 0.0670 | –17.35% | 0.0649 | –10.42% | 0.0526 |
| Pancreatitis | 5.69% | 0.0123 | 10.63% | 0.0217 | 7.08% | 0.0154 | 8.00% | 0.0183 | 12.51% | 0.0314 | 15.86% | 0.0370 |
| Ischaemic heart diseases | –4.04% | 0.0628 | –1.46% | 0.0738 | –4.26% | 0.0594 | –4.46% | 0.0630 | –4.12% | 0.0683 | –0.49% | 0.0692 |
| Conduction disorders and other dysrhythmias | 6.73% | 0.0110 | 10.11% | 0.0146 | 7.69% | 0.0122 | 8.19% | 0.0131 | 9.88% | 0.0162 | 11.49% | 0.0175 |
| Motor vehicle accidents | 13.91% | 0.0184 | 14.72% | 0.0181 | 8.83% | 0.0106 | 10.64% | 0.0097 | 12.22% | 0.0107 | 14.53% | 0.0187 |
| Non-motor vehicle accidents | 16.13% | 0.0311 | 16.14% | 0.0326 | 11.69% | 0.0219 | 12.24% | 0.0219 | 15.76% | 0.0296 | 14.49% | 0.0382 |
| HIV treatment non-adherence | 5.67% | 0.0139 | 5.65% | 0.0139 | 5.73% | 0.0141 | 5.82% | 0.0143 | 5.75% | 0.0141 | 5.59% | 0.0138 |
| Table A3: Alcohol-attributable fractions, men 2011. | ||||||||||||
| Disease | Age | |||||||||||
| 15 – 24 | 25 – 34 | 35 – 44 | 45 – 54 | 55 – 64 | 65 – 74 | |||||||
| AAF | SD | AAF | SD | AAF | SD | AAF | SD | AAF | SD | AAF | SD | |
| Oral cavity and pharynx cancer | 48.23% | 0.0304 | 50.50% | 0.0296 | 44.25% | 0.0320 | 48.41% | 0.0307 | 54.39% | 0.0279 | 59.97% | 0.0233 |
| Oesophagus cancer | 30.30% | 0.0246 | 32.36% | 0.0247 | 26.88% | 0.0242 | 30.46% | 0.0248 | 35.98% | 0.0246 | 41.76% | 0.0220 |
| Colon cancer | 4.82% | 0.0161 | 5.33% | 0.0172 | 4.33% | 0.0144 | 4.99% | 0.0162 | 5.96% | 0.0195 | 7.10% | 0.0229 |
| Rectal cancer | 8.37% | 0.0121 | 9.13% | 0.0127 | 7.47% | 0.0109 | 8.56% | 0.0121 | 10.28% | 0.0141 | 12.23% | 0.0159 |
| Liver cancer | 15.22% | 0.0274 | 16.34% | 0.0286 | 13.75% | 0.0252 | 15.44% | 0.0275 | 18.20% | 0.0312 | 21.14% | 0.0346 |
| Larynx cancer | 32.20% | 0.0283 | 34.32% | 0.0283 | 28.65% | 0.0276 | 32.37% | 0.0283 | 38.05% | 0.0285 | 43.91% | 0.0265 |
| Breast cancer | 0.00% | 0.0000 | 0.00% | 0.0000 | 0.00% | 0.0000 | 0.00% | 0.0000 | 0.00% | 0.0000 | 0.00% | 0.0000 |
| Epilepsy | 29.15% | 0.0401 | 31.18% | 0.0416 | 25.84% | 0.0367 | 29.32% | 0.0400 | 34.74% | 0.0440 | 40.48% | 0.0464 |
| Lower respiratory infections | 11.23% | 0.0445 | 12.19% | 0.0474 | 10.00% | 0.0396 | 11.42% | 0.0446 | 13.73% | 0.0531 | 16.32% | 0.0620 |
| Haemorrhagic stroke | 16.37% | 0.0297 | 17.72% | 0.0315 | 14.55% | 0.0269 | 16.62% | 0.0300 | 19.89% | 0.0345 | 23.52% | 0.0388 |
| Tuberculosis | 27.15% | 0.0460 | 29.26% | 0.0469 | 23.10% | 0.0440 | 27.26% | 0.0461 | 32.89% | 0.0487 | 38.27% | 0.0495 |
| Diabetes mellitus | -5.35% | 0.0670 | –4.95% | 0.0716 | –6.42% | 0.0614 | –5.44% | 0.0680 | –4.62% | 0.0810 | –2.98% | 0.0929 |
| Hypertension | 20.75% | 0.0286 | 22.23% | 0.0299 | 18.31% | 0.0262 | 20.84% | 0.2084 | 25.04% | 0.0320 | 29.59% | 0.0348 |
| Liver cirrhosis | 65.24% | 0.0537 | 68.13% | 0.0514 | 58.73% | 0.0566 | 65.15% | 0.0537 | 72.74% | 0.0469 | 79.26% | 0.0381 |
| Ischaemic stroke | –2.07% | 0.0327 | –0.74% | 0.0335 | –4.75% | 0.0325 | –2.04% | 0.0317 | 0.94% | 0.0324 | 3.77% | 0.0248 |
| Pancreatitis | 28.21% | 0.0627 | 31.69% | 0.0661 | 21.12% | 0.0529 | 28.00% | 0.0626 | 37.79% | 0.0711 | 48.73% | 0.0737 |
| Ischaemic heart diseases | –6.90% | 0.0482 | –7.68% | 0.0555 | –9.78% | 0.0408 | –9.34% | 0.0402 | –9.73% | 0.0426 | –7.57% | 0.0696 |
| Conduction disorders and other dysrhythmias | 13.49% | 0.0255 | 14.59% | 0.0269 | 11.99% | 0.0228 | 13.68% | 0.0255 | 16.43% | 0.0299 | 19.50% | 0.0339 |
| Motor vehicle accidents | 34.13% | 0.0624 | 36.11% | 0.0612 | 21.65% | 0.0359 | 26.10% | 0.0327 | 29.97% | 0.0364 | 35.64% | 0.0634 |
| Non-motor vehicle accidents | 28.50% | 0.0331 | 36.50% | 0.0749 | 20.09% | 0.0408 | 25.49% | 0.0505 | 34.53% | 0.0685 | 51.01% | 0.1038 |
| HIV treatment non-adherence | 5.90% | 0.0145 | 5.96% | 0.0146 | 6.16% | 0.0150 | 6.01% | 0.0147 | 6.11% | 0.0149 | 6.00% | 0.0147 |
1 Murray CJL, Vos T, Lozano R, Naghavi M, Flaxman AD, Michaud C, et al. Disability-adjusted life years (DALYs) for 291 diseases and injuries in 21 regions, 1990–2010: A systematic analysis for the Global Burden of Disease Study 2010. Lancet. 2012;380(9859):2197–223.
2 Lim SS, Vos T, Flaxman AD, Danaei G, Shibuya K, Adair-Rohani H, et al. A comparative risk assessment of burden of disease and injury attributable to 67 risk factors and risk factor clusters in 21 regions, 1990–2010: A systematic analysis for the Global Burden of Disease Study 2010. Lancet. 2012;380(9859):2224–60.
3 Rehm J, Borges G, Gmel G, Graham K, Grant B, Parry C, et al. The comparative risk assessment for alcohol as part of the Global Burden of Disease 2010 Study: What changed from the last study? Int J Alcohol Drug Res. 2013;2(1):1–5.
4 Eidgenössische Alkoholverwaltung (EAV). Alkohol in Zahlen. Bern, Schweiz: Eigenössische Alkoholverwaltung (EAV), Bern. 2012. Available from: http://www.eav.admin.ch/dokumentation/00445/00582/. Accessed 09.10.2013
5 Rehm J, Shield KD, Rehm MX, Gmel G, Frick U. Alcohol consumption, alcohol dependence and attributable burden of disease in Europe: Potential gains from effective interventions for alcohol dependence. Toronto, Canada: Centre for Addiction and Mental Health, 2012.
6 World Health Organization (WHO). Global Information System on Alcohol and Health (GISAH). Geneva: WHO. 2013. Available from: http://apps.who.int/gho/data/node.main.GISAH. Accessed 09.10.2013
7 Shield KD, Rylett M, Gmel G, Sen., Gmel G, Jr., Kehoe-Chan TAK, Rehm J. Global alcohol exposure estimates by country, territory and region for 2005 – a contribution to the Comparative Risk Assessment for the 2010 Global Burden of Disease Study. Addiction. 2013;108(5):912–22.
8 World Health Organization (WHO). Lexicon of Alcohol and Drug Terms. Geneva, Switzerland: WHO Office of Publications. 1994. Available from: http://www.who.int/substance_abuse/terminology/who_lexicon . Accessed 09.10.2013
9 Rehm J, Baliunas D, Borges GLG, Graham K, Irving H, Kehoe T, et al. The relation between different dimensions of alcohol consumption and burden of disease: An overview. Addiction. 2010;105(5):817–43.
10 World Health Organization (WHO). Global health risks: Mortality and burden of disease attributable to selected major risks. Geneva, Switzerland: WHO. 2009. Available from: http://www.who.int/healthinfo/global_burden_disease/GlobalHealthRisks_report_full.pdf. Accessed 09.10.2013
11 Rose GL. Strategy of prevention: Lessons from cardiovascular disease. Br Med J. 1981;282(6279):1847–51.
12 Kreitman N. Alcohol consumption and the preventive paradox. Br J Addict. 1986;81(3):353–63.
13 World Health Organization (WHO). Global strategy to reduce the harmful use of alcohol. Geneva, Switzerland: World Health Organisation (WHO). 2010. Available from: http://www.who.int/substance_abuse/alcstratenglishfinal.pdf. Accessed 09.10.2013
14 Gutjahr E, Gmel G. Association of alcohol consumption to mortality and person-years of life lost in Switzerland – measuring the impact of some methodological options. Eur J Epidemiol. 2005;20:37–47.
15 Rehm J, Roerecke M, Patra J. Alcohol-attributable mortality and burden of disease in Switzerland – epidemiology and recommendations for alcohol policy. Zürich: Institut für Sucht- und Gesundheitsforschung (ISGF), 2006.
16 Lönnroth K, Williams BG, Stadlin S, Jaramillo E, Dye C. Alcohol use as a risk factor for tuberculosis – A systematic review. BMC Pub Health. 2008;8:289.
17 Klatsky AL, Udaltsova N. Alcohol drinking and total mortality risk. Ann Epidemiol. 2007;17(5):S63–S7.
18 Walter SD. The estimation of interpretation of attributable risk in health research. Biometrics. 1976;32:829–49.
19 Walter SD. Prevention of multifactorial disease. Am J Epidemiol. 1980;112:409–16.
20 Benichou J. A review of adjusted estimators of attributable risk. Stat Methods Med Res. 2001;10(3):195–216.
21 Gmel G, Jr., Shield KD, Frick H, Kehoe T, Gmel G, Sen., Rehm J. Estimating uncertainty of alcohol-attributable fractions for infectious and chronic diseases. BMC Med Res Methodol. 2011;11:48.
22 Kroese DP, Taimre T, Zdravko IB. Handbook of Monte Carlo methods. New York: John Wiley and Sons; 2011.
23 Roerecke M, Rehm J. The cardioprotective association of average alcohol consumption and ischaemic heart disease: A systematic review and meta-analysis. Addiction. 2012;107(7):1246–60.
24 Roerecke M, Rehm J. Irregular heavy drinking occasions and risk of ischemic heart disease: A systematic review and meta-analysis. Am J Epidemiol. 2010;171(6):633–44.
25 Gmel G, Jr., Shield KD, Rehm J. Developing a method to derive alcohol-attributable fractions for HIV/AIDS mortality based on alcohol's impact on adherence to antiretroviral medication. Popul Health Metrics. 2011;9(1):5.
26 Shield KD, Gmel G, Patra J, Rehm J. Global burden of injuries attributable to alcohol consumption in 2004: A novel way of calculating the burden of injuries attributable to alcohol consumption. Popul Health Metrics. 2012;10(1):9.
27 Gmel G, Givel J-C, Yersin B, Daeppen J-B. Injury and repeated injury – What is the link with acute consumption, binge drinking and chronic heavy alcohol use? SMW. 2007;137(45–46):642–8.
28 Ramstedt M. Alcohol consumption and liver cirrhosis mortality with and without mention of alcohol--the case of Canada. Addiction. 2003;98(9):1267–76.
29 Hanzlick R. Death certificates, natural death, and alcohol. The problem of underreporting. Am J Forensic Med Pathol. 1988;9(2):149–50.
30 Gmel G, Kuendig H, Maffli E, Notari L, Wicki M, Georges A, et al. Suchtmonitoring Schweiz / Jahresbericht – Daten 2011. Bern: Bundesamt für Gesundheit (BAG), 2012.
31 Rehm J, Kehoe T, Gmel G, Jr., Stinson FS, Grant BF, Gmel G. Statistical modelling of volume of alcohol exposure for epidemiological studies of population health: The US example. Popul Health Metrics. 2010;8:3.
32 Kehoe T, Gmel G, Jr., Shield KD, Gmel G, Sen., Rehm J. Determining the best population-level alcohol consumption model and its impact on estimates of alcohol-attributable harms. Popul Health Metrics. 2012;10:6.
33 Lachenmeier DW, Gmel G, Rehm J. Unrecorded alcohol consumption. In: Boyle P, Boffetta P, Lowenfels AB, Burns H, Brawley O, Zatonski W, et al., editors. Alcohol: Science, policy, and public health. Oxford: Oxford University Press; 2013. p. 132–40.
34 World Health Organization (WHO). Global Status Report on Alcohol and Health. Geneva: WHO. 2011. Available from: http://www.who.int/substance_abuse/publications/global_alcohol_report/en/index.html. Accessed 11.07.2013
35 Rehm J, Klotsche J, Patra J. Comparative quantification of alcohol exposure as risk factor for global burden of disease. Int J Meth Psych Res. 2007;16(2):66–76.
36 Midanik LT. Validity of self-reported alcohol use: A literature review and assessment. Br J Addict. 1988;83(9):1019–30.
37 Gmel G, Rehm J. Measuring alcohol consumption. Contemp Drug Probl. 2004;31:467–540.
38 Bundesamt für Statistik (BFS). Erhebungen, Quellen – Statistik der Todesursachen und Totgeburten (eCOD). Neuchâtel: BFS. 2013. Available from: http://www.bfs.admin.ch/bfs/portal/de/index/infothek/erhebungen__quellen/blank/blank/cod/02.html. Accessed 09.10.2013
39 Bundesamt für Statistik (BFS). Statistisches Jahrbuch der Schweiz 2013. Zürich: Verlag Neue Zürcher Zeitung; 2013.
40 Bundesamt für Statistik (BFS). STAT-TAB: Die interaktive Statistikdatenbank. Neuchâtel: BFS. 2013. Available from: http://www.pxweb.bfs.admin.ch/Dialog/statfile.asp?lang=1. Accessed 09.10.2013
41 Bundesamt für Statistik (BFS). Bevölkerungsbewegung – Indikatoren: Lebenserwartung. Neuchâtel: BFS. 2013. Available from: http://www.bfs.admin.ch/bfs/portal/de/index/themen/01/06/blank/key/04/04.html. Accessed 09.10.2013
42 Alperovitch A, Bertrand M, Jougla E, Vidal J-S, Ducimetiere P, Helmer C, et al. Do we really know the cause of death of the very old? Comparison between official mortality statistics and cohort study classification. Eur J Epidemiol. 2009;24(11):669–75.
43 Lloyd-Jones DM, Martin DO, Larson MG, Levy D. Accuracy of death certificates for coding coronary heart disease as the cause of death. Ann Intern Med. 1998;129(12):1020–6.
44 Tolstrup J, Gronbaek M. Alcohol and atherosclerosis: Recent insights. Current Atherosclerosis Reports. 2007;9(2):116–24.
45 R Development Core Team. R: A language and environment for statistical computing. Vienna, Austria 2011. Available from: http://www.R-project.org/. Accessed 09.10.2013
46 Rehm J, Taylor B, Room R. Global burden of disease from alcohol, illicit drugs and tobacco. Drug Alcohol Rev. 2006;25(6):503–13.
47 Gore FM, Bloem PJN, Patton GC, Ferguson J, Joseph V, Coffey C, et al. Global burden of disease in young people aged 10–24 years: A systematic analysis. Lancet. 2011;377(9783):2093–102.
48 Taylor B, Shield KD, Rehm J. Combining best evidence: A novel method to calculate the alcohol-attributable fraction and its variance for injury mortality. BMC Pub Health. 2011;11:265.
49 Kuntsche E, Gmel G. Alcohol consumption in late adolescence and early adulthood – Where is the problem? SMW. 2013;143:w1386.
50 Gmel G, Gaume J, Faouzi M, Kulling J-P, Daeppen J-B. Who drinks most of the total alcohol in young men – risky single occasion drinking as normative behaviour. Alcohol;43(6):692–7.
51 Bagnardi V, Rota M, Botteri E, Tramacere I, Islami F, Fedirko V, et al. Light alcohol drinking and cancer: A meta-analysis. Ann Oncol. 2013;24(2):301–8.
52 Fuchs FD, Chambless LE. Is the cardioprotective effect of alcohol real? Alcohol. 2007;41(6):399–402.
53 Alfsen GC, Maehlen J. The value of autopsies for determining the cause of death. Tidsskr Nor Laegeforen. 2012;132(2):147–51.
54 Mant J, Wilson S, Parry J, Bridge P, Wilson R, Murdoch W, et al. Clinicians didn't reliably distinguish between different causes of cardiac death using case histories. J Clin Epidemiol. 2006;59(8):862–7.
55 Rey G, Boniol M, Jougla E. Estimating the number of alcohol-attributable deaths: methodological issues and illustration with French data for 2006. Addiction. 2010;105(6):1018–29.
56 Schneider M, Chersich M, Neuman M, Parry C. Alcohol consumption and HIV/AIDS: The neglected interface. Addiction. 2012;107(8):1369–71.
57 Alati R, Lawlor DA, Najman JM, Williams GM, Bor W, O’Callaghan M. Is there really a 'J-shaped' curve in the association between alcohol consumption and symptoms of depression and anxiety? Findings from the Mater-University study of pregnancy and its outcomes. Addiction. 2005;100(5):643–51.
58 World Health Organization (WHO). International guide for monitoring alcohol consumption and related harm. Geneva: WHO, Department of Mental Health and Substance Dependence, Noncommunicable Diseases and Mental Health Cluster. 2000. Available from: http://whqlibdoc.who.int/hq/2000/WHO_MSD_MSB_00.4.pdf. Accessed 09.10.2013
59 Rehm J, Shield KD, Gmel G, Rehm MX, Frick U. Modeling the impact of alcohol dependence on mortality burden and the effect of available treatment interventions in the European Union. Eur Neuropsychopharmacol. 2013;23(2):89–97.
60 Anderson P, Chisholm D, Fuhr DC. Effectiveness and cost-effectiveness of policies and programmes to reduce the harm caused by alcohol. Lancet. 2009;373(9682):2234–46.
61 Bundesamt für Gesundheit (BAG). Nationales Programm Alkohol. Bericht für die Jahre 2008 – 2012. Bern: BAG, 2013.
62 Rehm J, Roerecke M. Reduction of drinking in problem drinkers and all-cause mortality. Alcohol. 2013;48(4):509–13.
63 Kaner EF, Beyer F, Dickinson HO, Pienaar E, Campbell F, Schlesinger C, et al. Effectiveness of brief alcohol interventions in primary care populations. Cochrane Database Syst Rev. 2007(2):CD004148.
64 Gaume J, Gmel G, Faouzi M, Bertholet N, Daeppen J-B. Is brief motivational intervention effective in reducing alcohol use among young men voluntarily receiving it? A randomized controlled trial. Alcohol Clin Exp Res. 2011;35(10):1822–30.
65 Gmel G, Venzin V, Marmet K, Danko G, Labhart F. A quasi-randomized group trial of a brief alcohol intervention on risky single occasion drinking among secondary school students. Int J Publ Health. 2012;57(6):935–44.
66 Neuner-Jehle S, Schmid M, Grüninger U. The “Health Coaching” programme: A new patient-centred and visually supported approach for health behaviour change in primary care. BMC family practice. 2013;14:100.
Funding / potential competing interests: This project received financial support from the Swiss Federal Office of Public Health (Contract 12.005688/204.00011– 1016). The methodology used was developed as part of the Comparative Risk Assessment for Alcohol within the Global Burden of Disease and Injury 2010 Study.