
Figure 1
Study flowchart
DOI: https://doi.org/10.4414/smw.2014.13942
Abbreviations
CHD = coronary heart disease
FGF-23: fibroblast growth factor 23
HBA1c: glycosylated haemoglobin
HOMA: homeostasis model assessment
HOMA-IR: homeostasis model assessment insulin resistance
hsCRP: high-sensitivity C-reactive protein
PTH: parathyroid hormone
T2DM: type 2 diabetes mellitus
T1DM: type 1 diabetes mellitus
Epidemiological and observational evidence suggests that vitamin D (D3) supply inversely correlates with the risk for T2DM and, once diabetic, serum 25(OH)-D3 levels correlate inversely with impaired glucose tolerance [1, 2]. Since cardiovascular events are greatly increased in T2DM, it has been suggested that D3 status measured as serum 25(OH)-D3 levels might be a modifiable risk factor for cardiovascular events in T2DM patients, as well as in the general population [1, 2]. D3 is required for and improves the production of insulin, and is also implicated in the mechanism of insulin action [3, 4]. However, in both nondiabetic and diabetic patients, the clinical associations of D3 with insulin resistance and beta-cell function are inconsistent [2, 5, 6], and reported intervention studies employing D3 either as 25(OH)-D3 (e.g., cholecalciferol) or as 1,25(OH)2-D3 (e.g., calcitriol) have yielded conflicting results that are difficult to interpret owing to lack of placebo control [7, 8].
Supplementation of D3 and calcium (400 IU D3 and 1000 mg calcium daily) did not reduce the risk of developing diabetes in the Women’ s Health Study over 7 years of follow-up [7] and supplementation of D3 in normal subjects (20,000 IU D3 orally twice weekly for 6 months) did not affect insulin secretion nor sensitivity [8], whereas supplementing 700 IU D3 daily over 3 years was found to attenuate the increases in glycaemia and insulin resistance in elderly subjects with impaired fasting glucose at baseline [9]. In a short-term study (4 weeks) in nondiabetic subjects with D3 deficiency (25(OH)-D3 <25 nmol/l) two oral doses of D3 (100,000 IU D32 weeks apart) had no significant effect on serum glucose, insulin concentration and insulin sensitivity assessed with an oral glucose tolerance test [10]. However, in a study of subjects at risk for T2DM, oral supplementation of D3 (2,000 IU D3 daily for 4 months) was shown to improve beta-cell function, but not insulin sensitivity [11].
Results from randomised controlled trials that evaluated the specific effects of 25(OH)-D3 or 1,25(OH)2-D3 (without also adding calcium to D3) on glucose and insulin homeostasis in T2DM patients have been conflicting [2, 12–20]. A recently published systematic review examining the effect of vitamin D supplementation in 15 newer published studies [21] again found discrepancies in outcomes, which may be due to heterogeneous study populations (number of patients included, stage of diabetes, gender, age, oral or insulin treatment) or to heterogeneous interventions (oral, parenteral, dose, duration).
In view of the suggestive but inconclusive evidence for a clinically important effect of exogenous D3 supplementation on glucose and insulin homeostasis in both normal and diabetic subjects and as few placebo-controlled intervention data are available, we wished to assess insulin sensitivity to large doses of D3in a double-blinded, randomised, placebo-controlled trial in stable T2DM patients. In addition, in view of the lack of information on responses of calcium/phosphate metabolism, calci-/phosphotropic hormones and 24-hour ambulatory blood pressures to large doses of D3 in T2DM patients, this study also explored these data.
This prospective, randomised, double-blind, placebo-controlled pilot study was performed at a single university care setting in Switzerland. The study was approved by the local internal review board (EKBB, University of Basel), the study subjects gave written, informed consent and were paid CHF 50.00 for each office visit. Patients were recruited from the ambulatory care facilities (diabetology and cardiology) of the hospital. Randomisation was performed by a pharmacist using a computer program. He provided the randomisation codes and vials containing D3or 0.9% NaCl. A nurse not involved in the study administered the injections, either D3 (cholecalciferol, 300,000 IU, 1 ml intramuscularly, vitamin D3 Streuli Inc., Switzerland), or placebo (0.9% NaCl, 1 ml intramuscularly) in a blinded way. After 3 months, all patients received a blinded repeat injection which contained either 0.9% NaCl 0.5 ml (placebo arm or for D3replete patients in the D3 arm) or D3150,000 IU, 0.5 ml (only patients in the D3 arm when serum 25(OH)-D3 levels were below 80 nmol/l in the D3 arm and hypercalcaemia of any degree and hypercalciuria [≥8 mmol/24 hours] remained absent). An independent (nonstudy) physician evaluated the serum 25(OH)-D3 and calcium results and allocated D3/NaCl administration via the hospital pharmacist who had provided the randomisation code.
Men and nonpregnant women aged ≥18 years, with T2DM, living independently at home with stable blood glucose control for the past 2 months (less than 2 hypoglycaemic episodes in the past 2 months, unchanged doses of antihyperglycaemic agents in the last 3 months and stable glycosylated haemoglobin [HbA1c] levels for the past 6 months [variation by less than ±0.7%]). Blood pressure was to be stable below 145/85 mm Hg during the past 2 months under a fixed current regimen of blood pressure medications (if any) and/or potassium supplements (if any). Both diabetic and blood pressure therapies had to be judged as unlikely to require change in the subsequent 6 months by the referring diabetologist and cardiologist. It was prespecified that if changes in these medication regimens were needed during the study, these subjects would be regarded as drop-outs and not included into the analysis.
– Patients with type 1 diabetes mellitus (T1DM) or insulin-requiring diabetes of undetermined type
– Patients on haemodialysis, with hyperparathyroidism or active cancer disease
– Patients with known metabolic bone disease
– Laboratory evidence of kidney (estimated glomerular filtration rate <60 ml/min) or liver disease
– Dietary calcium intake exceeding 1,500 mg/d (estimated from diet history)
– 25(OH)-D3 levels at baseline ≥70 nmol/l
– Hypercalciuria (>8 mmol/24 hours, measured by means of 24-hour urine collections)
– Hypo- and hypercalcaemia and hypo- and hyperphosphatemia of any cause
– Drugs that affect D3 metabolism (e.g., antiepileptic drugs, calcimimetics, 1-34 PTH, bisphosphonates, calcitonin, D3 therapy over and above 400 IU orally daily) 6 months prior to enrolment and during the study
– History of binge eating or weight gain or loss exceeding 6 kg in past 18 months
– Patients taking any type of coagulation inhibitors (i.e., coumadin, heparin, etc.)
All biochemical analyses were performed in duplicate. All baseline measurements were done twice, 1 week apart and the baseline values reported are the means of these two measurements. Standard biochemical parameters in blood and 24-hour urine collections were determined by the hospital department of clinical chemistry using standard, state-of-the-art methodology as described in reference [22]. All subjects fasted overnight for 9 am blood draws. In insulin treated-patients, no insulin was administered after the final prescribed dose on the prior day. All oral medications were withheld until after the fasting blood draw. HbA1c was determined by means of high performance liquid chromatography (HPLC). Homeostasis model assessment insulin resistance (HOMA-IR) was calculated using the published HOMA formula [23]. The following endocrine analyses were made with enzyme-linked immunosorbent assays: insulin, proinsulin, C-peptide, intact PTH, C-terminal FGF-23, plasma renin activity and plasma aldosterone. 25(OH)-D3, 1,25(OH)2-D3 and tetrahydro-aldosterone (urine) were determined by means of HPLC. Twenty-four-hour blood pressure readings were recorded using Cardioline® equipment. The equipment was used by an experienced study nurse.
Randomisation was unstratified and unblocked. All analyses are based on the intention-to-treat population, comprising all randomised subjects. Intragroup comparisons (to own group baseline) and intergroup comparison (between the groups) were carried out using the paired t-test for biochemical data, and results are reported as arithmetic means and 95% confidence intervals. The Wilcoxon signed rank test was applied for the analysis of biochemical data that were not normally distributed (HbA1c and HOMA-IR) and results are reported as geometric means. The effect of treatment was evaluated by calculating the percentage change from baseline for all variables studied for all analysis, a two-tailed p-value <0.05 was considered to indicate statistical significance. For analysis of the potential for differing treatment effects in patients with and without insulin treatment, two-way analysis of variance was used. Statistical analysis was performed using SSPS for Windows NT, version 20.0 (SSPS Inc., Chicago, IL).
Change in HbA1c levels at 6 months.
Changes in HOMA-IR (calculated as described in reference [23]) at 3 and 6 months. Changes in calcium/phosphate metabolism, calci-/phosphotropic hormones. Changes in proinsulin levels, renin/aldosterone activity/concentration, 24-hour aldosterone excretion rate, 24-hour urinary albumin excretion, mean systolic and diastolic 24-hour blood pressure values, all at 3 and 6 months.
| Table 1: Baseline characteristics of the participants, according to the study groups (mean ± standard deviation). | |||
| Parameter | Vitamin D (D3) (n = 29) | Placebo (n = 26) | p-value |
| Age (y) | 66.9 ± 3.1 | 63.7 ± 3.5 | 0.367 |
| Gender | 10 M (34.5%), 19 F (65.5%) | 10 M (38.5%), 16 F (61.5%) | |
| BMI (kg/m²) | 28.9 ± 4.3 | 28.1 ± 3.8 | 0.169 |
| Current smokers | 4 (13.8%) | 4 (15.4%) | |
| Ex-smokers | 10 (34.5%) | 12 (38.5%) | |
| Alcohol, drinks per day | 0.7 ± 0.2 | 1.0 ± 0.3 | 0.124 |
| Mean SBP (mm Hg)/24h | 130.7 ± 14.7 | 136.3 ± 14.4 | 0.849 |
| Mean DBP (mm Hg)/24h | 82.3 ± 6.0 | 82.4 ± 11.3 | 0.912 |
| Duration of diabetes (years) | 12.7 ± 1.7 | 12.6 ± 1.9 | 0.764 |
| HbA1c (%) | 7.0 ± 1.1 | 7.2 ± 0.9 | 0.440 |
| Creatinine clearance (ml/min) | 101 ± 41 | 114 ± 46 | 0.321 |
| Urinary albumin excretion (mg/24h) | 200 ± 41 | 84 ± 21 | 0.045 |
| 25(OH)-D3 (nmol/l) | 36.0 ± 18.1 | 28.1 ± 14.4 | 0.612 |
| Antihyperglycaemic drugs | |||
| Metformin | 20 (77%) | 23 (79%) | 0.698 |
| Sulfonylureas | 10 (34%) | 4 (15%) | 0.047 |
| Pioglitazone | 6 (23%) | 4 (14%) | 0.401 |
| GLP-1 receptor signalling | 5 (17%) | 1 (4%) | 0.041 |
| Insulin | 12 (41%) | 17 (65%) | 0.249 |
| Statins | 17 (59%) | 15 (58%) | 0.812 |
| Antihypertensive drugs | |||
| Thiazides | 13 (45%) | 14 (54%) | 0.511 |
| Beta-blockers | 11 (38%) | 15 (58%) | 0.216 |
| ACE-inhibitors | 10 (35%) | 14 (54%) | 0.304 |
| AT-1 receptor antagonists | 10 (35%) | 14 (54%) | 0.231 |
| Calcium channel blockers | 8 (28%) | 5 (19%) | 0.412 |
| ACE = angiotensin converting enzyme; AT = angiotensin; BMI = body mass index; DBP = diastolic blood pressure; GLP-1 = glucagon-like peptide-1; HbA1c = glycosylated haemoglobin; SBP = systolic blood pressure | |||
A total of 142 patients with T2DM were recruited between October and December 2009, 77 were screened and 55 fulfilled the entry criteria, consented and were enrolled into the study (n = 29 to D3, n = 26 to the placebo group, (fig. 1). Baseline characteristics of the study subjects are summarised in table 1. There were no significant differences between the two treatment groups at baseline (table 1, p-values). All of the 55 study participants completed the study (fig. 1) and there was no change in either antihyperglycaemic drugs (insulin requirements) nor in the number and dose of antihypertensive drugs.
Figure 1
Study flowchart
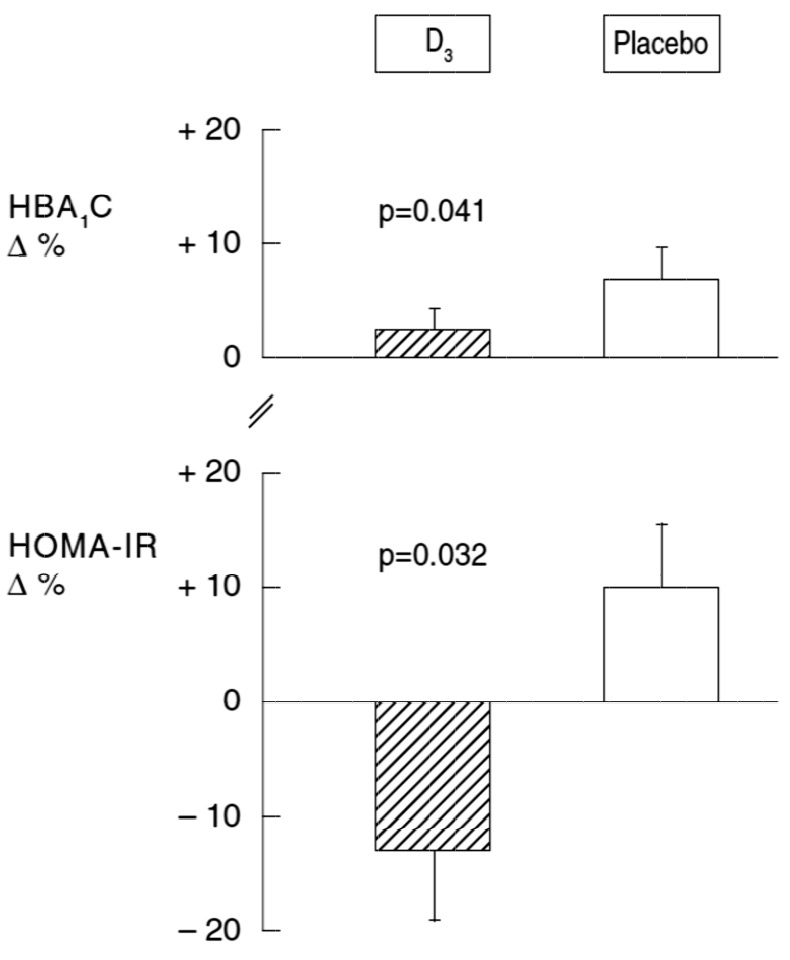
Figure 2
Effect of D3supplementation on the percent changes in HbA1c and HOMA-IR.
HbA1c = glycosylated haemoglobin; HOMA-IR = homeostasis model assessment insulin resistance
In both groups and without change in the antihyperglycaemic medication regimen, HbA1c increased nonsignificantly when compared to baseline (table 2). However, HbA1c increased significantly less in patients treated with D3than in the placebo group (mean ± standard deviation +2.9% ± 1.5% vs +6.9% ± 2.1%, p = 0.041, table 2, fig. 2). There was also a significant treatment effect on HOMA-IR (table 2 and fig. 2): whereas HOMA-IR decreased by -12.8% ± 5.6% in the D3 group, it increased by +10% ± 5.4% in the placebo group (p = 0.032). There was no significant difference in the serum levels of high-sensitivity C-reactive protein (hsCRP) as a marker of systemic inflammation (table 2) for both the intra- and intergroup comparisons. We found no statistically significant interaction of D3 treatment effect on insulin treatment.
Administration of D3 significantly suppressed intact PTH (table 3), had no effect on plasma ionised calcium and phosphate concentrations (table 4), but significantly increased calciuria in intra- and intergroup comparisons at 3 and 6 months (table 5). In the placebo group, intact PTH was suppressed significantly at 6 months without significant changes in plasma and urinary calcium and phosphate concentrations and 24-hour excretion rates. Serum 1,25(OH)2-D3 increased significantly in response to D3, as did fibroblast growth factor 23 (FGF-23), an osteocyte/osteoblast-derived phosphaturic hormone, when compared with baseline values in the D3, but not in the placebo group (table 3). D3 supplementation significantly increased serum 25(OH)-D3 levels in comparison with baseline and in comparison with placebo (table 3). Eleven of the 29 subjects in the D3 group needed a second injection of 150,000 IU D3 after 3 months. The placebo group also exhibited a significant intragroup increase in the serum 25(OH)-D3 concentration from 28 to 62 nmol/l, probably owing to increased sun exposure in the second part of the study. The serum 25(OH)-D3 concentrations correlated positively and significantly with the later termination of the study in the spring/summer months (data not shown).
Twenty-four-hour urinary albumin excretion decreased in the D3 group from 200 ± 41 mg to 126 ± 39 mg, p = 0.021, table 5). There was no significant change in plasma active renin and aldosterone concentrations and in the 24-hour excretion rates of the tetrahydro metabolite of aldosterone (table 6).
Twenty-four-hour ambulatory systolic and diastolic blood pressures decreased significantly within both groups with no significant intergroup difference (table 7).
One patient in the placebo group developed a small abscess at the injection site (after the 3-month injection), which healed without antibiotics or surgical intervention. No other side effects were reported.
| Table 2: Effect of vitamin D (D3) supplementation on HBA1c, HOMA-IR, and hsCRP (mean ± standard deviation, 95% confidence interval). | |||||||||
| Diabetes parameters and hsCRP(fasting) | D3 (n = 29) | Placebo (n = 26) | Treatment difference | ||||||
| Baseline | 3 months | 6 months | Change (%) | Baseline | 3 months | 6 months | Change (%) | p-value | |
| Proinsulin (pmol/l) | 31.0 ± 29.4 (19.8 to 42.2) | 33.4 ± 25.6 (23.7 to 43.1) | 32.6 ± 18.9 (25.4 to 39.8) | +5.1 ± 3.9 (+3.6 to 6.6) | 49.4 ± 34.8 (35.3 to 63.5) | 55.5 ± 31.9 (42.6 to 68.4) | 63.8 ± 34.2 (50.0 to 77.6) | +14.1 ± 6.7 (+11.4 to 16.8) | 0.342 |
| C-peptide (nmol/l) | 1.2 ± 0.8 (0.9 to 1.5) | 1.1 ± 0.7 (0.8 to 1.4) | 1.2 ± 0.9 (0.9 to 1.5) | 0.0 ± 2.3 (–0.9 to 0.9) | 0.9 ± 0.8 (0.6 to 1.2) | 1.2 ± 0.9 (0.6 to 1.2) | 1.1 ± 0.7 (0.8 to 1.4) | +22.0 ± 14 (+16.3 to 27.7) | 0.045 |
| Insulin (mU/l) | 12.4 ± 9.1 (8.9 to 15.9) | 12.5 ± 8.4 (9.3 to 15.7) | 11.1 ± 7.6 (8.2 to 14.0) | –11.7 ± 9.6 (–15.4 to 8.1) | 11.4 ± 8.9 (7.8 to 15.0) | 12.3 ± 7.4 (9.3 to 15.3) | 11.4 ± 7.9 (8.2 to 14.6) | 0.0 ± 4.1 (–1.7 to 1.7) | 0.341 |
| Glucose (mmol/l) | 7.8 ± 2.3 (6.9 to 8.7) | 7.4 ± 2.4 (6.5 to 8.3) | 8.1 ± 2.5 (7.1 to 9.1) | +3.7 ± 4.1 (+2.1 to 5.3) | 7.9 ± 2.3 (7.0 to 8.8) | 7.7 ± 2.5 (6.7 to 8.7) | 8.5 ± 2.6 (7.5 to 9.6) | +7.6 ± 4.7 (+5.7 to 9.5) | 0.422 |
| HBA1c (%) | 7.0 ± 1.1 (6.6 to 7.4) | 7.0 ± 1.0 (6.6 to 7.4) | 7.2 ± 1.1 (6.8 to 7.6) | +2.9 ± 1.5 (+2.3 to 3.5) | 7.2 ± 0.9 (6.8 to 7.6) | 7.4 ± 1.0 (7.0 to 7.8) | 7.7 ± 0.9 (7.3 to 8.1) | +6.9 ± 2.1 (+6.1 to 7.7) | 0.041 |
| HOMA-IR | 4.4 ± 2.4 (3.5 to 5.3) | 4.1 ± 2.1 (3.3 to 4.9) | 3.9 ± 2.2 (3.1 to 4.7) | –12.8 ± 5.6 (–14.9 to 10.7) | 4.0 ± 2.3 (3.1 to 4.9) | 4.3 ± 2.1 (3.5 to 5.2) | 4.4 ± 2.5 (3.5 to 5.3) | +10 ± 5.4 (+7.8 to12.2) | 0.032 |
| hsCRP (mg/l) | 1.2 ± 3.1 (0.02 to 2.4) | 1.4 ± 2.0 (0.6 to 2.2) | 1.5 ± 2.0 (0.7 to 2.3) | +25.1±13.2 (+20.1 to 30.1) | 1.5 ± 2.7 (0.4 to 2.6) | 1.8 ± 5.4 (–0.4 to 4.0) | 1.7 ± 2.0 (0.9 to 2.5) | +13.3 ± 10.1 (+9.2 to 17.4) | 0.612 |
| HBA1c = glycosylated haemoglobin; HOMA-IR = homeostasis model assessment insulin resistance; hsCRP = high-sensitivity C-reactive protein | |||||||||
| Table 3: Effect of vitamin D (D3) supplementation on calci-/phosphotropic hormones (mean ± standard deviation, 95% confidence interval). | |||||||||
| Calci-/phosphotropic hormones | D3 (n = 29) | Placebo (n = 26) | Treatment difference | ||||||
| Baseline | 3 months | 6 months | Change (%) | Baseline | 3 months | 6 months | Change (%) | p-value | |
| 25(OH)-D3 (nmol/l) | 36.0 ± 18.1 (29.1 to 42.9) | 78.9 ±17.5*“ (72.2 to 85.6) | 84.9 ±16.0* (78.8 to 91.0) | +136 ± 17 (+131 to 144) | 28.1 ± 17.4 (21.1 to 35.1) | 39.9 ± 18.9 (32.3 to 47.5) | 61.7 ± 16.0* (55.2 to 68.2) | +119 ± 21 (+111 to 128) | 0.011 |
| 1,25(OH)-D3 (nmol/l) | 50 ± 7 (47.3 to 52.7) | n.d. | 57 ± 8* # (54.0 to 60.1) | +14 ± 4 (+13 to 16) | 50 ± 9 (46.4 to 53.6) | n.d. | 50 ± 8 (46.8 to 53.2) | 0 ± 5 (–2 to –2) | 0.009 |
| Intact PTH (pmol/l) | 5.6 ± 2.5 (4.7 to 6.6) | 4.7 ± 2.1* (3.9 to 5.5) | 4.0 ± 2.2* (3.2 to 4.8) | –29 ± 13 (–34 to –24) | 5.5 ± 2.3 (4.6 to 6.4) | 5.2 ± 1.9 (4.4 to 6.0) | 3.9 ± 1.5 (3.3 to 4.5) | –30 ± 14 (–36 to –24) | 0.127 |
| FGF-23 (pg/ml) | 38.5 ± 19.3 (31.2 to 45.9) | 44.4 ± 18.0* (37.6 to 51.3) | 48.8 ± 18.2* (41.9 to 55.7) | +27 ± 11 (+23 to 31) | 40.0 ± 20.9 (31.6 to 48.4) | 36.5 ± 18.2 (29.1 to 43.9) | 45.2 ± 19.8 (37.2 to 53.2) | +13 ± 11 (9 to 17) | 0.022 |
| FGF-23 = fibroblast growth factor 23; n.d. = not done; PTH = parathyroid hormone * p <0.05 for intragroup comparison (with own group baseline); # p <0.05 for intergroup comparison (between the groups) | |||||||||
| Table 4: Effect of vitamin D (D3) supplementation on plasma electrolytes, urea and creatinine (mean ± standard deviation, 95% confidence interval). | ||||||
| Parameter | D3 (n = 29) | Placebo (n = 26) | ||||
| Baseline | 3 months | 6 months | Baseline | 3 months | 6 months | |
| Na+ (mmol/l) | 139 ± 2 (138 to 140) | 138 ± 2 (137 to 139) | 138 ± 3 (137 to 139) | 139 ± 3 (138 to 140) | 138 ± 2 (137 to 139) | 139 ± 3 (138 to 140) |
| K+ (mmol/l) | 3.8 ± 0.4 (3.7 to 4.0) | 3.8 ± 0.5 (3.6 to 4.0) | 3.8 ± 0.4 (3.7 to 4.0) | 3.8 ± 0.3 (3.7 to 3.9) | 3.8 ± 0.5 (3.6 to 4.0) | 3.8 ± 0.4 (3.6 to 4.0) |
| Cl- (mmol/l) | 103 ± 3 (102 to 104) | 103 ± 2 (102 to 104) | 103 ± 3 (102 to 104) | 104 ± 4 (102 to 106) | 104 ± 2 (103 to 105) | 104 ± 3 (103 to 105) |
| Ion. Ca++ (mmol/l) | 1.21 ± 0.05 (1.19 to 1.23) | 1.24 ± 0.04 (1.23 to 1.26) | 1.22 ± 0.04 (1.21 to 1.24) | 1.25 ± 0.05 (1.23 to 1.27) | 1.23 ± 0.05 (1.21 to 1.25) | 1.18 ± 0.05 (1.16 to 1.20) |
| PO4 (mmol/l) | 1.08 ± 0.12 (1.03 to 1.13) | 1.11 ± 0.14 (1.06 to 1.16) | 1.14 ± 0.15 (1.08 to 1.20) | 1.14 ± 0.13 (1.09 to 1.19) | 1.07 ± 0.14 (1.01 to 1.13) | 1.14 ± 0.12 (1.09 to 1.19) |
| Urea (mmol/l) | 6.8 ± 2.5 (5.9 to 7.8) | 6.9 ± 2.1 (6.1 to 7.7) | 7.5 ± 2.6 (6.5 to 8.5) | 6.8 ± 2.8 (5.7 to 7.9) | 7.0 ± 2.5 (6.0 to 8.0) | 6.4 ± 2.7 (5.3 to 7.5) |
| Creatinine (μmol/l) | 72.3 ± 34.6 (59.5 to 85.5) | 75.4 ± 38.9 (60.6 to 90.0) | 78.2 ± 35.6 (64.7 to 91.8) | 68.8 ± 33.8 (55.1 to 82.5) | 69.2 ± 31.9 (56.3 to 82.1) | 72.6 ± 30.9 (60.1 to 85.1) |
| Table 5: Effect of vitamin D (D3) supplementation on 24-hour urinary electrolytes and albumin excretion rates (mean ± standard deviation, 95% confidence interval). | ||||||
| Parameter | D3 (n = 29) | Placebo (n = 26) | ||||
| Baseline | 3 months | 6 months | Baseline | 3 months | 6 months | |
| Na+ (mmol/24h) | 206 ± 34 (193 to 219) | 170 ± 39 (155 to 185) | 191 ± 31 (179 to 203) | 177 ± 36 (163 to 192) | 172 ± 33 (159 to 185) | 184 ± 35 (170 to 198) |
| K+ (mmol/24h) | 73 ± 14 (68 to 78) | 76 ± 17 (70 to 83) | 96 ± 20 (88 to 104) | 63 ± 17 (56 to 70) | 68 ± 19 (60 to 76) | 75 ± 20 (67 to 83) |
| Cl- (mmol/24h) | 199 ± 29 (188 to 210) | 179 ± 27 (169 to 189) | 189 ± 31 (177 to 201) | 175 ± 29 (163 to 187) | 173 ± 32 (160 to 186) | 187 ± 27 (176 to 198) |
| Ca++ (mmol/24h) | 3.8 ± 1.1 (3.4 to 4.2) | 5.1 ± 1.3*# (4.6 to 5.6) | 5.5 ± 1.0*# (5.1 to 5.9) | 3.3 ± 0.9 (2.9 to 3.7) | 3.0 ± 1.2 (2.5 to 3.5) | 4.3 ±1.3 (3.8 to 4.8) |
| PO4 (mmol/24h) | 28 ± 5 (26 to 30) | 31 ± 6 (29 to 33) | 29 ± 5 (27 to 31) | 27 ± 6 (25 to 29) | 27 ± 7 (24 to 30) | 27 ± 5 (25 to 29) |
| Albumin (mg/24h) | 200 ± 41# (184 to 216) | 143 ± 37# (129 to 157) | 126 ± 39*# (111 to 141) | 84 ± 21 (76 to 93) | 66 ± 27 (55 to 77) | 55 ± 24 (45 to 65) |
| * p <0.05 for intragroup comparison, # p <0.05 for intergroup comparison (between the groups) | ||||||
| Table 6: Effect of vitamin D (D3) supplementation on renin/aldosterone (mean ± standard deviation, 95% confidence interval). | |||||||||
| Renin/aldosterone | D3 (n = 29) | Placebo (n = 26) | Treatment difference | ||||||
| Baseline | 3 months | 6 months | Change (%) | Baseline | 3 months | 6 months | Change (%) | p-value | |
| Active plasma renin (mU/l) | 12.8 ± 3.1 (11.6 to 14.0) | 13.8 ± 2.6 (12.8 to 14.8) | 14.0 ± 3.9 (12.6 to 15.5) | +9.4 ± 5.4 (+7.3 to 11.5) | 13.1 ± 4.1 (11.4 to 14.8) | 12.4 ± 3.4 (11.0 to 13.8) | 13.6 ± 3.8 (12.1 to 15.1) | +3.8 ± 4.7 (+1.9 to 5.7) | 0.451 |
| Plasma aldosterone (nmol/l) | 0.48 ± 0.19 (0.41 to 0.55) | 0.44 ± 0.17 (0.38 to 0.51) | 0.46 ± 0.16 (0.40 to 0.52) | –4.2 ± 4.2 (–5.8 to –2.6) | 0.45 ± 0.15 (0.39 to 0.51) | 0.44 ± 0.14 (0.38 to 0.50) | 0.41 ± 0.17 (0.34 to 0.48) | –9.9 ± 6.9 (–12.7 to –7.1) | 0.721 |
| Tetrahydro-aldosterone (μg/24h) | 55 ± 10 (51 to 59) | 61 ± 11 (57 to 65) | 53 ± 9 (50 to 56) | –3.7 ± 7.6 (–6.6 to –0.8) | 52 ± 11 (48 to 56) | 47 ± 10 (43 to 51) | 44 ± 11 (40 to 48) | –15.4 ± 11.2 (–20 to –11) | 0.537 |
| Table 7: Effect of vitamin D (D3) supplementation on 24 hour ambulatory blood pressure (mean ± standard deviation, 95% confidence interval). | ||||||
| Parameter | D3 (n = 29) | Placebo (n = 26) | ||||
| Baseline | 3 months | 6 months | Baseline | 3 months | 6 months | |
| Mean systolic BP (mm Hg) | 131 ± 3 (130 to 132) | 129 ± 3* (128 to 130) | 127 ± 3* (126 to 128) | 135 ± 3 (134 to 136) | 133 ± 3 (132 to 134) | 128 ± 2* (127 to 129) |
| Mean diastolic BP (mm Hg) | 83 ± 2 (82 to 84) | 76 ± 3* (75 to 77) | 80 ± 2* (79 to 81) | 82 ± 3 (81 to 83) | 83 ± 3 (82 to 84) | 80 ± 3* (79 to 81) |
| BP = blood pressure * p <0.05 for the intragroup comparison (with own baseline), intergroup comparisons yielded no significant difference | ||||||
This study examined a population of slightly D3 deficient (defined as <50 nmol/l [24]), metabolically stable, long-standing (>10 years) T2DM patients with adequate baseline blood pressure and acceptable glycaemic control (HbA1c 7.1% ± 1.0%, table 1). The main findings were: first, HbA1c showed a differential course during treatment with D3, with a significantly smaller increase in the treatment group compared with placebo. Second, markers of insulin resistance were significantly reduced in individuals treated with D3 compared with placebo.
HOMA-IR has been shown to correlate closely with analysis of insulin sensitivity by the euglycaemic insulin clamp method [25]. Based on this calculation, D3 administration ameliorated insulin resistance and significantly limited the rise in HbA1c as compared to placebo during this 6-month intervention trial. The amelioration of insulin resistance could theoretically be indirect via the reported anti-inflammatory effects of D3 [26], but this thesis was not supported by changes in hsCRP levels. However, both groups exhibited normal baseline hsCRP values, suggesting that systemic inflammatory activity was low and rendering demonstration of a putative inhibitory effect more difficult. Other studies examining the effects of D3 in patients at risk for diabetes or normal subjects have failed to demonstrate a significant effect of the intervention on insulin sensitivity [9–11]. Thus, the effect of D3 may be limited to establish T2DM and may depend on the degree of insulin resistance.
It had been planned to enrol all patients between October and November to limit the contribution of skin synthesis of D3 (the recruited subjects all live ~47o N latitude). However, as a result of patient factors (holidays, professional engagements, etc.) enrolment could be completed only at the end of December. The last subjects completed the protocol in July 2010, thereby natural sun exposure increased D3in both groups. The effect of D3 administration may have been mitigated by the fact that the placebo group exhibited a “spontaneous” increase in 25(OH)-D3 levels most probably owing to increased sun exposure in the spring and early summer. A small but significant reduction of C-peptide levels was noted in the D3 arm relative to placebo. This finding is consistent with the observed tendency to a relative reduction of fasting glucose levels in the D3 arm and may thus reflect a secondary consequence of improved insulin sensitivity.
Previously, 1,25(OH)2-D3 has been shown to inhibit renin gene transcription and vitamin D receptor knockout mice demonstrate hypertension [27, 28]. However, this study in T2DM with well-controlled blood pressure did not show evidence for a detectable inhibitory effect of D3 on the activity of the renin/aldosterone system on the basis of the analysis of plasma renin, plasma aldosterone and 24-hour urinary excretion rates of tetrahydro-aldosterone. Also, there was no intergroup treatment difference in the 24-hour ambulatory systolic and diastolic blood pressure measurements.
The observation of a significant decrease in urinary albumin excretion in the D3 group is of interest in view of the association of low D3 status with albuminuria [29] and is confirmatory evidence for the possible retarding effect of D3agonists on progression of glomerular injury [30].
Our study cannot conclusively answer the question as to whether the observed effects of D3administration are due to changes in 25(OH)-D3 or 1,25(OH)2-D3, although the increase in 1,25(OH)2-D3was limited to the intervention group. The increase in 1,25(OH)2-D3and the decrease in intact PTH are responsible – at least in part – for the significant increase in FGF-23. However, the role of higher circulating levels of 25(OH)-D3also requires consideration as osteoblasts exposed to 25(OH)-D3 have been shown to produce 1,25(OH)2-D3 locally in a paracrine/autocrine fashion and, thereby, to increase the synthesis of FGF-23 [31].
The D3-induced rise in FGF-23 in this study might be viewed adversely since injection of pharmacological amounts of murine FGF-23 into myocardium induced left ventricular hypertrophy in mice [32], and elevated FGF-23 levels have been reported to be independently associated with total mortality in a prospective patient cohort with incident end-stage renal disease [33, 34]. The role of FGF-23 in the incidence of coronary heart disease (CHD) in the general population is unclear. However, there is substantial reason to consider that incident CHD is not dependent on FGF-23 levels in the general population. In a prospective, nested, case-control cohort study, from the 51,529-subject Health Professionals Follow-up Study, within the subset with no history of CHD (mean serum creatinine 1.0 mg/dl) no association was found between baseline FGF-23 levels and subsequent nonfatal myocardial infarction and fatal CHD events [35]. Nevertheless, other epidemiological data have shown that FGF-23 concentration is a risk factor for increased all-cause and cardiovascular mortality in Swedish community dwelling adults [36].
Interestingly, it has been demonstrated that insulin-resistant T2DM patients exhibit an impaired FGF-23 and PTH response to an acute phosphate load, sufficient to result in a supernormal hyperphosphataemic response [37]. Higher postprandial serum phosphate in T2DM might account, at least in part, for the systemic vascular calcification observed in this disorder and its status as a cardiovascular risk factor, as a function of duration of diabetes [38], and thus it is possible that higher FGF-23 levels might mitigate diabetic vascular disease, at least in subjects without chronic kidney disease. Since FGF-23 is produced in osteoblasts and osteocytes, and osteocyte density is reduced in experimental diabetes [39], it has been suggested that T2DM may be a state of relative FGF-23 hyporesponsiveness [37]. In fact, osteoblast-specific deletion of the insulin receptor in mice results in a phenotype of systemic insulin resistance and obesity that is mediated in part by osteoblastic endocrine dysfunction characterised by diminished secretion of under-carboxylated osteocalcin [40]. The findings that D3 induced increases in FGF-23 levels in T2DM, as previously reported in non-diabetics [41], and that D3 can improve the course of HBA1c and insulin sensitivity of peripheral tissues (HOMA-IR), raises the possibility that D3 therapy in T2DM, in addition to improving insulin sensitivity for glucose homeostasis in muscle cells and hepatocytes, might also result in increased FGF-23 levels via a similar insulin-sensitising action in osteocytes/osteoblasts.
The strengths of the present study are the placebo-controlled, prospective study design and the fact that no potentially confounding concomitant medication changes were made during the observation period. The chief limitation of this study is the relatively small number of participants and single centre location. In addition, the “spontaneous” rise in 25(OH)-D3 levels in the control population may have narrowed the differences and we cannot assume that the effects are dependent on different D3 doses. Also, we cannot exclude an additional effect of clandestine use of D3 in the placebo group as a result of the subjects’ interest in the study hypothesis.
Our results encourage the design and conduct of studies that further explore the roles of D3 and D3 analogues on glycaemic control in T2DM patients. Future studies should – among many other points – establish the dose-response characteristics, examine the best analogue of D3 with regard to the benefit/harm ratio and evaluate the effects in larger study populations and over longer time periods. In view of our study results, the effects of D3 on beta-cell function and insulin secretion merit special attention. In addition, the relevance of increased FGF-23 on cardiovascular morbidity should be evaluated in diabetes.
In summary and conclusion, D3 improved insulin sensitivity (based on HOMA-IR) and affected the course of HbA1c positively compared to placebo in patients with T2DM, but did not weaken, and was well tolerated.
Acknowledgement: The authors thank the team of the metabolic research unit of the Medizinische Universitätsklinik, Kantonsspital Bruderholz, University of Basel, for their empathic patient care and superb technical assistance. They are also thankful to the hospital pharmacy for help in blinding and to Dr. J. Muser, Ph. D., for help in the laboratory analysis.
1 Baz-Hecht M, Goldfine AB. The impact of vitamin D deficiency on diabetes and cardiovascular risk. Curr Opin Endocrinol Diabetes Obes. 2010;17:113–9.
2 Pittas AG, Lau J, Hu FB, Dawson-Hughes B. The role of vitamin D and calcium in type 2 diabetes: a systematic review and meta-analysis. J Clin Endocrinol Metab. 2007;92:2017–29.
3 Chiu KC, Chu A, Go VL, Saad MF. Hypovitaminosis D is associated with insulin resistance and beta cell dysfunction. Am J Clin Nutr. 2004;79(5):820–5.
4 Norman AW, Frankel JB, Heldt AM, Grodsky GM. Vitamin D deficiency inhibits pancreatic secretion of insulin. Science. 2 1980;09(4458):823–5.
5 Alvarez JA, Ashraf A. 2010 Role of vitamin D in insulin secretion and insulin sensitivity for glucose homeostasis. Int J Endocrinol. 2010;351–85.
6 Tai K, Need AG, Horowitz M, Chapman IM. Vitamin D, glucose, and insulin sensitivity. Nutrition. 2008;24:279–85.
7 Boer IH, Tinker LF, Connelly S, Curb JD, et al. Calcium plus vitamin D supplementation and the risk of incident diabetes in the women’ s health initiative. Diabetes Care. 2008;31:701–7.
8 Grimnes G, Figenschau Y, Almas B, Jorde R. Vitamin D, insulin secretion, sensitivity and lipids, Diabetes. 2011;60:2748–57.
9 Pittas AG, Harris SS, Stark PC, Dawson-Hughes B. The effects of calcium and vitamin D supplementation on blood glucose and markers of inflammation in nondiabetic adults. Diabetes Care. 2007;30(4):980–6.
10 Tai K, Need AG, Horowitz, Chapman IM. Glucose tolerance and vitamin D: Effects of treating vitamin D deficiency. Nutrition. 2008;24:950–6.
11 Mitri J, Dawson-Hughes B, Hu FB, Pittas A. Effects of vitamin D and calcium supplementation on pancreatic beta cell function, insulin sensitivity, and glycemia in adults at high risk of diabetes. Am J Clin Nutr. 2011;94:486–94.
12 Orwoll E, Riddle M, Prince M. Effects of vitamin D on insulin and glucagon secretion in non-insulin-dependent diabetes mellitus. Am J Clin Nutr. 1994;59(5):1083–7.
13 Eftekhari MH, Akbarzadeh M, Dabbaghmanesh MH, Hasanzadeh J. Impact of treatment with oral calcitriol on glucose indices in type 2 diabetes mellitus patients. Asia Pac J Clin Nutr. 2011;20(4):521–6.
14 Shab-Bidar S, Neyestani TR, Djazayery A, Eshraghian MR, Houshiarrad A, Gharavi A, et al. Regular consumption of vitamin D-fortified yogurt drink (Doogh) improved endothelial biomarkers in subjects with type 2 diabetes: a randomized double-blind clinical trial. BMC Med. 2011;9:125–31.
15 Shab-Bidar S, Neyestani TR, Djazayery A, Eshraghian MR, Houshiarrad A, Kalayi A, et al. Improvement of vitamin D status resulted in amelioration of biomarkers of systemic inflammation in the subjects with type 2 diabetes. Diabetes Metab Res Rev. 2012;28(5):424–30.
16 Neyestani TR, Nikooyeh B, Alavi-Majd H, Shariatzadeh N, Kalayi A, Tayebinejad N, et al. Improvement of vitamin D status via daily intake of fortified yogurt drink either with or without extra calcium ameliorates systemic inflammatory biomarkers, including adipokines, in the subjects with type 2 diabetes. J Clin Endocrinol Metab. 9 2012;7(6):2005–11.
17 Nikooyeh B, Neyestani TR, Farvid M, Alavi-Majd H, Houshiarrad A, Kalayi A, et al. Daily consumption of vitamin D- or vitamin D + calcium-fortified yogurt drink improved glycemic control in patients with type 2 diabetes: a randomized clinical trial. Am J Clin Nutr. 2011;93(4):764–71.
18 Borissova AM, Tankova T, Kirilov G, Dakovska L, Kovacheva R. The effect of vitamin D3 on insulin secretion and peripheral insulin sensitivity in type 2 diabetic patients. Int J Clin Pract. 2003;57(4):258–61.
19 Jorde R, Figenschau Y. Supplementation with cholecalciferol does not improve glycaemic control in diabetic subjects with normal serum 25–hydroxyvitamin D levels. Eur J Nutr. 2009;48(6):349–54.
20 Parekh D, Sarathi V, Shivane VK, Bandgar TR, Menon PS, Shah NS. Pilot study to evaluate the effect of short-term improvement in vitamin D status on glucose tolerance in patients with type 2 diabetes mellitus. Endocr Pract. 2010;16(4):600–8.
21 George PS, Pearson ER, Witham MD. Effect of vitamin D supplementation on glycaemic control and insulin resistance: a systematic review and meta-analysis. Diabet Med. 2012;29(8):e142–50.
22 Krapf R, Beeler I, Hertner D, Hulter NH. Chronic respiratory alkalosis. N Engl J Med. 1991;324:1394–401.
23 Matthews DR, Hosker JP, Rudenski AS, Naylor BA, Treacher DF, Turner RC. Homeostasis model assessment: insulin resistance and beta-cell function from fasting plasma glucose and insulin concentrations in man. Diabetologia. 1985;28(7):412–9.
24 Holick MF. Vitamin D deficiency. N Engl J Med. 2007:357:266–81.
25 Wallace TM, Levy JC, Matthwes DR. Use and Abuse of HOMA modeling. Diabetes Care. 2004;27:1487–95.
26 Adorini L. Regulation of immune responses by vitamin D receptor ligands, in “Vitamin D”, 2nd edition, Elsevier, 2008, Feldman D, Pike JW, Glorieux FH, eds, pp 631–48.
27 Li YC, Kong J, Wie M, Chen ZF, Liu SQ, Cao LP. 1,25 dihydroxy vitamin D is a negative regulator of the renin-angiotensin system. J Clin Invest. 2002;110:229–38.
28 Li YC. Vitamin D and the Renin-Angiotensin System, in “Vitamin D” 2nd edition, Elsevier, 2005, Feldman D, Pike YW, Glorieux FH, eds, pp 871–72.
29 Fiscella KA, Winters PC, Ogedegbe G. Vitamin D and racial disparity in albuminuria: NHANES 2001–2006. Am J Hypertens. 2011;24:1114–20.
30 de Zeeuw D, Agarwal R, Amdahl M, Audhya P, Coyne D, Garimella T, et al. Selective vitamin D receptor activation with paricalcitol for reduction of albuminuria in patients with type 2 diabetes (VITAL study): a randomised controlled trial. Lancet. 2010;376:1543–51.
31 Tang WJ, Wang LF, Xu XY, Zhou Y, Jin WF, Wang HF, Gao J. Autocrine/paracrine action of vitamin D on FGF-23 expression in cultured rat osteoblasts Calcified Tissue Int. 2010;86:404–10.
32 Faul C, Maaral AP, Oskouei B, H MC et al. FGF-23 induces left ventricular hypertrophy. J Clin Invest. 2011;121:4393–408.
33 Gutiérrez OM, Mannstadt M, Isakova T, Rauh-Hain JA, Tamez H, Shah A, et al. Fibroblast growth factor 23 and mortality among patients undergoing hemodialysis. N Engl J Med. 2008;359(6):584–92.
34 Parker BD, Schurgers LJ, Brandenburg VM, Christenson RH, Vermeer C, Ketteler M, et al. The associations of fibroblast growth factor 23 and uncarboxylated matrix Gla protein with mortality in coronary artery disease: the Heart and Soul Study. Ann Intern Med. 2010;152(10):640–8.
35 Taylor EN, Rimm EB, Stampfer MJ, Curhan GC. Plasma fibroblast growth factor 23, parathyroid hormone, phosphorus, and risk of coronary heart disease. Am Heart J. 2011;161:956–62.
36 Arnlov J, Carlsson AC, Sundström J, Ingelsson E, Larsson A, Lind L, Larsson TE. Higher fibroblast growth factor-23 increases the risk of all-cause and cardiovascular mortality in the community. Kidney Int. 2013;83:160–6.
37 Yoda K, Imanishi Y, Yoda M, Mishima T, Ichii M, Yamada S, et al. Impaired response of FGF-23 to oral phosphate in patients with type 2 diabetes: a possible mechanism of atherosclerosis J Clin Endocrinol Metab. 2012;97(11):E2036–43.
38 Reaven PD, Sacks J, Investigators for the VADT. Coronary artery and abdominal aortic calcification are associated with cardiovascular disease in type 2 diabetes. Diabetologica. 2005;48:379–85.
39 Villarino ME, Sánchez LM, Bozal CB, Ubios AM. Influence of short-term diabetes on osteocytic lacunae of alveolar bone. A histomorphometric study. Acta Odontol Latinoam. 2006;19(1):23–8.
40 Fulzele K, Riddle RC, DiGirolamo DJ, Cao X, Wan C, Chen D, et al. Insulin receptor signaling in osteoblasts regulates postnatal bone acquisition and body composition. Cell. 2010;142(2):309–19.
41 Burnett-Bowie SA, Leder BZ, Henao MP, Baldwin CM, Hayden DL, Finkelstein JS. Randomized trial assessing the effects of ergocalciferol administration on circulating FGF-23. Clin J Am Soc Nephrol. 2012;7:624–31.
Funding / potential competing interests: The study was supported by NCCR Kidney Homeostasis, module “minerals/acid-base” and co-funded by institutional resources and from private honoraria to R.K. The authors declare that there is no conflict of interest that could be perceived as prejudicing the impartiality if the reported research.
Authors’ contribution: Sigrid Jehle examined and followed the patients, calculated/analysed the data, co-interpreted them and co-wrote the manuscript. Alessia Lardi examined and followed the patients and calculated/analysed the data. Barbara Felix referred the patients for screening for this study. Henry N. Hulter designed the protocol with the corresponding author (RK), co-analysed and co-interpreted the data and co-wrote the manuscript. Christoph Stettler analysed the data and advised in interpreting them and made contributions to contents of the manuscript. Reto Krapf designed the protocol, supervised the study and data acquisition, analysed and interpreted the data and co-wrote the manuscript.