Figure 1
DOI: https://doi.org/10.4414/smw.2014.13880
Abbreviations
BD: bipolar disorder
COX-II: cyclooxygenase II
ECT: electroconvulsive therapy
hsCRP: high-sensitivity C-reactive protein
IL: Interleukin
sIL-2R: soluble interleukin-2 receptor
MDD: major depressive disorder
TNF-α: tumour necrosis factor α
NYHA: New York Heart Association
df: degrees of freedom
NSAIDs: nonsteroidal anti-inflammatory drugs
ADR: adverse drug reaction
LOCF: last observation carried forward
Bipolar disorder (BD) is considered to be a chronic, serious, and debilitating mental disorder [1, 2]. Although there is a discrepancy in the estimated reports of life-time prevalence of bipolar disorder, the number has been proposed to be between 1.3% to more than 5%, depending on whether or not BD-I, BD-II or the combination of these two disorders were considered [3]. The immune system has been recently receiving a lot of attention in the pathophysiology of psychiatric disorders [4, 5].
Activation of inflammatory cytokines [4, 6] as well as increased plasma levels of interleukin (IL) 1β, IL-6, C-reactive protein (CRP) and tumour necrosis factor-α (TNF-α), have been reported in BD patients [7]. In particular, increased levels of plasma soluble interleukin-2 receptor (sIL-2R) [5], IL-2, IL-4 [8], IL-6 [8, 9], CRP [10], IL-8 [11] and TNF-α [9, 11] have been proposed in manic patients. Besides, significantly higher levels of IL-8 and TNF-α have been shown in bipolar depressed patients when compared to the healthy subjects [11].
Patients suffering from BD seem to have much less long-term symptomatic and cognitive recovery than previously thought [12]. Although there are several treatment options for BD, a considerable number of patients do not respond satisfactorily to any treatment [13]. Even though medications are generally considered the first-line treatment option for acute bipolar depression [14] and mania [15], electroconvulsive therapy (ECT) is also utilised frequently for the management of these disorders [13].
The role of ECT in the treatment of different phases of depression, mania and mixed episodes has been evaluated in various studies. In a study by Medda et al. [16], ECT produced a considerable improvement in patients with resistant unipolar, bipolar I and bipolar II depression. In a systematic review regarding the treatment of patients with mixed state, Valentì et al. found three qualified studies that indicated the safety and efficacy of ECT [17]. In a recent review, it was mentioned that even though there are not many randomised, controlled trials on the effects of ECT in BD, this procedure has shown a good clinical efficacy, especially in medication resistant patients diagnosed with this disorder [18].
ECT has been reported to affect monoamines, neuropeptides, neurotrophic factors, hormones and several neurotransmitters with their receptors [19, 20]. Additionally, this procedure may also affect immune system, cytokines, increase plasma cortisol or adrenocorticotrophic hormone (ACTH), and alter natural killer cell activity after ECT procedure [21]. It should be noted that some agents such as nonsteroidal anti-inflammatory drugs (NSAIDs) have been reported to reduce inflammation and inflammatory mediators [22]. Traditional NSAIDs like ibuprofen and selective cyclo-oxygenase (COX) II inhibitors are known to have analgesic, antipyretic and anti-inflammatory properties owing to their effects on the active site of COX-II enzyme [23]. Celecoxib is among the COX-II inhibitors and is reported to inhibit prostaglandin E2 production [24] and decrease proinflammatory cytokines [25]. And inhibition of the activation of TNF-α-induced NF-kB (nuclear factor kappa-light-chain-enhancer of activated B cells) [27] have been also reported with this drug.
Recently, celecoxib has been evaluated as an adjuvant in different psychiatric disorder like schizophrenia [25, 28, 29], depressive or mixed episodes of bipolar disorder [30], obsessive-compulsive disorder [31] and depression [32, 33].
There are several different cytokines that play a role in the regulation of immune function. Besides, the role of some cytokines such as IL-1β, IL-6, TNF-α in the central nervous system [7] has been reported in the literature. To the best of our knowledge the effect of ECT on cytokines in BD patients and the role of celecoxib in this regard have not been evaluated so far. Therefore, the current study was aimed to assess the effects of adjunctive celecoxib or placebo, in BD patients undergoing ECT, on serum cytokines and high-sensitivity CRP (hsCRP).
This parallel, randomised, double-blind clinical trial with (identifier number of IRCT201201247202N2) was registered at irct.ir and was conducted at Roozbeh Hospital, affiliated with Tehran University of Medical Sciences (TUMS). The study was approved by the ethics committee of the TUMS and patients or their guardians gave signed informed consent prior to entering this study. Inpatients from 17 to 70 years of age, who met the DSM IV-TR diagnostic criteria for BD and who were ordered to receive six or more ECT treatments by their psychiatrists, were included in this study. The principal investigator was the person who randomised the patients, based on a table of random numbers. Both patients and other researchers were blinded to whether the participant was taking celecoxib or placebo until after the completion of the study. The shapes of the placebo or celecoxib capsules were the same and they were packed in the envelopes numbered accordingly. The pharmacy in the hospital provided the medications for the patients after receiving the order based on the number assigned to each patient.
Celecoxib was administered at the dose of 200 mg twice daily starting a day before the first ECT and continuing with the same dose throughout the end of the 6th ECT session.
Patients with a history of hypersensitivity to NSAIDs, rheumatologic disease, active peptic ulcer disease, inflammatory bowel disease, advanced chronic liver or kidney disease, chronic obstructive pulmonary disease, and uncontrolled heart failure (New York Heart Association [NYHA] class ≥III) as well as those taking NSAIDs or corticosteroids concomitantly and pregnant women were excluded from this study. Moreover, patients could not have received ECT in the preceding two months.
Patients were followed up periodically by a clinical pharmacist to detect and monitor any adverse drug reactions (ADRs) that were reported by the patients or their caregivers during the study.
All patients received bilateral ECT, which was performed three times per week, using ThymatroneDGx (Somatics INC). All ECT procedures were performed between 7:30 and 9:00 a.m at Roozbeh Hospital. Patients were fasting for at least eight hours before the ECT procedure. During each ECT procedure, patients were administered 0.5 mg atropine followed by 2–3 mg/kg thiopental intravenously; succinylcholine (0.5 mg/kg) was administered as a muscle relaxant after the induction of anaesthesia. The stimulus intensity was determined with a dose titration procedure (starting at 25.2 millicoulomb) and seizure threshold was identified in the first session. Then, electrical dose was determined by multiplying seizure threshold dose by 2.5 in the following sessions. Seizure duration (tonic and clonic) was recorded by isolation of one leg by inflation of cuff over 240 mm Hg to assess quality of seizure. If the duration of the seizure was less than 15 seconds (aborted seizure) then the electrical dose would be increased by 50%. Patients’ ventilation was supported using 100% oxygen through a bag and mask until resumption of patients’ respiration. Electrocardiogram, arterial oxygen saturation (pulse oximetery), noninvasive blood pressure and heart rate of the patients were monitored continuously during the procedure.
Five ml of blood was drawn from each subject before the first ECT and repeated 5 hours after the first, the third and the sixth ECT sessions. Samples were centrifuged and separated and then stored at –70 °C until the time of the analyses. IL-1β, IL-6 and TNF-α concentrations were measured using a sandwich enzyme-linked immunosorbent assay (eBioscience, Bender MedSystemsGmbh, Vienna, Austria) according to the instructions included. hsCRP concentrations were measured by turbidometry (BioSystem, Barcelona, Spain); the limitation of detection in serum hsCRP level was less than 0.06 mg/l.
The sample size for this study was calculated on the basis of the previous study of Abbasi et al. [33], which compared the lowering effect of celecoxib versus placebo on IL-6 serum concentrations. The sample size was calculated to be 20 patients in each group that was determined by assuming a standard deviation of 0.64 in the celecoxib group compared with placebo (alpha = 0.05 and beta = 0.2) and about 0.4 changes in serum IL-6. Considering a possible drop-out rate of 10%, we decided to enrol a larger number of patients, i.e., 49 patients in total.
A two-way repeated measures analysis of variance (time–treatment interaction) was used. The two groups as a between subjects factor (group) and the four measurements during treatment as the within subjects factor (time) were considered. Test of sphericity was based on results of a Greenhouse–Geisser correction (details in Appendix). An unpaired student t-test was used to compare both groups at baseline and at the end of the trial. Wherever the distribution of data was not normal according to Kolmogorov and Smirnov (details in Appendix), nonparametric tests such as Mann–Whitney was used. For the comparison of demographic data the chi-square test was used. One way analysis of variance (ANOVA) was used to assess changes in cytokines and hsCRP in different assessments during the study period. After completion of the data gathering, the authors initially planned to analyse the information based on the “intention to treat” principle. However, subsequently and after considering the principle of last observation carried forward (LOCF), they decided to analyse the data based on the “per protocol” principle (the LOCF principle excluded a few cases because of missing data on some repeated measurements). SPSS-13 was used for statistical analysis of the data. The threshold for statistical significance was 0.05.
| Table 1: Demographic characteristics and baseline serum cytokine and hsCRP levels in patients receiving celecoxib (n = 25) and placebo (n = 23). | |||
| Celecoxib | Placebo | Significance level (p-value) | |
| Age (mean ± SD) | 33.64 ± 9.97 | 32.61 ± 9.82 | 0.72 |
| Female (n, %) | 16 (64) | 13 (56.5) | 0.81‡ |
| Mania and mixed state (n) | 22 | 21 | 0.71‡ |
| Presence of psychosis (n, %) | 12 (48) | 11(47.8) | 0.98‡ |
| IL-1β (pg/ml) (mean ± SD) | 6.03 ± 4.99 | 4.62 ± 5.52 | 0.36 |
| IL-6 (pg/ml) (mean ± SD) | 7.72 ± 23.42 | 5.63 ± 10.39 | 0.004† |
| TNF-α (pg/ml) (mean ± SD) | 14.88 ± 8.30 | 18.69 ± 7.00 | 0.09 |
| hsCRP (mg/l) (mean ± SD) | 7.651 ± 15.472 | 6.32 ± 13.08 | 0.81† |
| Mood Stabilizers (n): Lithium Sodium valproate Topiramate | 7 10 | 6 7 1 | |
| † Mann-Whitney test; ‡ chi-squared test | |||
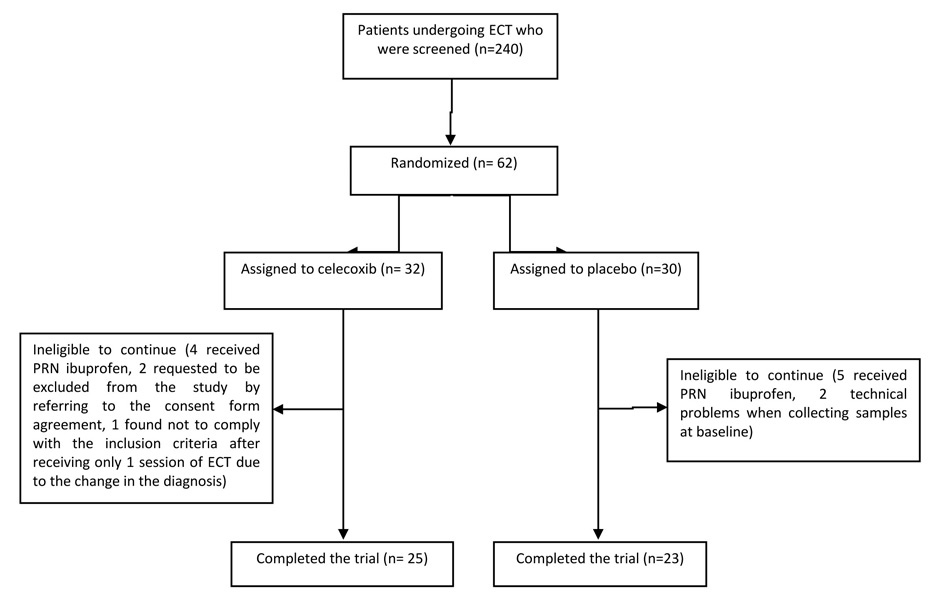
Sixty-two patients out of a total of 240, who were screened for this study from September 2010 to January 2012 at Roozbeh Hospital, were qualified to participate in the study and were randomly assigned to receive either celecoxib or placebo. Forty-eight patients completed the trial (25 received celecoxib and 23 were given placebo). The details of number of patients recruited and dropouts are shown in figure 1. Although all patients were in acute mood episodes, they were in different disease phases. In patients receiving celecoxib, 3 patients suffered from depression, 4 were in the mixed state and the remaining were in the manic phase; the number of patients with the above diagnosis were 2 and 3 in the placebo group, respectively and the remaining 18 patients were manic. No significant difference was observed in the demographic characteristic of patients regarding age, sex, BD episode or the presence of psychosis between the two groups. Table 1 summarises the demographic characteristics of patients and baseline values of serum cytokines and hsCRP.
Figure 1
At the beginning of the trial most patients were taking mood stabilisers as shown in table 2. During the study, only one patient in the placebo group and two patients in the celecoxib group were not receiving antipsychotics. None of the patients were administered antidepressants except one patient in celecoxib group who received fluoxetine. Since celecoxib may raise the serum concentration of lithium, serum level of all patients receiving lithium were closely monitored. Tables 2 and 3 show the mean ± standard deviation (SD) and median and interquartile range (IQR) of serum cytokines and hsCRP concentrations in both groups at each assessment respectively in our study.
It should be noted that owing to the small sample size of the study and also the wide variation in cytokine concentrations, we decided to switch to analysing our data using nonparametric tests such as Mann–Whitney instead of student t-test and Kruskal-Wallis test instead of ANOVA. This helped us to compare the groups with fewer assumptions than might have been required by parametric tests.
Table 2 shows that there was not a significant difference in serum concentration of IL-1 β between the two groups at baseline (p = 0.36, t = 0.93, degrees of freedom (df) 46). A two-way analysis of variance showed that the difference between patients receiving celecoxib or placebo was not significant as indicated by the effect on the group, the between-subjects factor (Greenhouse–Geisser correction: F 0.28, df 1, p = 0.60). The behaviour of two treatments was similar across the time (groups-by-time interaction, Greenhouse–Geisser correction: F 0.42, df 2.17, p = 0.67). The difference between the two treatments at the endpoint (after the sixth ECT) was not significant (Mann-Whitney test p = 0.81). In addition, a one-way repeated measure analysis of variance did not show a significant effect of both treatments on IL-1β. The p-values of Kruskal-Wallis test for the celecoxib and the placebo group were 0.57 and 0.95, respectively.
Table 2 shows that there was a significant difference in serum concentration of IL-6 at baseline between groups (Mann-Whitney test p = 0.004). A two-way analysis of variance showed that the difference between patients receiving celecoxib or placebo was not significant as indicated by the effect on the group, the between-subjects factor (Greenhouse–Geisser correction: F 1.15, df 1, p = 0.22). The behaviour of two treatments was similar across the time (groups-by-time interaction, Greenhouse–Geisser correction: F 1.58, df 2.26, p = 0.21). The difference between the two treatments at the endpoint (after the sixth ECT) was not significant (Mann-Whitney test p = 0.39).
Additionally, the changes at the endpoint compared with baseline were 1.92 and 5.89 for the celecoxib and placebo groups, respectively, and were not significant (Mann-Whitney test, p = 0.22). In addition, a one-way repeated measures analysis of variance did not show a significant effect from both treatments on IL-6. The p-values of Kruskal-Wallis test for the celecoxib and the placebo group were 0.25 and 0.16, respectively.
Table 2 shows that there was no significant difference in serum concentration of TNF-α between groups at baseline (p = 0.09, t = 1.71, df 46). A two-way analysis of variance showed that the difference between patients receiving celecoxib or placebo was not significant as indicated by the effect on the group, the between-subjects factor (Greenhouse–Geisser correction: F 1.67, df 1, p = 0.20). The behaviour of two treatments was similar across the time (groups-by-time interaction, Greenhouse–Geisser correction: F 0.95, df 2.44, p = 0.40). The difference between the two treatments at the endpoint (after the sixth ECT) was significant (p = 0.04, t = 2.14, df 46). In addition, a one-way repeated measures analysis of variance did not show a significant effect from both treatments on TNF-α. The p-values of Kruskal-Wallis test for the celecoxib was 0.66 and the p-value of one-way ANOVA for the placebo group was 0.84.
Table 2 shows that there was no significant difference in the serum concentration of hsCRP between the groups at baseline (Mann-Whitney test p = 0.81). A two-way analysis of variance showed that the difference between patients receiving celecoxib or placebo was not significant as indicated by the effect on the group, the between-subjects factor (Greenhouse–Geisser correction: F 0.16, df1 p = 0.69). The behaviour of two treatments was similar across the time (groups-by-time interaction, Greenhouse–Geisser correction: F 0.64, df 1.59, p = 0.5). The difference between the two treatments at the endpoint (after the sixth ECT) was not significant (Mann-Whitney test p = 0.45). In addition, a one-way repeated measures analysis of variance did not show a significant effect from both treatments on hsCRP. The p-values of Kruskal-Wallis test for the celecoxib and the placebo group were 0.95 and 0.85, respectively.
All patients were closely monitored for adverse effects. In the celecoxib group one patient developed diarrhea, however the association of this adverse event with the treatment was not clear. Another patient in this group experienced a rise in blood pressure even though he had a history of hypertension that was under control prior to ECT.
| Table 2: Serum cytokines and hsCRP concentrations in the celecoxib group (n = 25) and placebo group (n = 23) at different assessments during the study. Data are presented as mean ± standard deviation. | ||||||||
| IL-1β (pg/ml) | IL-6 (pg/ml) | TNF-α (pg/ml) | hsCRP (mg/l) | |||||
| Placebo | Celecoxib | Placebo | Celecoxib | Placebo | Celecoxib | Placebo | Celecoxib | |
| Baseline | 4.62 ± 5.52 | 6.03 ± 4.99 | 5.63 ± 10.39 | 7.72 ± 23.42 | 18.69 ± 7.00 | 14.88 ± 8.30 | 6.32 ± 13.08 | 7.65 ± 15.47 |
| First ECT | 5.61 ± 7.74 | 6.72 ± 9.01 | 26.92 ± 36.69 | 10.83 ± 27.82 | 19.16 ± 9.13 | 17.05 ± 11.76 | 7.30 ± 14.94 | 5.60 ± 9.25 |
| Third ECT | 10.45 ± 25.64 | 7.68 ± 14.54 | 8.58 ± 21.90 | 2.78 ± 4.85 | 17.24 ± 7.10 | 19.36 ± 19.28 | 5.08 ± 7.17 | 2.86 ± 2.79 |
| Sixth ECT | 9.60 ± 25.59 | 5.48 ± 6.09 | 11.53 ± 28.23 | 9.65 ± 24.25 | 17.96 ± 7.05 | 13.70 ± 6.74 | 5.29 ± 7.35 | 3.53 ± 6.26 |
| Table 3: Median and interquartile range (IQR) of serum cytokines and hsCRP concentrations in the celecoxib group (n = 25) and placebo group (n = 23) at each assessment. | ||||||||
| IL-1β (pg/ml) | IL-6 (pg/ml) | TNF-α (pg/ml) | hsCRP (mg/l) | |||||
| Placebo | Celecoxib | Placebo | Celecoxib | Placebo | Celecoxib | Placebo | Celecoxib | |
| Baseline | 3.8 (0.1‒5.6) | 5.4 (3.2‒7.7) | 2.2 (1.2‒5.4) | 1 (0.8‒1.5) | 18.4 (13.3‒20.2) | 11.8 (8.2‒20.9) | 2.4 (0.1‒4.8) | 1.7 (0.4‒5.8) |
| First ECT | 3.4 (2.2‒7) | 4.6 (3‒5.8) | 3.2 (1.2‒44.4) | 1.2 (1‒2.4) | 17.1 (12.1‒21.7) | 12.5 (9.2‒21.9) | 2.3 (0.7‒5.9) | 2.3 (0.3‒5.06) |
| Third ECT | 4 (1.8‒7.4) | 4.4 (2.2‒6) | 1.6 (1.2‒3.2) | 1 (0.8‒2.2) | 15.2 (11.7‒20.2) | 13.5 (9.9‒18.45) | 1.9 (0.7‒5.4) | 2.4 (0.7‒3.5) |
| Sixth ECT | 3.7 (2‒5.4) | 4 (2.2‒6.5) | 1.4 (1‒3.4) | 1.2 (0.8‒4.4) | 16.8 (12.5‒20.9) | 10.5 (9.05‒19.4) | 1.57(0.3‒6.7) | 1.2 (0.7‒3.4) |
We hypothesised that celecoxib may effectively reduce some inflammatory factors in patients undergoing ECT. Thus, the present study was performed to assess the effects of this medication on these markers in patients suffering BD who were receiving ECT. The results showed that celecoxib could only exert significant effect on TNF-α level at the end of the study.
A few studies have assessed the effects of adjuvant celecoxib on serum cytokines in psychiatric patients. A six-week trial found a significantly greater reduction in serum IL-6 concentrations in patients with major depressive disorder (MDD) who received celecoxib in addition to sertraline compared with those on placebo and sertraline [33]. On the other hand, another study noted that the addition of either celecoxib or placebo to the medication regimen of schizophrenic subjects, who were stabilised on olanzapine or risperidone, did not result in changes in cytokines [34]. Besides, even after one week of the treatment, temporary increases in the levels of TNF-α and IL-2 in patients receiving olanzapine were observed. The above study concluded that celecoxib does not significantly modify levels of interferon (IFN) γ, IL-1β, IL-2, IL-6, IL-10 or TNF-α in schizophrenic patients receiving psychotropics. However, in our study the baseline serum concentrations of Il-6 were significantly different between the groups. We assessed the changes in IL-6 concentrations from the baseline levels to the levels after the sixth ECT session; again the analysis did not result in any significant difference between groups.
To the best of our knowledge this was the first time that the effects of celecoxib on cytokines and hsCRP levels in BD patients undergoing ECT were evaluated. It should be mentioned that the clinical effects of adjuvant celecoxib in BD patients experiencing a depressive or mixed episode was evaluated in a six week study by Nery et al. [30]. The authors noted a greater improvement in depression in the first week in patients receiving celecoxib. However, no difference was reported in the severity of depression or mania from week two through the end of the trial between the study groups.
Our study noted a significant difference in the last TNF-α level measured between the two groups. However, the differences between the groups were not significant for hsCRP, IL-6 and IL-1. Hestad et al. suggested that TNF-α levels may decline in patients receiving repeated ECT [19]. TNF-α level was measured in depressed patients who underwent ECT and was compared with those in depressed patients not receiving ECT and also in healthy controls. Gradual and significant decline in TNF-α levels were observed in patients receiving ECT. At the end of the study, patients who received ECT had TNF-α levels within normal limits. The authors suggested that ECT could result in immunomodulatory effects. They proposed that, the anti-inflammatory effects of ECT may be exerted by electrical stimulation or secondary to the effects of ECT on neurotransmitters or neuroendocrine mediators. Our study did not find a constant trend in decreasing TNF-α level in the placebo group. In addition, there is evidence in the literature for the acute innate immune response activation following ECT (e.g. as reported in a study by Fluitman et al. [21]) in patients suffering from medication-resistant MDD and MDD with psychotic features. The authors noted that ECT resulted in increased levels of IL-6 and TNF-α. They also noted that the increases in the levels of cytokines between different ECT sessions was not significantly different. In another study, Lehtima et al. [35] reported that IL-1β and IL-6 were both increased 3 hours after ECT in 9 MDD patients who underwent one session of ECT; IL-6 was still increased 6hours after ECT, however, both levels decreased to the baseline values at 24 hours.
We did not find a significant difference in hsCRP levels between the two groups during the study. Controversies exist about the CRP-lowering effect of NSAIDs, including COX-II inhibitors. For example, reduction in CRP levels was reported after four weeks of treatment with celecoxib (200 mg daily) in patients undergoing chronic peritoneal dialysis [36]. In another study in male patients with severe coronary artery disease who were on aspirin and statins on a regular basis, hsCRP was significantly reduced two weeks after addition of celecoxib (200 mg twice daily) [37]. Additionally, rofecoxib (25 mg daily) taken in combination with aspirin for three months significantly decreased CRP levels in patients with acute coronary syndrome [36]. On the contrary, a randomised, double-blind trial reported that the addition of rofecoxib (25 mg daily) or placebo to the treatment regimen of patients with coronary artery disease for a period of eight weeks did not produce a significant change in hsCRP and sIL-6r [38]. Similarly, in another randomised, double-blind trial, four weeks of treatment with celecoxib (200 mg daily) or placebo could not modify CRP in overweight or obese volunteers [39]. Moreover, a recent meta-analysis of randomised controlled trials that assessed the effect of NSAIDs on CRP levels in patients suffering from rheumatoid arthritis noted that some NSAIDs, including celecoxib, had no effects on the CRP level [40].
One reason why significant changes in cytokines (except for TNF-α) were not observed after administration of celecoxib in our study may be the fact that ECT itself can induce acute production of cytokines. Therefore, in order to show its anti-inflammatory effects, celecoxib should overcome not only the high baseline cytokine levels in BD patients but also the rising levels following ECT.
It should be noted that although the sample size in this study was calculated to give our study a power of 80%, wide variation in the serum concentration of different cytokines in the present study makes it difficult to suggest any sample size for future studies with acceptable thresholds of power and precision. However, a larger sample size may in fact result in a more powerful comparison of differences in the effects of celecoxib on the cytokine levels of the study patients.
Despite the novelty of our study, the limitations should be emphasised. The use of different mood stabilisers by our patients can be a potential limitation for our study. Mood stabilisers have a predominant anti-inflammatory effect [6], which might have interfered with our assessments. Additionally, increasing the number of assessments after the initiation of the study could give a more precise result. Another possible limitation was the short duration of our study. A longer study with a larger sample size may show different anti-inflammatory effects of celecoxib in BD patients who are undergoing ECT. Besides, administration of higher doses of celecoxib may exert a more anti-inflammatory effect in these patients; however, researchers should be aware of the possibility of increased ADRs.
This study noted a significant difference only in TNF-α levels in patients received celecoxib compared with those received placebo, and no significant changes in other inflammatory markers including hsCRP, IL-1β and IL-6 were observed. The authors suggest a longer duration for investigating the effects of celecoxib on inflammatory markers with larger number of patients to confirm the findings of this study.
Many popular and commonly used statistical tests such as t-tests, analysis of variance (ANOVA), and linear regression analysis require an important assumption, which is a normal distribution of the variable(s) of interest. Violation of the normality assumption makes the interpretation and inferences unreliable or invalid. Thus, formal theorydriven tests of normality have been developed – in addition to graphical methods – to check the normal distribution of variable(s) of interest; Kolmogorov-Smirnov (KS) is one of the most popular ones available in statistical software packages [1]. In the KS test, given data are compared with a normal distribution that takes its mean and variance from the sample. Then this newly-developed “empirical distribution function” of the sample is compared to a “cumulative distribution function” of the reference distribution [2].
In repeated measures ANOVA, sphericity is an important assumption. It means that the differences between all possible pairs of levels of the independent variable should have equal variances. The purpose of the Mauchly’s sphericity test is to validate repeated measures ANOVA. It determines if variances of the differences have statistically significant difference from each other. If the probability of Mauchly’s test statistic is p <0.05 (i.e., significant), the variances of the differences are statistically different; so sphericity cannot be assumed and the F-value is biased upward and the chance of type I error increases. In order to correct the F-value, a few correction methods are included in statistical software packages. Greenhouse-Geisser is one of the most popular and more conservative ones that is used popularly. It does not change the F-value; instead, it changes the degree of freedom, such that a valid critical F-value can be obtained [3].
Acknowledgement:The authors would like to thank Zahravi Pharmaceutical Company for providing celecoxib capsules and the matching placebo for this study.
1 Subramaniam M, Abdin E, Vaingankar JA, Chong SA. Prevalence, correlates, comorbidity and severity of bipolar disorder: results from the Singapore Mental Health Study. J Affect Disord. 2013;146(2):189–96.
2 Skjelstad DV, Malt UF, Holte A. Symptoms and signs of the initial prodrome of bipolar disorder: A systematic review. J Affect Disord. 2010;126(1–2):1–13.
3 Pompili M, Rihmer Z, Innamorati M, Lester D, Girardi P, Tatarelli R. Assessment and treatment of suicide risk in bipolar disorders. Expert Rev Neurother. 2009;9(1):109–36.
4 Söderlund J, Olsson SK, Samuelsson M, Walther-Jallow L, Johansson C, Erhardt S, et al. Elevation of cerebrospinal fluid interleukin-1β in bipolar disorder. Journal of Psychiatry & Neuroscience: JPN. 2011;36(2):114.
5 Tsai SYM, Yang YY, Kuo CJ, Chen CC, Leu SJC. Effects of symptomatic severity on elevation of plasma soluble interleukin-2 receptor in bipolar mania. J Affect Disord. 2001;64(2):185–93.
6 Brietzke E, Kauer-Sant’Anna M, Teixeira AL, Kapczinski F. Abnormalities in serum chemokine levels in euthymic patients with Bipolar Disorder. Brain Behav Immun. 2009;23(8):1079–82.
7 Jones KA, Thomsen C. The role of the innate immune system in psychiatric disorders. Molecular and Cellular Neuroscience.2013;53:52–62.http://dx.doi.org/10.1016/j.mcn.2012.10.002
8 Brietzke E, Stertz L, Fernandes BS, Kauer-Sant’Anna M, Mascarenhas M, Escosteguy Vargas A, et al. Comparison of cytokine levels in depressed, manic and euthymic patients with bipolar disorder. J Affect Disord. 2009;116(3):214–7.
9 Kim YK, Jung HG, Myint AM, Kim H, Park SH. Imbalance between pro-inflammatory and anti-inflammatory cytokines in bipolar disorder. J Affect Disord. 2007;104(1):91–5.
10 Dickerson F, Stallings C, Origoni A, Boronow J, Yolken R. Elevated serum levels of C-reactive protein are associated with mania symptoms in outpatients with bipolar disorder. Prog Neuropsychopharmacol Biol Psychiatry. 2007;31(4):952–5.
11 O’Brien SM, Scully P, Scott LV, Dinan TG. Cytokine profiles in bipolar affective disorder: focus on acutely ill patients. J Affect Disord. 2006;90(2):263–7.
12 Kapczinski F, Dias VV, Kauer-Sant’Anna M, Brietzke E, Vázquez GH, Vieta E, et al. The potential use of biomarkers as an adjunctive tool for staging bipolar disorder. Prog Neuropsychopharmacol Biol Psychiatry. 2009;33(8):1366–71.
13 Thirthalli J, Prasad MK, Gangadhar BN. Electroconvulsive therapy (ECT) in bipolar disorder: A narrative review of literature. Asian J Psychiatr. 2012;5(1):11–7.
14 Nivoli AMA, Colom F, Murru A, Pacchiarotti I, Castro-Loli P, González-Pinto A, et al. New treatment guidelines for acute bipolar depression: A systematic review. J Affect Disord. 2011;129(1–3):14–26.
15 Nivoli AMA, Murru A, Goikolea JM, Crespo JM, Montes JM, González-Pinto A, et al. New treatment guidelines for acute bipolar mania: A critical review. J Affect Disord. 2012;140(2):125–41.
16 Medda P, Perugi G, Zanello S, Ciuffa M, Cassano G. Response to ECT in bipolar I, bipolar II and unipolar depression. J Affect Disord. 2009;118(1–3):55.
17 Valentí M, Benabarre A, García-Amador M, Molina O, Bernardo M, Vieta E. Electroconvulsive therapy in the treatment of mixed states in bipolar disorder. Eur Psychiatry. 2008;23(1):53–6.
18 Loo C, Katalinic N, Mitchell PB, Greenberg B. Physical treatments for bipolar disorder: A review of electroconvulsive therapy, stereotactic surgery and other brain stimulation techniques. J Affect Disord. 2011;132(1):1–13.
19 Hestad KA, Tønseth S, Støen CD, Ueland T, Aukrust P. Raised Plasma Levels of Tumor Necrosis Factor [alpha] in Patients With Depression: Normalization During Electroconvulsive Therapy. J ECT. 2003;19(4):183–8.
20 Taylor S. Electroconvulsive therapy: a review of history, patient selection, technique, and medication management. South Med J. 2007;100(5):494–8.
21 Fluitman SB, Heijnen CJ, Denys DAJP, Nolen WA, Balk FJ, Westenberg HGM. Electroconvulsive therapy has acute immunological and neuroendocrine effects in patients with major depressive disorder. J Affect Disord. 2011;131(1):388–92.
22 Mastbergen S, Lafeber F, Bijlsma J. Selective COX-2 inhibition prevents proinflammatory cytokine-induced cartilage damage. Rheumatology (Oxford). 2002;41(7):801–8.
23 Capone ML, Tacconelli S, Di Francesco L, Sacchetti A, Sciulli MG, Patrignani P. Pharmacodynamic of cyclooxygenase inhibitors in humans. Prostaglandins Other Lipid Mediat. 2007;82(1–4):85–94.
24 Fields C, Drye L, Vaidya V, Lyketsos C. Celecoxib or Naproxen Treatment Does Not Benefit Depressive Symptoms in Persons Age 70 and Older: Findings From a Randomized Controlled Trial. American Journal of Geriatric Psych. 2012;20(6):505.
25 Akhondzadeh S, Tabatabaee M, Amini H, Ahmadi Abhari SA, Abbasi SH, Behnam B. Celecoxib as adjunctive therapy in schizophrenia: A double-blind, randomized and placebo-controlled trial. Schizophr Res. 2007;90(1–3):179–85.
26 Maier TJ, Tausch L, Hoernig M, Coste O, Schmidt R, Angioni C, et al. Celecoxib inhibits 5-lipoxygenase. Biochem Pharmacol. 2008;76(7):862–72.
27 Funakoshi-Tago M, Shimizu T, Tago K, Nakamura M, Itoh H, Sonoda Y, et al. Celecoxib potently inhibits TNFα-induced nuclear translocation and activation of NF-κB. Biochem Pharmacol. 2008;76(5):662–71.
28 Rapaport MH, Delrahim KK, Bresee CJ, Maddux RE, Ahmadpour O, Dolnak D. Celecoxib Augmentation of Continuously Ill Patients with Schizophrenia. Biol Psychiatry. 2005;57(12):1594–6.
29 Müller N, Krause D, Dehning S, Musil R, Schennach-Wolff R, Obermeier M, et al. Celecoxib treatment in an early stage of schizophrenia: results of a randomized, double-blind, placebo-controlled trial of celecoxib augmentation of amisulpride treatment. Schizophr Res. 2010;121(1-3):118.
30 Nery FG, Monkul ES, Hatch JP, Fonseca M, Zunta-Soares GB, Frey BN, et al. Celecoxib as an adjunct in the treatment of depressive or mixed episodes of bipolar disorder: a double-blind, randomized, placebo-controlled study. Hum Psychopharmacol. 2008;23(2):87–94.
31 Sayyah M, Boostani H, Pakseresht S, Malayeri A. A preliminary randomized double–blind clinical trial on the efficacy of celecoxib as an adjunct in the treatment of obsessive–compulsive disorder. Psychiatry Res. 2011;189(3):403–6.
32 Akhondzadeh S, Jafari S, Raisi F, Nasehi AA, Ghoreishi A, Salehi B, et al. Clinical trial of adjunctive celecoxib treatment in patients with major depression: a double blind and placebo controlled trial. Depress Anxiety. 2009;26(7):607–11.
33 Abbasi SH, Hosseini F, Modabbernia A, Ashrafi M, Akhondzadeh S. Effect of celecoxib add-on treatment on symptoms and serum IL-6 concentrations in patients with major depressive disorder: randomized double-blind placebo-controlled study. J Affect Disord. 2012; 141(2-3):308–14.
34 Bresee CJ, Delrahim K, Maddux RE, Dolnak D, Ahmadpour O, Rapaport MH. The effects of celecoxib augmentation on cytokine levels in schizophrenia. Int J Neuropsychopharmacol. 2006;9(03):343–8.
35 Lehtimäki K, Keränen T, Huuhka M, Palmio J, Hurme M, Leinonen E, et al. Increase in plasma proinflammatory cytokines after electroconvulsive therapy in patients with depressive disorder. J ECT. 2008;24(1):88–91.
36 Prasad K. C-Reactive Protein (CRP)-Lowering Agents. Cardiovasc Drug Rev. 2006;24(1):33–50.
37 Chenevard R, Hürlimann D, Béchir M, Enseleit F, Spieker L, Hermann M, et al. Selective COX-2 inhibition improves endothelial function in coronary artery disease. Circulation. 2003;107(3):405–9.
38 Title LM, Giddens K, McInerney MM, McQueen MJ, Nassar BA. Effect of cyclooxygenase-2 inhibition with rofecoxib on endothelial dysfunction and inflammatory markers in patients with coronary artery disease. J Am Coll Cardiol. 2003;42(10):1747-53.
39 González-Ortiz M, Pascoe-González S, Kam-Ramos AM, Hernández-Salazar E. Effect of celecoxib, a cyclooxygenase-2-specific inhibitor, on insulin sensitivity, C-reactive protein, homocysteine, and metabolic profile in overweight or obese subjects. Metab Syndr Relat Disord. 2005;3(2):95–101.
40 Tarp S, Bartels EM, Bliddal H, Furst DE, Boers M, Danneskiold-Samsøe B, et al. Effect of nonsteroidal antiinflammatory drugs on the C-reactive protein level in rheumatoid arthritis: A meta-analysis of randomized controlled trials. Arthritis Rheum. 2012;64(11):3511–21.
1 Yap BW, Sim CH. Comparisons of various types of normality tests. Journal of Statistical Computation and Simulation. 2011;81(12):2141–55.
2 Drezner Z, Turel O, Zerom D. A Modified Kolmogorov-Smirnov Test for Normality. Communications in Statistics-Simulation and Computation. 2010;39(4):693–704.
3 Keselman HJ, Algina J, Kowalchuk RK. The analysis of repeated measures designs: A review. Br J Math Stat Psychol. 2001;54:1–20.
Trial registration number: IRCT201201247202N2
Funding / potential competing interests: This study was supported by a grant from Tehran University of Medical Sciences (Grant No. 10809).