Prediction of arrhythmic events by Wedensky modulation in patients with coronary artery disease
DOI: https://doi.org/10.4414/smw.2014.13929
Andreas W
Schoenenberger, Olivia
Schär, Richard
Kobza, Paul
Erne
Summary
PRINCIPLES: Prediction of arrhythmic events (AEs) has gained importance with the availability of implantable cardioverter-defibrillators (ICDs), but is still imprecise. This study evaluated the innovative Wedensky modulation index (WMI) as predictor of AEs.
METHODS: In this prospective cohort, 179 patients with coronary artery disease (CAD) referred for AE risk assessment underwent baseline evaluation including measurement of R-/T-wave WMI (WMIRT) and left ventricular ejection fraction (LVEF). Two endpoints were assessed 3 years after the baseline evaluation: sudden cardiac death or appropriate ICD event (EP1) and any cardiac death or appropriate ICD event (EP2). Associations between baseline predictors (WMIRT and LVEF) and endpoints were evaluated in regression models.
RESULTS: Only three patients were lost to follow-up. EP1 and EP2 occurred in 24 and 27 patients, respectively. WMIRT (odds ratio [OR] per 1 point increase for EP1 20.1, 95% confidence interval [CI] 1.8–221.4, p = 0.014, and for EP2 73.3, 95% CI 6.6–817.7, p <0.001) and LVEF (OR per 1% increase for EP1 0.94, 95% CI 0.90–0.99, p = 0.013, and for EP2 0.93, 95% CI 0.89–0.97, p = 0.002) were significantly associated with both endpoints. In bivariable regression controlled for LVEF, WMIRT was independently associated with EP1 (p = 0.047) and EP2 (p = 0.007). The combination of WMIRT ≥0.60 and LVEF ≤30% resulted in a positive predictive value of 36% for EP1 and 50% for EP2.
CONCLUSIONS: WMIRT is a significant predictor of AEs independent of LVEF and has potential to improve AE risk prediction in CAD patients. However, WMIRT should be evaluated in larger and independent samples before recommendations for clinical routine can be made.
Introduction
Implantable cardioverter-defibrillators (ICDs) can prevent arrhythmic events (AEs) causing sudden cardiac death (SCD) [1–3]. Therefore, guidelines recommend ICD implantation in specific patient situations [4]. The currently used criteria for ICD implantation are still far from perfect. Depending on the criteria used for ICD implantation, numbers needed to treat remain high: approximately 30 ICD implantations are required to prevent one SCD per year using the criterion of a prior myocardial infarction and a left ventricular ejection fraction (LVEF) ≤30% [3]. Unnecessary ICD implantation should be avoided, because ICDs are expensive and can cause adverse events (e.g., anxiety disorders due to inappropriate ICD shocks, or infections) [5]. On the other hand, many patients at risk for SCD do not receive an ICD because the increased risk is not recognised [6]. Improvements in SCD prediction are required. Currently, LVEF is the most widely used single predictor because it was evaluated in most of the clinical trials [1–3]. However, test characteristics of LVEF for SCD prediction are far from perfect and LVEF determination lacks precision [7–12].
Determination of the Wedensky modulation index (WMI) is a novel and innovative technology for SCD prediction. WMI is based on the observation that a sub-threshold electrical stimulus may alter the cellular threshold for subsequent depolarisation, first described by Wedensky in 1886 for neuromuscular tissue, and later described by Castellanos for the human heart [13, 14]. The extent to which heart cells alter their threshold after a sub-threshold stimulus is a marker for their excitability and might therefore be a marker for SCD risk. Several clinical studies evaluated WMI as a SCD risk predictor and documented its ability to stratify the risk [15–18]. However, in these previous studies patients were at the highest risk of SCD (mostly patients who had ICDs), the sample size was small, or there was no follow-up with hard endpoints. Therefore, this study investigated WMI in an adequately powered sample of patients with coronary artery disease (CAD) as predictor of AEs during 3 years of follow-up, and evaluated its ability to enhance risk prediction models based on LVEF.
Methods
Study population
Consecutive patients referred for SCD risk evaluation to Luzerner Kantonsspital (Luzern, Switzerland) during a 4–year period (between 1 October 2003 and 30 September 2007) were eligible for this prospective cohort study. In general, patients were referred for SCD risk evaluation if they were considered at increased risk for SCD (e.g., after myocardial infarction, after a syncope, after resuscitation, due to a low LVEF and/or due to ventricular tachycardia/fibrillation [VT/VF] during monitoring). Patients were included in the study if they had CAD. CAD was considered to be present if coronary angiography revealed at least one coronary stenosis of ≥50% in one of the coronary vessels or if the patient had an acute coronary syndrome (ACS) caused by coronary vasospasm. Patients who did not provide written informed consent were excluded. The study complies with the Declaration of Helsinki and was approved by the local ethics committee.
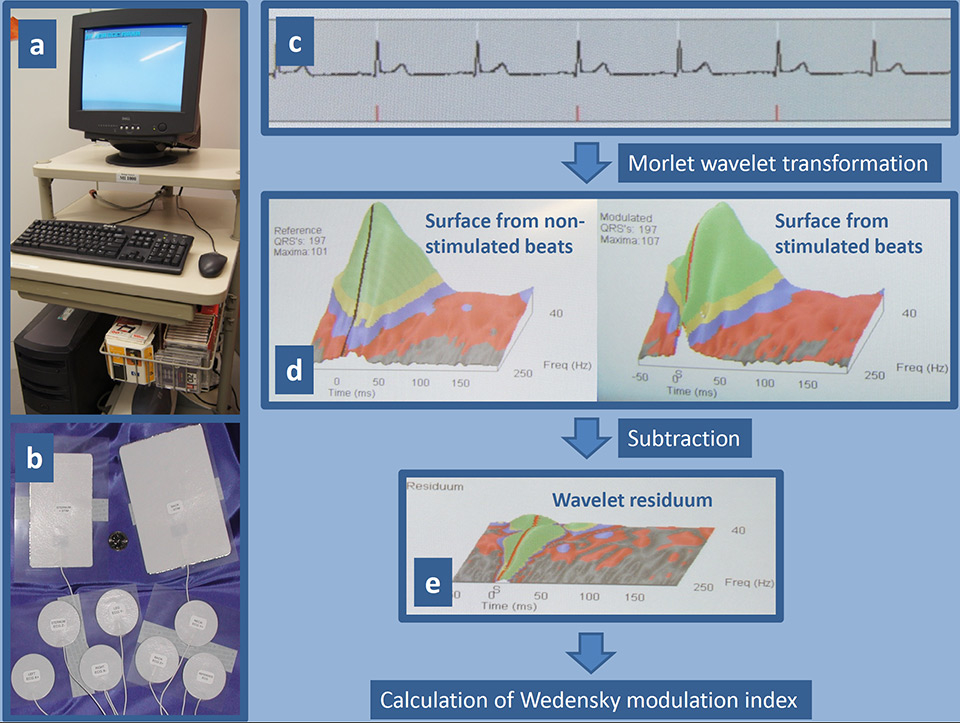
Figure 1
The device for Wedensky modulation consists of a standard computer system equipped with an adapter for the special electrodes and software for analysis of the ECG signal (a). The set of electrodes includes two large-size electrodes for the application of sub-threshold stimuli, which are placed on the sternum and back, and seven small-size electrodes for the recording of a high resolution ECG (b). Example of an ECG recording (c): the white tick marks show where the software detected an R-wave, and the red tick marks show when a sub-threshold stimulus was delivered. ECG recordings are analysed using three-dimensional Morlet wavelet transformation separately for stimulated and non-stimulated heart beats. The wavelet transformation averages the vector magnitude of the beats, separates the frequency of the beats, and displays the results as a three-dimensional surface whose axes are time (x axis), frequency (y axis), and amplitude (z axis) (d). To reveal the difference between the stimulated and non-stimulated beats the surfaces are arithmetically subtracted resulting in a wavelet residuum (e). Any variation in the wavelet residuum plane represents a response caused by the stimulation. The key indicators of the wavelet residuum are mathematically combined to calculate the Wedensky modulation index.
Baseline data
All participating patients underwent an extensive baseline examination. Patient history, including symptoms, cardiovascular risk factors, medication, prior cardiovascular events and further comorbidities, was recorded. Physical examination included the measurement of weight, height, blood pressure and heart rate. An electrocardiogram (ECG) was recorded in all patients. All patients underwent cardiac catheterisation to provide information about the presence of CAD. LVEF was measured with transthoracic echocardiography in all patients and was determined on two- and four-chamber views using the modified biplane Simpson method.
WMI was determined using a novel device (MI-1000, Harbinger Medical Inc., Eden Prairie, Minnesota, USA) (fig. 1). The device is capable of applying electrical sub-threshold stimuli of 5 mA for 2 ms via two electrodes which are placed on the patient’s thorax. The device records a high resolution ECG of approximately 1,000 heartbeats. The first 200 heartbeats are recorded without any stimulation. During the next 400 heartbeats, a sub-threshold stimulus is applied to every second heartbeat synchronised with the R-wave. During the last 400 heartbeats, the stimulus is applied 20 ms after the R-wave. The recordings are analysed using a three-dimensional Morlet wavelet surface calculation from stimulated and non-stimulated heart beats (fig. 1) [19, 20]. Previous studies showed that patients with increased SCD risk are less sensitive to the sub-threshold stimulus, and the wavelet surface of the high resolution ECG alters to a lesser extent [15–17]. Based on the difference of the wavelet surfaces between stimulated and non-stimulated heart beats, WMI is calculated separately for the R-wave (WMIR) and the T-wave (WMIT). The higher of both WMIs is then selected for the combined WMIRT, which was evaluated as a SCD predictor in this study. WMIRT values range between 0 and 1 with higher values indicating higher SCD risk.
Follow-up data
Follow-up data were recorded at exactly 3 years after the baseline examination. Follow-up data were obtained from several sources. All patients were contacted by telephone. In addition, ICD protocols of all patients treated with an ICD were reviewed. Surviving patients were interviewed by telephone using a structured protocol. If the patient reported a possible AE, additional information was obtained from the hospital case record and/or general practitioner. For patients who died, additional information on the circumstances of death was collected by interviewing the patient’s relatives and/or general practitioner and/or by studying the hospital case record.
The present study evaluated two endpoints: first, SCD or sustained VT/VF terminated appropriately by ICD shock or ICD antitachycardia pacing (endpoint 1); and second, any cardiac death (including SCD) or sustained VT/VF terminated appropriately by ICD shock or ICD antitachycardia pacing (endpoint 2). AEs were independently classified by two physicians who were blinded to baseline data. For death classification, the Hinkle-Thaler method was used [21]. If a patient experienced more than one endpoint event (e.g., termination of a sustained VT/VF by ICD in a patient who later died from a cardiac cause), only the first endpoint event was considered.
Statistical analysis
First, mortality and arrhythmic events during follow-up were descriptively analysed. Second, the associations between the baseline predictors (WMIRT and LVEF) and the endpoints were evaluated in uni- and multivariable logistic regression models providing odds ratios (ORs). Predictors were analysed as continuous and dichotomised measures. As continuous measures, the predictors were used linearly (after checking for a potential quadratic relationship with the endpoints). For their use as dichotomised measures, predictors were dichotomised at cut-points based on the following considerations: first, current evidence from literature, and second, a cut-point close to the 25th percentile of the predictor (hereby generating for both predictors a high-risk population of about one quarter of the overall study population) [1–3, 15–18]. This resulted in the following cut points: WMIRT ≥0.60 (indicating higher risk) vs <0.60 (indicating lower risk) and LVEF ≤30% (indicating higher risk) vs LVEF >30% (indicating lower risk). Postestimation after logistic regression included the calculation of the area under the receiver operating characteristic curve (AUROC) for each predictor separately, as well as for the combination of both predictors [22]. Sensitivity, specificity, positive predictive value (PPV), and negative predictive value (NPV) were calculated for both dichotomised predictors. Kaplan-Meier survivor functions were generated to illustrate the ability to stratify the risk for each dichotomised predictor separately, as well as for a combination of both predictors [23]. Predictors were combined by defining the following three groups: both predictors concomitantly indicating lower risk (WMIRT <0.60 and LVEF >30%), one of the two predictors indicating higher risk (WMIRT ≥0.60 or LVEF ≤30%), and both predictors concomitantly indicating higher risk (WMIRT ≥0.60 and LVEF ≤30%). The log-rank test was used to examine equality of survivor functions. The Kruskal-Wallis rank test was used to compare the PPV of the combined predictors with LVEF alone. Sensitivity analyses were performed in the primary prevention patients. The required sample size was calculated a priori to be 177 patients on the basis of the following assumptions: power 0.80, alpha 0.05, endpoint rate 5%/year, predictor indicating higher risk doubles risk for endpoint after 3 years. Data were analysed using Stata 11.2 (StataCorp LP, College Station, TX, USA).
Results
Study population
Between 1 October 2003 and 30 September 2007, 231 patients were referred for SCD risk evaluation. Of these, 52 patients (23%) were excluded because they fulfilled an exclusion criterion (fig. 2). Most of the excluded patients suffered from dilated cardiopathy without CAD. Of note, none of the eligible patients refused study participation. The study population finally consisted of 179 patients. Of these, only five patients (3%) did not undergo 3–year follow-up: three patients were foreign workers in Switzerland at the time of study inclusion who later moved away to their country of origin and were not contactable, one patient received heart transplantation during follow-up, and one patient died during baseline evaluation when examinations were not yet completed. The study population finally consisted of 174 patients with complete follow-up information.
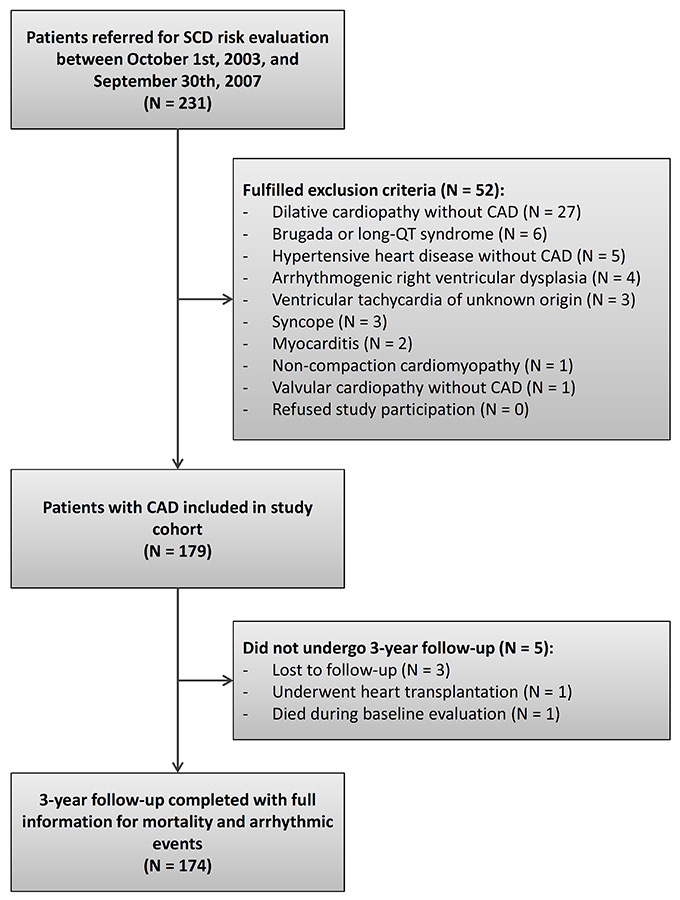
Figure 2
Flow chart – patient disposition during study.
CAD = coronary artery disease; SCD = sudden cardiac death
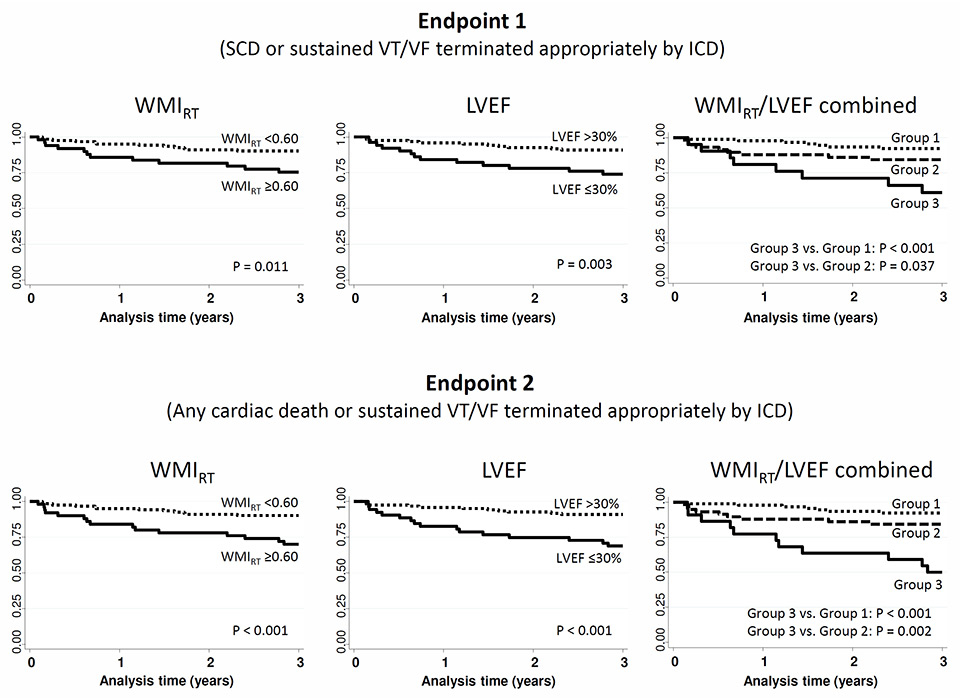
Figure 3
Kaplan-Meier survival estimates for Wedensky modulation index (WMIRT), left ventricular ejection fraction (LVEF) and the combination of both predictors (Group 1 = WMIRT <0.60 and LVEF >30%; Group 2 = WMIRT ≥0.60 or LVEF ≤30%; Group 3 = WMIRT ≥0.60 and LVEF ≤30%).
ICD = implantable cardioverter-defibrillator; SCD = sudden cardiac death; VT/VF = ventricular tachycardia / ventricular fibrillation
Baseline data
Baseline characteristics of the study participants who completed follow-up are shown in table 1. Mean age was 59 ± standard deviation of 9 years (range 35–78 years). Twenty-one participants (12%) were women. In accordance with the inclusion criteria, all patients had CAD of whom 165 patients (95%) previously had an ACS. A percutaneous coronary intervention was performed in 137 patients (79%) of whom 133 patients (97%) also received stent implantation. A substantial proportion, 96 patients (55%), had an ICD and were checked in hospital at yearly intervals. Of these, an ICD was implanted for primary prevention in 80 patients (83%) and for secondary prevention after aborted SCD in 16 patients (17%). The decision for ICD implantation in primary prevention patients was based on a comprehensive clinical evaluation, including LVEF, findings from rhythm monitoring, and/or invasive evaluation. Forty-six of 80 primary prevention patients (58%) had an LVEF <35%.
Mean values of the two baseline predictors (WMIRT and LVEF) are shown in table 1. The WMIRT had a maximum range from 0.16 to 1.00, the LVEF from 17% to 70%. After dichotomisation, 50 patients (29%) were considered at higher risk according to the WMIRT, and 54 patients (31%) according to the LVEF. Only 22 patients were concomitantly rated higher risk by both predictors. In 90 patients (55%) of the 165 with a previous ACS, the predictors were measured within 1 month after the ACS. Both baseline predictors (WMIRT and LVEF) were available for all study participants and there were no missing values due to technical errors.
Follow-up data
Overall, 15 patients (9%) died during the 3–year follow-up. Causes of death were: SCD in 5 patients (33%), congestive heart failure in 5 patients (33%), cancer in 2 patients (13%), pneumonia in one patient (7%), intra-operative death in one patient (7%), and unclear cause in one patient (7%). Twenty-four patients (14%) experienced an endpoint 1 event (SCD in 4 patients and sustained VT/VF terminated appropriately by ICD in 20 patients), and 27 patients (16%) an endpoint 2 event (as compared with endpoint 1, cardiac death as a result of congestive heart failure in an additional 3 patients). Inappropriate ICD shocks not counting as endpoint events were observed during follow-up in 12 patients (7%). Among patients who experienced a non-fatal endpoint event, three died later in the course of the study: SCD occurred in one patient; one patient died of congestive heart failure; and one patient died after the ICD was inactivated, because overall treatment was changed to palliation.
Associations between predictors and endpoints
Uni- and bi-variable associations of predictors with the endpoints from logistic regression and postestimation of AUROC are shown in table 2. Bivariable logistic regression revealed independent associations with the endpoints for both predictors. Test characteristics of both dichotomised predictors were similar. For endpoint 1, WMIRT had a sensitivity of 50%, a specificity of 75%, a PPV of 24%, and an NPV of 90%; LVEF had a sensitivity of 54%, a specificity of 73%, a PPV of 24%, and an NPV of 91%. For endpoint 2, WMIRT had a sensitivity of 56%, a specificity of 76%, a PPV of 30%, and an NPV of 90%; LVEF had a sensitivity of 59%, a specificity of 74%, a PPV of 30%, and an NPV of 91%.
Figure 3 shows the Kaplan-Meier survival estimates for WMIRT, LVEF and the combination of both predictors for the prediction of both endpoints. Of note, the combination of a WMIRT ≥0.60 and LVEF ≤30% resulted in a PPV of 36% for endpoint 1 and of 50% for endpoint 2. Compared with LVEF alone, the increase in PPV with use of both predictors combined was not significant (p = 0.280 for endpoint 1 and p = 0.095 for endpoint 2).
Sensitivity analyses
In the 147 primary prevention patients, sensitivity analyses revealed that WMIRT (OR per 1 point increase for endpoint 1 = 30.0, 95% confidence interval [CI] 2.3–397.8, p = 0.010, and for endpoint 2 = 130.5, 95% CI 9.1–1,871.0, p <0.001) and LVEF (OR per 1% increase for endpoint 1 = 0.94, 95% CI 0.89–0.99, P = 0.017, and for endpoint 2= 0.92, 95% CI 0.88 – 0.97, p = 0.002) were significantly associated with both endpoints.
|
Table 1: Baseline characteristics. |
|
Characteristic
|
All study participants
(n = 174)
|
| Age, mean ± SD, years |
59 ± 9 |
| Female sex, n (%) |
21 (12) |
| Body Mass Index, mean ± SD, kg/m2
|
27 ± 4 |
| Cardiovascular risk factors |
| Hypertension, n (%) |
83 (48) |
| Hypercholesterolaemia, n (%) |
122 (70) |
| Smoker, n (%) |
117 (67) |
| Diabetes, n (%) |
47 (27) |
| Positive family history for CAD, n (%) |
50 (29) |
| Positive family history for SCD, n (%) |
8 (5) |
| Medical history |
| CAD, n (%)
– One-vessel, n (%)
– Two-vessel, n (%)
– Three-vessel, n (%)
– ACS caused by vasospasm, n (%) |
174 (100)
56 (32)
56 (32)
59 (34)
3 (2) |
| Previous ACS, n (%) |
165 (95) |
| Previous PCI, n (%) |
137 (79) |
| Previous resuscitation, n (%) |
27 (16) |
| ECG |
| Corrected QT duration, mean ± SD, ms |
454 ± 80 |
| Left bundle branch block, n (%) |
21 (12) |
| Right bundle branch block, n (%) |
16 (9) |
| Laboratory |
| Creatinine, mean ± SD, µmol/l |
91 ± 40 |
| Wedensky modulation |
| WMIRT, mean ± SD, % |
0.52 ± 0.17 |
| Echocardiography |
| LVEF, mean ± SD, % |
38 ± 11 |
| Treatment after SCD risk evaluation |
|
| ICD, n (%) |
96 (55) |
| Beta-blocker, n (%) |
144 (83) |
| ACEI, n (%) |
143 (82) |
| Diuretics, n (%) |
94 (54) |
| ACEI = angiotensin converting enzyme inhibitor; ACS = acute coronary syndrome; CAD = coronary artery disease; ECG = electrocardiogram; ICD = implantable cardioverter-defibrillator; LVEF = left ventricular ejection fraction; PCI = percutaneous coronary intervention; SCD, sudden cardiac death; SD = standard deviation; WMI = Wedensky modulation index |
|
Table 2: Uni- and bi-variable associations of predictors with endpoint 1 (SCD or sustained VT/VF terminated appropriately by ICD) and endpoint 2 (any cardiac death or sustained VT/VF terminated appropriately by ICD) using logistic regression and postestimation of the area under the receiver operating characteristic curve (AUROC). Each predictor was assessed as linear measure and after dichotomisation at standard cut points. |
|
Predictor
|
Endpoint 1
|
Endpoint 2
|
|
|
OR (95% CI) |
p-value |
AUROC (95% CI) |
OR (95% CI) |
p-value |
AUROC (95% CI) |
| Univariable associations |
| WMIRT
– linear (OR per 1 point increase)
– dichotomised (≥0.60 vs <0.60) |
20.1 (1.8–221.4)
2.9 (1.2–7.1) |
0.014
0.016 |
0.64 (0.51–0.76)
0.62 (0.52–0.73) |
73.3 (6.6–817.7)
4.0 (1.7–9.3) |
<0.001
0.001 |
0.68 (0.56–0.80)
0.66 (0.56–0.76) |
| LVEF
– linear (OR per 1% increase)
– dichotomised (≤30% vs >30%) |
0.94 (0.90–0.99)
3.1 (1.3–7.6) |
0.013
0.011 |
0.67 (0.56–0.79)
0.63 (0.53–0.74) |
0.93 (0.89–0.97)
4.2 (1.8–9.8) |
0.002
0.001 |
0.71 (0.60–0.82)
0.67 (0.57–0.77) |
| Bivariable associations |
| WMIRT linear
LVEF linear
(p-value from global LR χ2) |
8.7 (0.7–109.2)
0.96 (0.91–1.00) |
0.095
0.057
0.007 |
0.70 (0.58–0.82) |
28.4 (2.3–354.0)
0.95 (0.90–0.99) |
0.009
0.021
<0.001 |
0.74 (0.63–0.85) |
| WMIRT dichotomised
LVEF dichotomised
(p-value from global LR χ2) |
2.5 (1.0–6.2)
2.7 (1.1–6.7) |
0.047
0.030
0.006 |
0.68 (0.56–0.80) |
3.4 (1.4–8.1)
3.5 (1.5–8.5) |
0.007
0.005
<0.001 |
0.72 (0.61–0.83) |
| AUROC = area under the receiver operating characteristic curve; CI = confidence interval; ICD = implantable cardioverter-defibrillator; LVEF = left ventricular ejection fraction; OR = odds ratio; SCD = sudden cardiac death; VT/VF = ventricular tachycardia / ventricular fibrillation; WMI = Wedensky modulation index |
Discussion
This prospective longitudinal cohort study in CAD patients shows that WMIRT is a significant predictor of AEs. Bivariable regression analysis of WMIRT revealed that it is a predictor independent of LVEF. The ability of WMIRT to stratify the risk is comparable to that of LVEF, as shown by similar AUROCs as well as by the test characteristics after dichotomisation. AUROCs and Kaplan-Meier curves suggest that WMIRT has the potential to enhance risk prediction models based on LVEF, but this study was not large enough to develop such a risk prediction model.
To our knowledge the present study is the first study to evaluate WMIRT as predictor of AEs in a larger lower risk sample that also included patients without ICD. Most of the previously published WMI studies correlated WMI with other markers of increased SCD risk and did not use follow-up data to study its ability to stratify the risk [16–18]. Only one recent large study evaluated WMI as predictor of AEs and used prospective follow-up data [15]. However, this study was confined to high-risk patients who had received an ICD. Therefore, in the authors’ opinion, the present study adds to current literature.
Test characteristics of the WMIRT in the present study were comparable to other risk predictors in clinical use for SCD risk stratification [7–12]. Test characteristics found for LVEF in the present study were similar to those found for LVEF in previous studies [7–12]. In general, non-invasive SCD risk predictors have good NPVs of 90% or more. However, it is an issue that PPVs of most SCD risk predictors are below 40%, which is too low to efficiently guide ICD therapy using a single predictor. The same holds true for WMIRT in the present study. Therefore, WMIRT is not suitable for use as a single predictor in clinical routine, but, as an independent predictor, might be of use in combination with other risk predictors.
This study has some limitations. First, the findings of this study are based on data from a single centre. Therefore, confirmation in an independent sample is of importance to improve generalisability of the findings of the present study. Second, in accordance with the inclusion and exclusion criteria, the study population was heterogeneous with regard to ICD indications. The study population included patients who needed an ICD for primary prevention, patients who needed an ICD for secondary prevention, and patients who did not need an ICD. Therefore, test characteristics of WMI and LVEF might be different if only applied to one of these subgroups. Third, the sample size was rather small, with 174 patients. This number and the resulting number of endpoints were not sufficient to evaluate the WMIRT in multivariable models involving more than two predictor variables [24]. Furthermore, the sample size was not sufficient to prove whether or not WMIRT enhances risk prediction models based on LVEF. However, the sample size was adequate to prove the main hypothesis that WMIRT is a significant predictor independent of LVEF as shown by the corresponding confidence intervals. Fourth, sustained VT/VF terminated appropriately by ICD is a weak endpoint event, because in not all circumstances SCD would have resulted if the ICD shock was not delivered. Fifth, the method for WMIRT determination is new and an explanation why ECG morphology should alter after sub-threshold stimulation is still lacking. Sixth, the choice of cut-points for WMIRT and LVEF is essentially arbitrary and different cut-points would yield different results.
As a consequence of these limitations, there are research implications. First, because the technology is novel and innovative, one may assume that there is potential for further developments. Second, studies based on larger sample sizes are needed for the derivation and validation of risk scores combining WMIRT with other scores that have been found to be predictive of SCD. It is likely that this results in further improvement of SCD prediction. Third, WMIRT might also be evaluated in ICD intervention trials as risk predictor.
The present study shows that the novel and innovative WMIRT was a strong predictor of AEs in CAD patients over a 3-year follow-up period. WMIRT has the potential to improve SCD risk prediction models. However, WMIRT should be evaluated in larger and independent samples before useful recommendations for clinical routine can be made.
References
1 Moss AJ, Hall WJ, Cannom DS, Daubert JP, Higgins SL, Klein H, et al. Improved survival with an implanted defibrillator in patients with coronary disease at high risk for ventricular arrhythmia. Multicenter Automatic Defibrillator Implantation Trial Investigators. N Engl J Med. 1996;335:1933–40.
2 Buxton AE, Lee KL, Fisher JD, Josephson ME, Prystowsky EN, Hafley G. A randomized study of the prevention of sudden death in patients with coronary artery disease. Multicenter Unsustained Tachycardia Trial Investigators. N Engl J Med. 1999;341:1882–90.
3 Moss AJ, Zareba W, Hall WJ, Klein H, Wilber DJ, Cannom DS, et al. Multicenter Automatic Defibrillator Implantation Trial II Investigators. Prophylactic implantation of a defibrillator in patients with myocardial infarction and reduced ejection fraction. N Engl J Med. 2002;346:877–83.
4 Epstein AE, DiMarco JP, Ellenbogen KA, Estes NA 3rd, Freedman RA, Gettes LS, et al. American College of Cardiology/American Heart Association Task Force on Practice Guidelines (Writing Committee to Revise the ACC/AHA/NASPE 2002 Guideline Update for Implantation of Cardiac Pacemakers and Antiarrhythmia Devices); American Association for Thoracic Surgery; Society of Thoracic Surgeons. ACC/AHA/HRS 2008 Guidelines for Device-Based Therapy of Cardiac Rhythm Abnormalities: a report of the American College of Cardiology/American Heart Association Task Force on Practice Guidelines (Writing Committee to Revise the ACC/AHA/NASPE 2002 Guideline Update for Implantation of Cardiac Pacemakers and Antiarrhythmia Devices): developed in collaboration with the American Association for Thoracic Surgery and Society of Thoracic Surgeons. Circulation. 2008;117:e350–408.
5 Schaer B, Kühne M, Koller MT, Sticherling C, Osswald S. Therapy with an implantable cardioverter defibrillator (ICD) in patients with coronary artery disease and dilated cardiomyopathy: benefits and disadvantages. Swiss Med Wkly. 2009;139:647–53.
6 Fishman GI, Chugh SS, Dimarco JP, Albert CM, Anderson ME, Bonow RO, et al. Sudden cardiac death prediction and prevention: report from a National Heart, Lung, and Blood Institute and Heart Rhythm Society Workshop. Circulation. 2010;122:2335–48.
7 Bigger JT Jr, Fleiss JL, Kleiger R, Miller JP, Rolnitzky LM. The relationships among ventricular arrhythmias, left ventricular dysfunction, and mortality in the 2 years after myocardial infarction. Circulation. 1984;69:250–8.
8 Gomes JA, Winters SL, Stewart D, Horowitz S, Milner M, Barreca P. A new noninvasive index to predict sustained ventricular tachycardia and sudden death in the first year after myocardial infarction: based on signal-averaged electrocardiogram, radionuclide ejection fraction and Holter monitoring. J Am Coll Cardiol. 1987;10:349–57.
9 Schoenenberger AW, Kobza R, Jamshidi P, Zuber M, Abbate A, Stuck AE, et al. Sudden cardiac death in patients with silent myocardial ischemia after myocardial infarction (from the Swiss Interventional Study on Silent Ischemia Type II [SWISSI II]). Am J Cardiol. 2009;104:158–63.
10 Schoenenberger AW, Erne P, Ammann S, Gillmann G, Kobza R, Stuck AE. Prediction of arrhythmic events after myocardial infarction based on signal-averaged electrocardiogram and ejection fraction. Pacing Clin Electrophysiol. 2008;31:221–8.
11 Altmann DR, Mutschelknauss M, Ehl N, Koller M, Schaer B, Jörg L, et al. Prevalence of severely impaired left ventricular ejection fraction after reperfused ST-elevation myocardial infarction. Swiss Med Wkly. 2013;143:w13869.
12 Berdajs D, Marinakis S, Kessler U, Muradbegovic M, Ferrari E, von Segesser LK. Impaired left ventricular function as a predictive factor for mid-term survival in octogenarians after primary coronary artery bypass surgery. Swiss Med Wkly. 2012;142:w13704.
13 Wedensky NE. Über die Beziehung zwischen Reizung und Erregung im Tetanus. Ber Akad Wiss (St. Petersburg) 1886;54:96. German.
14 Castellanos A, Jr, Lemberg L, Johnson D, Berkovits BV. The Wedensky effect in the human heart. Br Heart J. 1966;28:276–83.
15 Amlie JP, Hoium H, Mathisen P, Malik M, Brady PA. The Wedensky test predicts malignant ventricular arrhythmias after myocardial infarction. Scand Cardiovasc J. 2013;47:256–62.
16 Hnatkova K, Ryan SJ, Hoium HH, Malik M. Noninvasive assessment of Wedensky modulated signal-averaged electrocardiograms. Pacing Clin Electrophysiol. 2000;23:1977–80.
17 Hnatkova K, Ryan SJ, Bathen J, Hoium HH, Malik M. Non-invasive Wedensky modulation within the QRS complex. Med Biol Eng Comput. 2002;40:234–40.
18 Elgarhi N, Kreuz J, Balta O, Nickenig G, Hoium H, Lewalter T, et al. Significance of Wedensky Modulation testing in the evaluation of non-invasive risk stratification for ventricular tachyarrhythmia in patients with coronary artery disease and implantable cardioverter-defibrillator. Heart. 2008;94:e16.
19 Goupillaud P, Grossman A, Morlet J. Cycle-Octave and Related Transforms in Seismic Signal Analysis. Geoexploration. 1984;23:85–102.
20 Morlet D, Peyrin F, Desseigne P, Touboul P, Rubel P. Wavelet analysis of high-resolution signal-averaged ECGs in postinfarction patients. J Electrocardiol. 1993;26:311–20.
21 Hinkle LE Jr, Thaler HT. Clinical classification of cardiac deaths. Circulation. 1982;65:457–64.
22 Pregibon, D. Logistic regression diagnostics. Ann Stat. 1981:9:705–24.
23 Lee ET, Wang JW. Statistical methods for survival data analysis, 3rd ed. New York, John Wiley & Sons, 2003.
24 Vittinghoff E, McCulloch CE. Relaxing the rule of ten events per variable in logistic and Cox regression. Am J Epidemiol. 2007;165:710–8.