Computed tomography findings in liver fibrosis and cirrhosis
DOI: https://doi.org/10.4414/smw.2014.13923
Adrian
Huber, Lukas
Ebner, Matteo
Montani, Nasser
Semmo, Kingshuk
Roy Choudhury, Johannes
Heverhagen, Andreas
Christe
Summary
PRINCIPLES: Computed tomography (CT) is inferior to the fibroscan and laboratory testing in the noninvasive diagnosis of liver fibrosis. On the other hand, CT is a frequently used diagnostic tool in modern medicine. The auxiliary finding of clinically occult liver fibrosis in CT scans could result in an earlier diagnosis. The aim of this study was to analyse quantifiable direct signs of liver remodelling in CT scans to depict liver fibrosis in a precirrhotic stage.
METHODS: Retrospective review of 148 abdominal CT scans (80 liver cirrhosis, 35 precirrhotic fibrosis and 33 control patients). Fibrosis and cirrhosis were histologically proven. The diameters of the three main hepatic veins were measured 1–2 cm before their aperture into the inferior caval vein. The width of the caudate and the right hepatic lobe were divided, and measured horizontally at the level of the first bifurcation of the right portal vein in axial planes (caudate-right-lobe ratio). A combination of both (sum of liver vein diameters divided by the caudate-right lobe ratio) was defined as the ld/crl ratio. These metrics were analysed for the detection of liver fibrosis and cirrhosis.
RESULTS: An ld/crl-r <24 showed a sensitivity of 83% and a specificity of 76% for precirrhotic liver fibrosis. Liver cirrhosis could be detected with a sensitivity of 88% and a specificity of 82% if ld/crl-r <20.
CONCLUSION: An ld/crl-r <24 justifies laboratory testing and a fibroscan. This could bring forward the diagnosis and patients would profit from early treatment in a potentially reversible stage of disease.
Introduction
Liver cirrhosis is the final consequence of all chronic liver diseases [1]. Most common causes are alcoholic fatty liver disease (AFLD), nonalcoholic fatty liver disease (NAFLD) and viral hepatitis [2, 3]. Chronic inflammation leads to potentially reversible liver fibrosis and ends in irreversible cirrhosis with cross-linked collagen and regenerative nodules [4]. Early diagnosis improves the benefit of therapeutic strategies before the development of irreversible and potentially lethal complications such as loss of liver function, oesophageal variceal bleeding, hepatic encephalopathy and hepatocellular carcinoma [5, 6].
The noninvasive diagnosis of liver fibrosis and cirrhosis is built on laboratory testing and the well-established fibroscan [7]. Recently, new sensitive methods using magnetic resonance imaging (MRI) have been described, such as MR-elastography [8], double contrast-enhanced MRI [9] and diffusion weighted MRI [10]). Computed tomography (CT) is useful for imaging liver cirrhosis complications, such as portosystemic collaterals with bleeding or hepatocellular carcinoma (HCC). However, this is not an appropriate method for the primary diagnosis of liver fibrosis, because of the radiation dose and inferior accuracy compared to the fibroscan. On the other hand, clinically occult liver fibrosis as an auxiliary finding in routine abdominal CT scans is underdiagnosed. Even liver cirrhosis has a mediocre sensitivity (77.1%–84.3%) and specificity (52.9%–67.6%) in CT [11]. However, since CT is an important and frequently used diagnostic tool in modern medicine, an accurate method to detect liver fibrosis in CT scans could bring forward the diagnosis and enable treatment in an early stage of fibrosis before its clinical appearance.
We hypothesise that indirect findings of liver remodelling occur rather late when chronic portal hypertension has already been established (e.g. splenomegaly, gastrointestinal wall thickening, portosystemic collaterals, recanalisation of the umbilical vein and ascites [12–14]).
Qualitative direct signs of liver remodelling (atrophy of the right liver lobe with a notch between right and caudate lobe, heterogeneity of liver parenchyma, nodular surface, blunt liver edge and enlarged gall bladder fossa [12–14]) are limited parameters as a result of subjective reader impression and experience.
Thus, we propose the use of quantifiable direct signs of hepatic remodelling which are assessable in axial planes without the need for time-consuming image reconstructions.
There are two interesting metrics for direct liver remodelling: the caudate-right lobe ratio (crl-r) [18], which describes the width of the caudate lobe in proportion to the width of the right hepatic lobe, and measurement of the hepatic vein diameters [19]. We hypothesise that these metrics correlate with early liver fibrosis in a precirrhotic stage and can be used as quantifiable markers to depict liver fibrosis in abdominal CT scans. An analysis of these metrics alone and in combination for the detection of liver fibrosis was performed, as was a comparison with other qualitative and quantitative imaging findings.
Patients and methods
Patient population:
A total of 148 patients (108 male/40 female) were retrospectively included between January 2009 and March 2012 at our hospital, including 80 patients with histologically proven liver cirrhosis (fibrosis stage 4), 35 with histologically proven precirrhotic liver fibrosis stage 1–3 and a control group of 33 trauma patients without known liver pathology. The mean age of all selected patients was 57.3 years (range: 32–75 years). Informed consent was not required owing to the retrospective nature of this study.

Figure 1
Patient population. Abdominal computed tomography scans of 148 patients were retrospectively analysed. Included were 80 patients with liver cirrhosis, 35 patients with earlier liver fibrosis and 33 control patients without known liver disease.
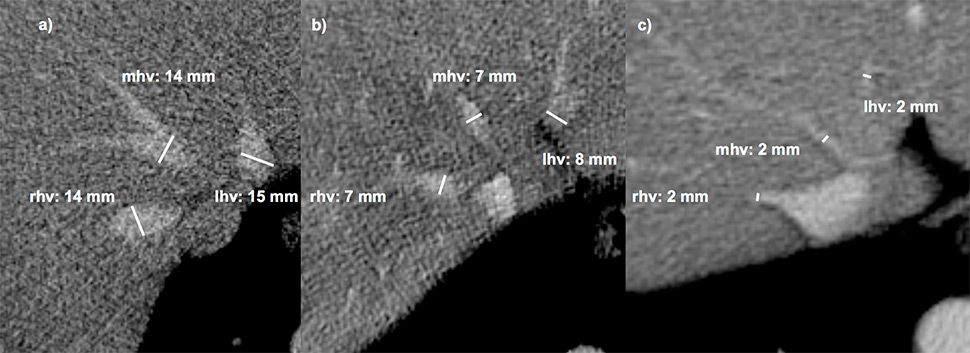
Figure 2
Measurement of the hepatic veins. The three main hepatic veins were measured 1–2 cm before their aperture into the inferior caval vein. Accessory veins were not included. (a) normal liver,(b) liver fibrosis grade 2, (c): liver cirrhosis Child b.
rhv, mhv, lhv = right, middle and left hepatic vein diameters.
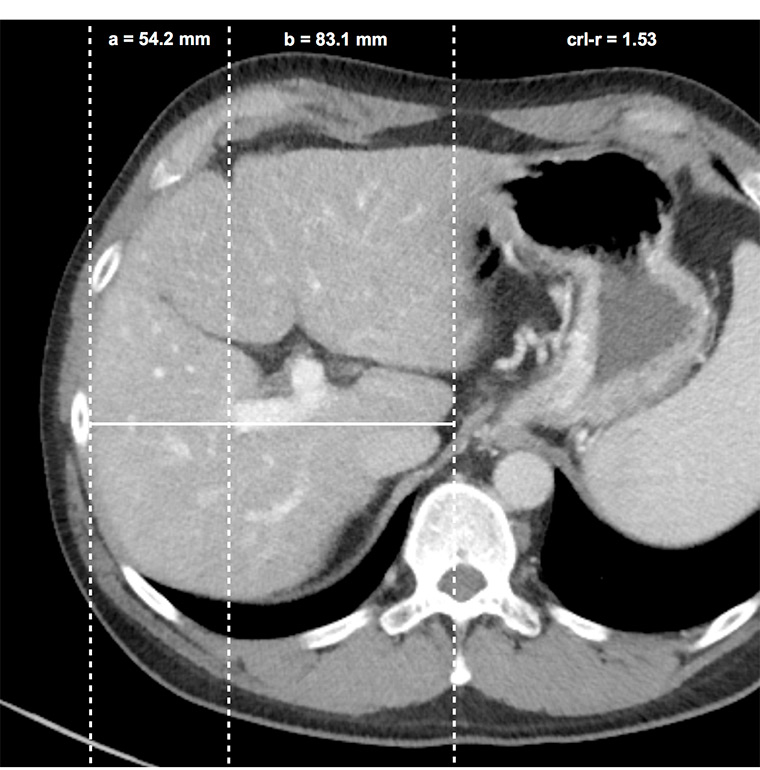
Figure 3
Caudate right-lobe ratio (crl-r) in a patient with liver fibrosis. In axial planes distances of the right lateral border of the right portal vein bifurcation to the lateral margin of the right hepatic lobe (a) and to the most medial margin of the caudate lobe (b) are measured in an exactly horizontal direction. The two distances were divided b / a (caudate lobe / right lobe) and defined as the caudate-right-lobe ratio (crl-r).
The 80 patients (59 male/21 female) with liver cirrhosis (29 Child A, 31 Child B, 30 Child C) and the 35 patients with precirrhotic stage of liver fibrosis (6 fibrosis grade 1, 10 fibrosis grade 2 and 19 fibrosis grade 3) were included if they had undergone a CT scan with portal venous phase in the radiological information system (Centricity RISi 4.1, GE Healthcare) of our hospital. Liver fibrosis and cirrhosis was histologically proven by intercostal percutaneous biopsy from the right liver lobe with the “Menghini-technique” with pre- and post-procedural sonographic checks. Patients who had undergone an earlier partial liver resection or liver transplantation or those who had a transjugular portosystemic shunt (TIPS) were excluded.
Reasons for the abdominal CT scans were as follows (cirrhosis group/precirrhotic fibrosis group): HCC (40/18), tumour other than HCC (9/6), portal vein thrombosis (8/0), abscess (6/4), bleeding (7/0), acute abdomen (4/2), pancreatitis (3/3), trauma (2/1), abdominal hernia (1/0) and portal vein thrombosis (0/1).
The control group consisted of 33 consecutively selected trauma patients (23 male/10 female) with a mean age of 58.4 years (range: 51–70 years) who were examined with a portal venous phase abdominal CT scan. Patients with liver laceration, known liver fibrosis or cancer, and patients receiving potentially hepatotoxic medication were excluded. A summary of the patient population is shown in figure 1.
The clinical records of all patients in the fibrosis/cirrhosis group were surveyed. The aetiology of fibrosis was as follows: AFLD in 42 patients (37%), viral hepatitis in 45 patients (39%), NAFLD in 11 patients (10%), haemochromatosis in 5 patients (4%) and alpha-1–antitrypsin deficiency (A1AD) in 2 patients (2%). Aetiology of the fibrosis was unknown in 10 patients (9%).
Pathological correlation / histological review
The surgical pathologist routinely distinguishes between patterns of pericentral predominant fibrosis (e.g. in AFLD/NAFLD fibrosis/cirrhosis) [4] and periportal predominant fibrosis (e.g. in chronic viral hepatitis, autoimmune hepatitis or biliary disease induced fibrosis/cirrhosis) [20]. The fibrotic stage was assessed by histological criteria: METAVIR (F 1–4) for periportal predominant fibrosis [21] and as reported by Brunt et al. (B 1–4) for pericentral predominant fibrosis [22]. Since the two staging systems differ only in the fibrosis pattern depending on fibrosis aetiology, the resultant data are comparable in terms of fibrosis severity (both stage 1–4). Fibrosis stage 4 is equal to liver cirrhosis.
A board certified pathologist with 10 years of experience in liver histology re-evaluated all of the specimens where no original histological record was at hand.
CT imaging technique and measurements
Images of all 148 patients (80 cirrhosis, 35 precirrhotic fibrosis and 33 control patients) were acquired by a 64–row-CT-unit Somatom Sensation 64 (24 x 1.2 mm, pitch 0.8, slice 1.5/5 mm, Siemens, Erlangen, Germany). Exclusively, 5-mm axial CT slices of portal-venous abdominal CT-scans were used. The scans were systematically reviewed in consensus by two radiologists with 2 and 10 years of experience in abdominal imaging, who were blinded to any clinical and imaging results or histological fibrosis stage. The diameters of the three main liver veins were measured 1–2 cm before their aperture into the inferior caval vein (fig. 2) and added to give a sum (ld-score). Accessory hepatic vein branches were not measured. The caudate-right lobe ratio (crl-r) was calculated as described by Awaya et al. [18]. Distance from the right lateral border of the first bifurcation of the right portal vein to the medial border of the caudate lobe and to the lateral border of the right liver lobe were divided as illustrated in figure 3.
For a combination of both, two scores were calculated: ld/crl-r (sum of the three main liver diameters divided by the caudate-right lobe ratio) and rhvd/crl-r (right hepatic vein diameter divided by the caudate-right lobe ratio).
In addition, the maximum diameter of the portal vein and the maximum splenic diameter in a strictly axial plane were measured. The presence of hepatic surface nodularity, ascites and portosystemic collaterals was also captured.
Statistical analysis
Boxplots were used to compare the distribution of each sign across Child classifications, fibrotic and control groups. Average diameters and the sum of the veins were calculated using the formulae described above. The ld/crl-r was defined as the sum of the veins divided by the caudate-right lobe ratio. Receiver operating characteristic (ROC) curves for fibrosis and cirrhosis were calculated for each sign, ratio and score. The area under the curve of the ROC-analysis was used to rank the signs for fibrosis and cirrhosis individually. Threshold levels for all findings were determined individually for fibrosis and cirrhosis to maximise sensitivity and specificity. ROC-Curves were compared applying the pairwise comparison of the area under the curve. The standard errors of the areas under the curves provided the significance level, which equalled the probability of the hypothesis that the difference between the two areas under the curve is zero.
Visual correlation between the signs and scores was explored using pairwise scatterplots. Based on this knowledge, we designed an improved prediction rule for cirrhosis using linear discriminant analysis (LDA), which looks for a linear combination of predictors to best separate the disease classification groups [23]. Plots and statistical analysis were performed on the R statistical software platform [24]. Chi-square test was used to find specific CT signs for each aetiology. A p-value <0.05 was considered significant.
Results
CT findings suggesting fibrosis/cirrhosis:
Except for the portal vein diameter, univariate boxplots of all quantifiable findings such as liver vein diameters, caudate-right lobe ratio, including the ratio of both, and the splenic diameter, demonstrated a clear discrimination between normal and cirrhotic liver. A differentiation between the three Child-Pugh stages was never apparent using CT findings. Also, there was no clear visual differentiation between fibrosis and normal or cirrhotic liver; the fibrosis group always ranged between the two groups. Pairwise plots of these predictor variables suggested a possible distinction between the groups for most variable pairs: the precirrhotic fibrosis group always ranged between the control group and the cirrhosis group, legitimising a combined prediction (see below). All 95% confidence intervals of areas under the curve (AUCs) and p-values are listed in table 1.

Figure 4
Receiver operating characteristic curves of the cirrhosis group (black) and the fibrosis group (gray) demonstrated highest AUC for ld/crl-r.
AUC = area under the curve; spl dia = splenic diameter; pv dia = portal vein diameter; crl-r = caudate-right lobe ratio; ld score = sum of liver veins diameter; rhv dia, mhv dia, lhv dia = right, middle and left hepatic vein diameters; ld/crl-r = ld score divided by crl/r
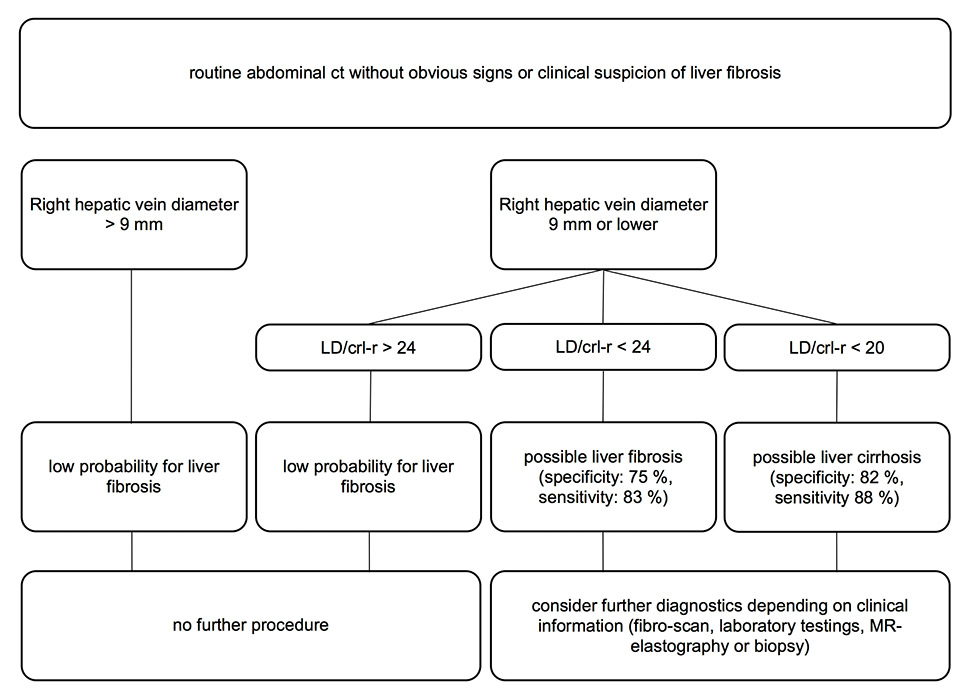
Figure 5
Possible work-up procedure for routine abdominal diagnostic examinations of patients without any suspicion of liver fibrosis. Increasing the right vein diameter threshold from 0.7 to 0.9 cm increased the sensitivity for fibrosis from 69% to 90% and prevented the exclusion of too many false-negative patients.
ct = computed tomography; MR = magnetic resonance; crl-r = caudate-right lobe ratio; LD score = sum of liver vein diameters; LD/crl-r = LD score divided by crl-r
Cirrhotic liver
Area under the ROC curve for most predictors ranged between 0.82 and 0.88, except for measurement of the portal vein diameter, which showed a much lower AUC for cirrhosis of 0.64 (fig. 4). Liver vein diameters were better predictors (AUC: 0.82–0.88) than the caudate-right lobe ratio (0.82). The combination of both (ld/crl-r) scored the highest AUC (0.89) and is, therefore, considered the best quantifiable radiological sign to distinguish between cirrhotic and normal liver. The second best predictor for cirrhosis was the sum of all vein diameters (AUC = 0.88) and splenic diameter (AUC = 0.88), followed by the right (AUC = 0.86), the left vein diameter (AUC = 0.85) and the caudate-right-lobe ratio (AUC = 0.82).
Qualitative signs such as liver surface nodularity, ascites and collateral vessels demonstrated high specificity (100%, 82% and 100%, respectively) and lower sensitivity (58%, 91% and 72%, respectively). When the predictors were compared with the ld/crl-r, some variables tested significantly inferior: portal diameter, ascites, caudate-right-lobe ratio and middle hepatic vein diameter showed a p-value below 0.05 (table 1).
Precirrhotic fibrotic liver
The AUC for fibrosis was always lower than the AUC for cirrhosis and ranged from 0.71 to 0.82, except for portal vein diameter (0.58) (fig. 4). The best sign for liver fibrosis was also the ld/crl-r score (AUC = 0.82), followed by the sum of vein diameters (AUC = 0.79) and the left hepatic vein diameter (AUC = 0.77). Splenic diameter (AUC = 0.76) was better than caudate-right lobe ratio (AUC = 0.72). A significant difference compared with the ld/crl-r could be shown for portal vein diameter, collaterals, ascites and middle hepatic vein (table 1). Qualitative signs such liver surface nodularity, ascites and collateral vessels demonstrated high specificity (100%, 82% and 100%, respectively) and rather low sensitivity (58%, 34% and 38%, respectively).
Threshold-based sensitivity and specificity
The threshold values showed the greatest accuracy for a combination of the sum of the three main liver vein diameters and the caudate-right lobe ratio. An ld/crl-r score ≤19.6 identified cirrhosis with a sensitivity of 88% and a specificity of 82%. An ld/crl-r score ≤23.9 was the threshold for fibrosis with a sensitivity of 83% and a specificity of 76%. A combined variable of the right hepatic vein diameter and the crl-r (rhvd/crl-r) was slightly inferior, especially for the fibrosis group (table 2).
The sum of the three main liver vein diameters (ld score) demonstrated a higher sensitivity but a lower specificity than the crl-r. If only one hepatic vein diameter was measured, the diameter of the right hepatic vein showed the highest accuracy for cirrhosis and the left hepatic vein demonstrated the highest accuracy for fibrosis (table 2).
Fibrotic versus cirrhotic liver
To differentiate between cirrhotic and fibrotic liver, qualitative variables are superior to quantifiable variables. The highest AUC of ROC was found for collaterals (0.73), followed by nodular liver surface (AUC = 0.68) and ascites (AUC = 0.66). The quantifiable variables and scores demonstrated inferior AUC between 0.59 and 0.69 compared with the predictor collaterals (p-value: 0.059‒0.58) (table 1).
Aetiology of liver fibrosis/cirrhosis and specific CT findings
There was no significant difference between the cirrhosis aetiologies and the imaging findings, except for ascites, which was more frequently found in the alcoholic cirrhosis group (p-value = 0.045).
Combined prediction
The weighted sum of the best individual predictor variables for cirrhosis was used to analyse the combined prediction:
– combvar = -0.015 * ld/crl-r + 0.215 * crl-r – 0.045 * ld-score + 0.66 * ascites (1 = y/0 = n) + 0.819 * nodular liver surface (1 = y/0 = n) + 1.905 * collaterals (1 = y/0 = n).
This combined variable reached a sensitivity of 94% and a specificity of 100% for cirrhosis. This means that a mathematical combination of all evaluated imaging findings could identify liver cirrhosis in abdominal CT scans in 94 out of 100 cases with almost no false positive results.
|
Table 1:Quantitative and qualitative computed tomographysigns for the fibrosis and cirrhosis groups. Threshold levels, sensitivity and specificity for fibrosis and cirrhosis (with 95% confidence intervals). |
| |
cirrhotic versus normal liver (signs of cirrhosis) |
fibrotic versus normal liver (signs of fibrosis) |
cirrhotic versus fibrotic liver |
| |
AUC |
95%-CI |
p-value |
AUC |
95%-CI |
p-value |
AUC |
95%-CI |
p-value |
| rhvd |
0.86 |
0.79-0.93 |
0.102 |
0.74 |
0.62-0.85 |
0.147 |
0.64 |
0.54-0.73 |
0.438 |
| mhvd |
0.81 |
0.73-0.88 |
0.024 |
0.71 |
0.58-0.82 |
0.039 |
0.62 |
0.52-0.71 |
0.128 |
| lhvd |
0.85 |
0.77-0.91 |
0.102 |
0.77 |
0.65-0.87 |
0.388 |
0.62 |
0.53-0.71 |
0.136 |
| ld |
0.88 |
0.80-0.93 |
0.291 |
0.79 |
0.67-0.89 |
0.548 |
0.65 |
0.55-0.74 |
0.269 |
| crl-r |
0.82 |
0.73-0.88 |
0.028 |
0.72 |
0.59-0.82 |
0.081 |
0.66 |
0.57-0.75 |
0.281 |
| ld/crl-r |
0.89 |
0.85-0.96 |
n/a |
0.82 |
0.70-0.90 |
n/a |
0.69 |
0.60-0.78 |
0.584 |
| rhvd/crl-r |
0.89 |
0.84-0.95 |
0.739 |
0.79 |
0.67-0.88 |
0.353 |
0.67 |
0.58-0.76 |
0.465 |
| splenic diameter |
0.88 |
0.80-0.93 |
0.491 |
0.76 |
0.64-0.86 |
0.46 |
0.66 |
0.57-0.75 |
0.285 |
| portal diameter |
0.64 |
0.55-0.73 |
< 0.0001 |
0.58 |
0.45-0.70 |
0.006 |
0.59 |
0.50-0.68 |
0.059 |
| ascites |
0.78 |
0.69-0.85 |
0.025 |
0.55 |
0.42-0.68 |
0.002 |
0.66 |
0.57-0.75 |
0.29 |
| collaterals |
0.86 |
0.78-0.92 |
0.301 |
0.58 |
0.45-0.71 |
0.004 |
0.73 |
0.64-0.81 |
n/a |
| liver nodularity |
0.87 |
0.80-0.93 |
0.423 |
0.69 |
0.56-0.80 |
0.122 |
0.68 |
0.58-0.76 |
0.393 |
| crl-r = caudate-right-lobe ratio; ld score = sum of liver vein diameters; lhvd, mhvd, rhvd = left, middle and right hepatic vein diameter; ld/crl-r = ld score divided by crl-r; rhvd/crl-r = rhvd divided by crl-r
Combined variable: all signs were considered and were fitted into one variable value optimised for cirrhosis |
|
Table 2: Best predictors according to highest area under the curve (receiver operating characteristic). |
|
|
Fibrosis
|
Cirrhosis
|
|
|
threshold |
sensitivity |
specificity |
threshold |
sensitivity |
specificity |
| ld/crl-r |
≤ 23.9 |
83% (64.2-94.1) |
76% (57.7-88.9) |
≤ 19.6 |
88% (79.6-94.3) |
82% (61.1-91.0) |
| rhvd/crl-r |
≤ 6.8 |
72% (52.8-87.2) |
79% (61.1-91.0) |
≤ 6.17 |
84% (74.2-90.8) |
85% (68.1-94.8) |
| ld-score |
≤ 20 |
72% (52.8-87.2) |
76% (57.7-88.9) |
≤ 20 |
87% (78.3-93.4) |
76% (57.7-88.9) |
| rhvd |
≤ 6 |
69% (49.2-87.2) |
76% (57.7-88.9) |
≤ 6 |
84% (74.2-90.8) |
76% (57.7-88.9) |
| mhvd |
≤ 5 |
55% (35.7-73.5) |
82% (64.5-93) |
≤ 6 |
85% (75.5-91.7) |
64% (45.1-79.6) |
| lhvd |
≤ 6 |
69% (49.2-84.7) |
73% (54.5-86.7) |
≤ 5 |
71% (59.7-80.0) |
82% (64.5-93.0) |
| crl-r |
> 0.93 |
62% (42.3-79.3) |
79% (61.1-91.0) |
> 0.98 |
71% (60.1-80.2) |
85% (68.1-94.8) |
| splenic diameter |
> 11.4 |
65% (45.7-82.0) |
91% (75.6-98.0) |
≥ 11.4 |
78% (67.7-86.1) |
91% (75.6-98.0) |
| ascites |
1 |
10% (2.3-27.4) |
100% (89.3-100) |
1 |
58% (47-68.7) |
100% (89.3-100) |
| collaterals |
1 |
34% (18-54.3) |
82% (64.5-93.0) |
1 |
91% (82.5-95.9) |
82% (64.5-93.0) |
| liver nodularity |
1 |
38% (20.7-57.7) |
100% (89.3-100) |
1 |
72% (61.4-81.2) |
100% (89.3-100) |
| portal diameter |
> 14 |
45% (26.5-64.3) |
85% (68.1-94.8) |
> 14 |
40% (28.4-50) |
85% (68.1-94.8) |
| combined variable |
> -2.4 |
97% (82.2-99.4) |
58% (39.2-74.5) |
> 1.4 |
94% (86.9-98.1) |
100% (89.3-100) |
| AUC = area under the curve; CI = confidence interval; crl-r = caudate-right-lobe ratio; ld score = sum of liver vein diameters; lhvd, mhvd, rhvd = left, middle and right hepatic vein diameter; ld/crl-r = ld score divided by crl-r; rhvd/crl-r = rhvd divided by crl-r
p-values are for comparisons with the variable with the highest AUC entry (highest AUC entry and significant difference highlighted) |
Discussion
The best predictor to detect liver fibrosis was a combination of the liver vein diameters and the caudate-right-lobe ratio (ld/crl-r). This ratio is calculated by adding the diameter of the three main liver veins 1–2 cm away from the inferior caval vein (fig. 2) and dividing this sum by the caudate-right lobe ratio (fig. 3).
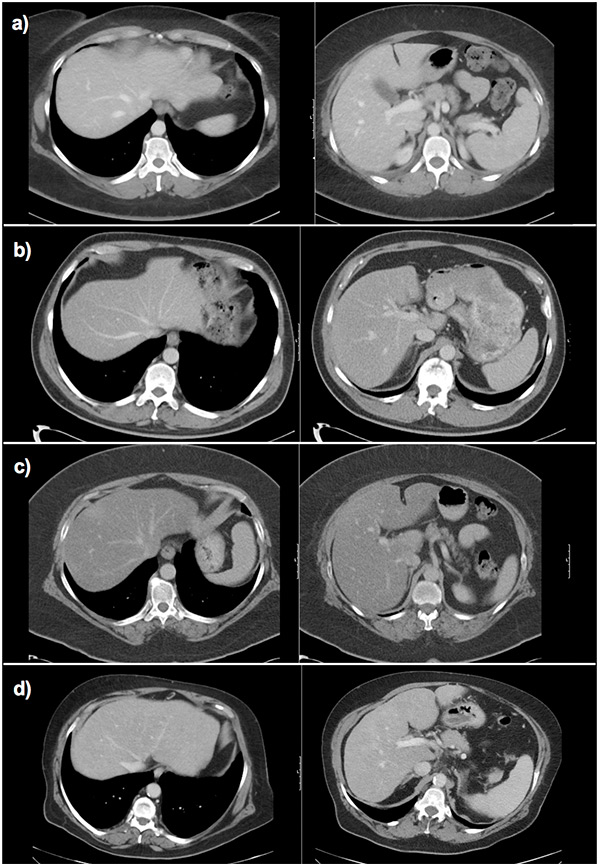
Figure 6
Fibrosis assessment with the ld/crl ratio in different patients.
a) Normal liver: wide hepatic veins, caudate lobe smaller than right liver lobe on visual impression. Calculation of the ld/crl-r not mandatory (ld: 2.5 cm, crl-r: 0.75, ld/crl-r: 33.2).
b) Hepatitis C fibrosis grade 1: small hepatic veins, caudate lobe width similar to right hepatic lobe width on visual impression, calculation of the ld/crl-r recommended (ld: 1.5 cm, crl-r: 0.78, ld/crl-r: 19.2).
c) Nonalcoholic steatohepatitis fibrosis grade 1: small hepatic veins, caudate lobe width similar to right hepatic lobe width on visual impression, calculation of the ld/crl-r recommended (ld: 1.6 cm, crl-r: 0.79, ld/crl-r: 20.2).
d) Alcoholic steatohepatitis cirrhosis: very small hepatic veins, caudate lobe width similar to right hepatic lobe width on visual impression, calculation of the ld/crl-r recommended (ld: 1.4 cm, crl-r: 1.1, ld/crl-r: 12.7).
crl-r = caudate-right lobe ratio; ld score = sum of liver vein diameters; ld/crl-r = ld score divided by crl-r
An ld/crl-r of <20 showed a sensitivity of 88% and a specificity of 82% for liver cirrhosis, which is higher than that of other published CT signs for liver cirrhosis [11]. CT findings for liver fibrosis in a precirrhotic stage (f1–f3) have not been well investigated until now. With an ld/crl-r ratio of <24 it is possible to detect precirrhotic liver fibrosis with a sensitivity of 83% and a specificity of 76%.
If the ld/crl-r ratio was calculated in every routine CT, liver fibrosis as a tentative diagnosis would justify laboratory testing and a fibroscan in these patients and bring forward diagnosis. To optimise this fibrosis assessment, a possible work-up procedure is shown in figure 5, which would take about 2 minutes with a calculator at hand. Another, more pragmatic possibility would be to calculate the ld/crl-r only if the liver veins appear small or if the caudate lobe appears almost as broad as the right hepatic lobe on a subjective visual impression (fig. 6). Measurement of the ld/crl-r is also possible with MRI and b-mode sonography, even if exact reproduction of the axial plane on the level of the right portal vein bifurcation is challenging in sonography.
Not all of the tested imaging findings were statistically significantly inferior to the ld/crl-r. While the crl-r was significantly inferior for cirrhosis (p = 0.028), it was not for fibrosis (p = 0.081). The sum of the liver vein diameters (ld) was also a good predictor alone and not significantly inferior to the combined ld/crl-r radio for cirrhosis (p = 0.291) and fibrosis (p = 0.548).
The high specificity of the splenic diameter for liver fibrosis is probably a bias, because patients with other conditions causing splenomegaly were not included in this study (e.g. right heart failure, multiple viral infections, lymphoma, and myeloproliferative and dysplastic diseases). However, the sensitivity of 62% of the splenic diameter for fibrosis is rather low compared with the ld/crl-r (83%).
The portal vein diameter is a poor predictor to assess liver fibrosis, as previously reported [25].
All of the measured parameters for precirrhotic liver fibrosis were between the healthy control group and the liver cirrhosis group. This is not surprising, since liver fibrosis is a continuously ongoing condition ending in irreversible end-stage liver cirrhosis [4]. As already reported for other diagnostic tools such as sonographic elastography [26], differentiating normal liver from early fibrosis (f1–2) is more challenging than differentiating normal liver from f3 stages and cirrhosis (f4). The patient population was not big enough in this study to differentiate significantly between the histological grades. However, there was a sufficient differentiation between normal liver and fibrosis (f1–3) as well as normal liver and cirrhosis (f4).
Qualitative signs of liver conversion, such as hepatic surface nodularity, the right posterior notch sign, blunt edge of the liver, ascites and portosystemic collateral vessels, showed a high specificity if positive but a small sensitivity in precirrhotic fibrosis. They are not helpful for detecting early liver fibrosis, since they develop late in the fibrosis/cirrhosis sequence. Thus, the later these variables appear, the stronger the discrimination between precirrhotic fibrosis and cirrhosis will be. Therefore, we can hypothesise that the portal vein dilatation develops first with a low discrimination potential, followed by splenic diameter, ascites and liver nodularity. The last to appear seem to be the collaterals, which are the best discriminators.
Theoretically, a combination of all of the analysed imaging findings could be performed with a sensitivity of 93% and a specificity of 100% to detect liver cirrhosis (table 2). However, because of the complexity of such a score, this is more of academic interest than practicable in clinical routine.
Ascites in our cohort occurred significantly more frequently in alcohol-induced liver fibrosis than in other cirrhosis aetiologies. Another correlation of fibrosis aetiology and the investigated imaging findings was not evident. A correlation of enlargement of the caudate lobe in alcohol-induced cirrhosis compared to viral-induced cirrhosis as described by Okazaki et al. [27] was not reproducible.
A major limitation of this study is the retrospective single-centre design. Larger studies, eventually with a prospective study design, will be necessary to confirm these results. This could also rule out other possible circumstances leading to a low hepatic vein diameter, for example acute hepatitis without fibrosis. However, a coexisting active hepatitis was not detected by the pathologist in any fibrosis specimens used for this study. In addition, the probability of hepatic remodelling and thus alteration of the caudate-right-lobe ratio as a result of acute hepatitis is low. Another limitation is the disregard of a possible impact of cardiovascular factors such as blood pressure and hydration of the patients on the hepatic vein diameters, which have not been considered in this study. However, it is the control group with the trauma patients who seem to be more prone to false low hepatic vein diameters due to possible hypotension and low hydration.
Conclusion
A combination of the three major hepatic vein diameters and the caudate-right-lobe ratio (ld/crl-r) was the most powerful method to detect liver fibrosis in CT images, even in a precirrhotic stage of the disease. In any abdominal CT, performed for reasons other than liver fibrosis, laboratory testing and a fibroscan are justified when the ld/crl-r ratio is smaller than 24. This could bring forward diagnosis and patients would profit from early treatment in a potentially reversible stage of disease.
References
1 Poynard T, Mathurin P, Lai C-L, Guyader D, Poupon R, Tainturier M-H, et al. A comparison of fibrosis progression in chronic liver diseases. J Hepatol. 2003;38(3):257–65.
2 Schuppan D, Afdhal NH. Liver cirrhosis. Lancet. 2008;371(9615):838–51.
3 Farrell GC, Larter CZ. Nonalcoholic fatty liver disease: From steatosis to cirrhosis. Hepatology. 2006;43(S1):S99–S112.
4 Flier JS, Underhill LH, Friedman SL. The Cellular Basis of Hepatic Fibrosis – Mechanisms and Treatment Strategies. N Engl J Med. 1993;328(25):1828–35.
5 Gentilini P, Laffi G, La Villa G, Romanelli RG, Buzzelli G, Casini-Raggi V, et al. Long course and prognostic factors of virus-induced cirrhosis of the liver. Am J Gastroenterol. 92(1):66–72.
6 Garcia-Tsao G. Current management of the complications of cirrhosis and portal hypertension: variceal hemorrhage, ascites, and spontaneous bacterial peritonitis. Gastroenterol. 2001;120(3):726–48.
7 Sandrin L, Fourquet B, Hasquenoph JM, Yon S, Fournier C, Mal F, et al. Transient elastography: a new noninvasive method for assessment of hepatic fibrosis. Ultrasound Med Biol. 2003;29(12):1705–13.
8 Rustogi R, Horowitz J, Harmath C, Wang Y, Chalian H, Ganger DR, et al. Accuracy of MR elastography and anatomic MR imaging features in the diagnosis of severe hepatic fibrosis and cirrhosis. J Magn Reson Imag. 2012;35(6):1356–64.
9 Faria SC, Ganesan K, Mwangi I, Shiehmorteza M, Viamonte B, Mazhar S, et al. MR imaging of liver fibrosis: current state of the art. Radiographics. 2009;29(6):1615–35.
10 Taouli B, Tolia AJ, Losada M, Babb JS, Chan ES, Bannan MA, et al. Diffusion-Weighted MRI for Quantification of Liver Fibrosis: Preliminary Experience. AJR. 2007;189(4):799–806.
11 Kudo M, Zheng RQ, Kim SR, Okabe Y, Osaki Y, Iijima H, et al. Diagnostic accuracy of imaging for liver cirrhosis compared to histologically proven liver cirrhosis. Intervirology. 2008;51(1):17–26.
12 Brown JJ, Naylor MJ, Yagan N. Imaging of hepatic cirrhosis. Radiology. 1997;202(1):1–16.
13 Gupta D, Chawla YK, Dhiman RK, Suri S, Dilawari JB. Clinical significance of patent paraumbilical vein in patients with liver cirrhosis. Digest Dis Sci. 2000;45(9):1861–4.
14 Karahan OI, Dodd GD, Chintapalli KN, Rhim H, Chopra S. Gastrointestinal Wall Thickening in Patients with Cirrhosis: Frequency and Patterns at Contrast-Enhanced CT1. Radiology. 2000;215(1):103–7.
15 Dodd GD, Baron RL, Oliver JH, Federle MP. Spectrum of Imaging Findings of the Liver in End-Stage Cirrhosis: Part I, Gross Morphology and Diffuse Abnormalities. AJR. 1999;173(4):1031–6.
16 Brancatelli G, Federle MP, Ambrosini R, Lagalla R, Carriero A, Midiri M, et al. Cirrhosis: CT and MR imaging evaluation. Eur J Radiol. 2007;61(1):57–69.
17 Ito K, Mitchell DG, Kim M-J, Awaya H, Koike S, Matsunaga N. Right posterior hepatic notch sign: A simple diagnostic MR finding of cirrhosis. J Magn Reson Imag. 2003;18(5):561–6.
18 Awaya H, Mitchell DG, Kamishima T, Holland G, Ito K, Matsumoto T. Cirrhosis: Modified Caudate – Right Lobe Ratio. Radiol. 2002;224(3):769–74.
19 Zhang Y, Zhang XM, Prowda JC, Zhang HL, Sant’Anna Henry C, Shih G, et al. Changes in hepatic venous morphology with cirrhosis on MRI. J Magn Reson Imag. 2009;29(5):1085–92.
20 Ishak KG. Pathologic features of chronic hepatitis: A review and update. AJCP. 2000;113(1):40–55.
21 Bedossa P, Poynard T. An algorithm for the grading of activity in chronic hepatitis C. Hepatology. 1996;24(2):289–93.
22 Brunt EM, Janney CG, Di Bisceglie AM, Neuschwander-Tetri BA, Bacon BR. Nonalcoholic steatohepatitis: a proposal for grading and staging the histological lesions. Am J Gastroenterol. 1999;94(9):2467–74.
23 Anderson TW, Anderson TW, Anderson TW, Anderson TW. An introduction to multivariate statistical analysis [Internet]. Wiley New York; 1958 [cited 2012 Oct 13]. Available from: http://www.lavoisier.fr/livre/notice.asp
24 Ihaka R, Gentleman R. R: A Language for Data Analysis and Graphics. J Comput Graph Stat. 1996;5(3):299–314.
25 Lafortune M, Marleau D, Breton G, Viallet A, Lavoie P, Huet PM. Portal venous system measurements in portal hypertension. Radiology. 1984;151(1):27–30.
26 Vergara S, Macìas J, Rivero A, Gutiérrez-Valencia A, Gonzàlez-Serrano M, Merino D, et al. The use of transient elastometry for assessing liver fibrosis in patients with HIV and hepatitis C virus coinfection. Clin Infect Dis. 2007;45(8):969–74.
27 Okazaki H, Ito K, Fujita T, Koike S, Takano K, Matsunaga N. Discrimination of Alcoholic from Virus-Induced Cirrhosis on MR Imaging. AJR. 2000;175(6):1677–81.