Analysis of caesarean section rates over time in a single Swiss centre using a ten-group classification system
DOI: https://doi.org/10.4414/smw.2014.13921
Martin
Müller, Laura
Kolly, Marc
Bauman, Sara
Imboden, Daniel
Surbek
Summary
OBJECTIVE: Caesarean section (CS) rates have risen over the past two decades. The aim of this observational study was to identify time-dependent variations in CS and vaginal delivery rates over a period of 11 years.
METHOD: All deliveries (13,701 deliveries during the period 1999–2009) at the University Women’s Hospital Bern were analysed using an internationally standardised and approved ten-group classification system. Caesarean sections on maternal request (CSMR) were evaluated separately.
RESULTS: We detected an overall CS rate of 36.6% and an increase in the CS rate over time (p <0.001). Low-risk profile groups were the two largest populations and displayed low CS rates, with significantly decreasing relative size over time. The relative size of groups with induced labour increased significantly, but this did not have an impact on the overall CS rate. Pregnancies complicated by breech position, multiple pregnancies and abnormal lies did not have an impact on overall CS rate. The biggest contributor to a high CS rate was preterm delivery and the existence of a uterine scar from a previous CS. CSMR was 1.45% and did not have an impact on the overall CS rate.
CONCLUSION: The observational study identified wide variations in caesarean section and vaginal delivery rates across the groups over time, and a shift towards high-risk populations was noted. The biggest contributors to high CS rates were identified; namely, previous uterine scar and preterm delivery. Interventions aiming to reduce CS rates are planned.
Introduction
Caesarean section (CS) is a common surgical procedure in many parts of the world and the CS rate is continuously rising, reaching up to 40% [1]. This trend is likely to continue. Various reasons have been postulated, such as delayed childbearing, increasing safety of the procedure, maternal request, low use of vaginal birth after caesarean section (VBAC), and an increase in preterm deliveries [2, 3]. Concerns about high CS rates are justified, because such a surgical procedure is not without risk. Serious complications such as infection, thrombosis, postpartum haemorrhage and increased risk in subsequent pregnancies may occur [4]. The World Health Organization states that there is no justification for a CS rate higher than 10%–15%, but obstetric factors such as the profile of the background population depending on the proportion of nulliparous women, preterm deliveries, or women with a previous CS influence strongly the CS rate [5]. Reducing CS rates requires the implementation of effective measures and these depend on identifying which groups of women undergo CSs. The identification of trends requires a classification system able to monitor and compare the mode of birth in a standardised, reliable and consistent manner [6]. In 2001, Robson proposed such a classification system based on ten groups that are mutually exclusive and totally inclusive, which implies that a patient can be classified into one single group only [7].
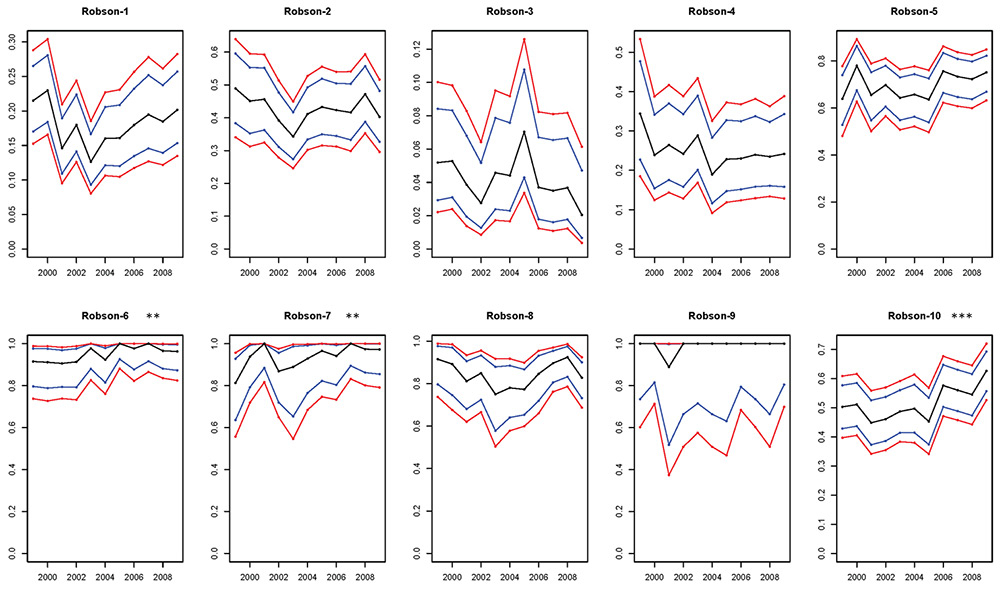
Figure 1
Change over the observation period of time in the caesarean section (CS) rate within different Robson groups.
Blue lines are 95% confidence limits and red lines are simultaneous 95% confidence limits. Significant increases of the CS rate in Groups 6, 7 and 10 were detected.
*p ≤0.05; **p ≤0.01; ***p ≤0.001
The aim of this observational study was to implement this ten-group classification system (TGCS) in order to identify and evaluate the main contributors to the increasing CS rate in our own institution. The issue of the impact of CSs on maternal request (CSMR) in these groups was addressed independently.
Materials and methods
University Women’s Hospital in Bern is a tertiary referral university institution and the birth register was used for data collection. This detailed register is used in the labour ward to document every birth in our institution and includes detailed information on the patient’s diagnoses and interventions performed (with all indications) of each delivery. The study was approved by the local institutional review board (Ethics Committee of the Canton of Bern, Switzerland).
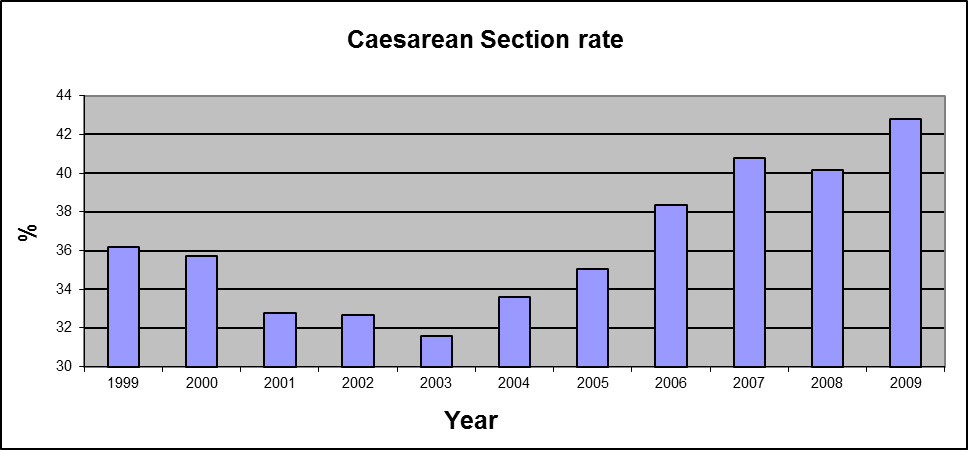
Figure 2
The overall caesarean section (CS) rate was 36.6% and increased significantly to 42.8% in 2009 (p <0.001).
All births between January 1999 and December 2009 were included in the study. Each delivery was classified into one of the ten groups in accordance with the TGCS (table 1) [7]. This classification made it possible to distinguish the deliveries in terms of parity, single or multiple pregnancy, presenting part of the foetus, gestational age, course of labour and the existence of a previous CS. In order to evaluate the impact of maternal request on the CS rate, these deliveries were evaluated separately.
All deliveries were classified in accordance with the TGCS and for each of the ten groups the CS rate, the relative size and the contribution to the total CS rate was calculated. In order to assess the main contributors of the CS rate and to evaluate the changes in the population over time, we divided each group into vaginal birth (VB) or CS. Temporal changes of the CS rate and relative size of each group, the contribution of each group to the overall CS rate, the CSMR and the mother’s age were surveyed. CSMR was noted if the diagnosis was made by the obstetrician and no identifiable medical or obstetric indication, including somatic, psychological or psychiatric indications, was present. Several exclusion criteria such as previous traumatic delivery, previous sexual abuse, foetal pathologies, or placenta praevia were used.
For the statistical analysis, permutation tests for linear trends and F-Permutation Tests for quadratic trends were used.
|
Table 1: Ten-group classification system proposed by Robson. |
| 1 |
Nulliparous, single cephalic, ≥37 weeks gestation in spontaneous labour |
| 2 |
Nulliparous, single cephalic, ≥37 weeks gestation induced labour or CS before labour |
| 3 |
Multiparous, single cephalic, ≥37 weeks gestation in spontaneous labour, no previous CS |
| 4 |
Multiparous, single cephalic, ≥37 weeks gestation induced labour or CS before labour, no previous CS |
| 5 |
Multiparous, single cephalic, ≥37 weeks gestation previous CS |
| 6 |
All nulliparous breeches |
| 7 |
All multiparous breeches (including previous CS) |
| 8 |
All multiple pregnancies (including previous CS) |
| 9 |
All abnormal lies (including previous CS) |
| 10 |
All single cephalic, <37 weeks gestation (including previous CS) |
| CS = caesarean section |
Results
There were a total of 13,701 deliveries at the University Women’s Hospital in Bern from January 1999 to December 2009. During this period, the mean overall CS rate was 36.6%.
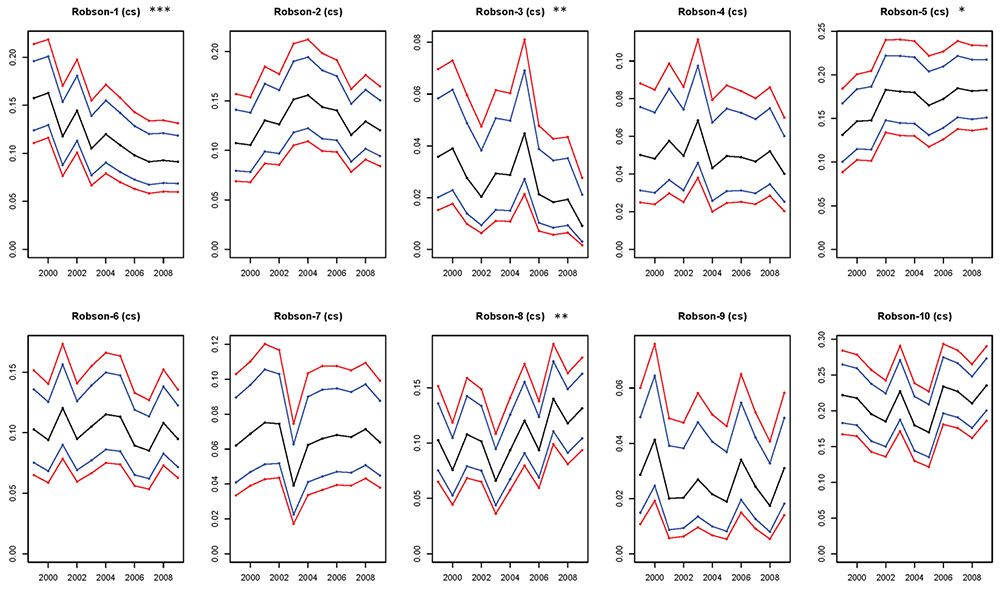
Figure 3
Temporal change within each Robson group in births delivered by caesarean section.
Relative size is presented in the observation period of time. Blue lines are 95% confidence limits and red lines are simultaneous 95% confidence limits. The relative size of Groups 1 and 3 decreased significantly and the relative size of Groups 5 and 8 was significantly increased.
*p ≤0.05; **p ≤0.01; ***p ≤0.001
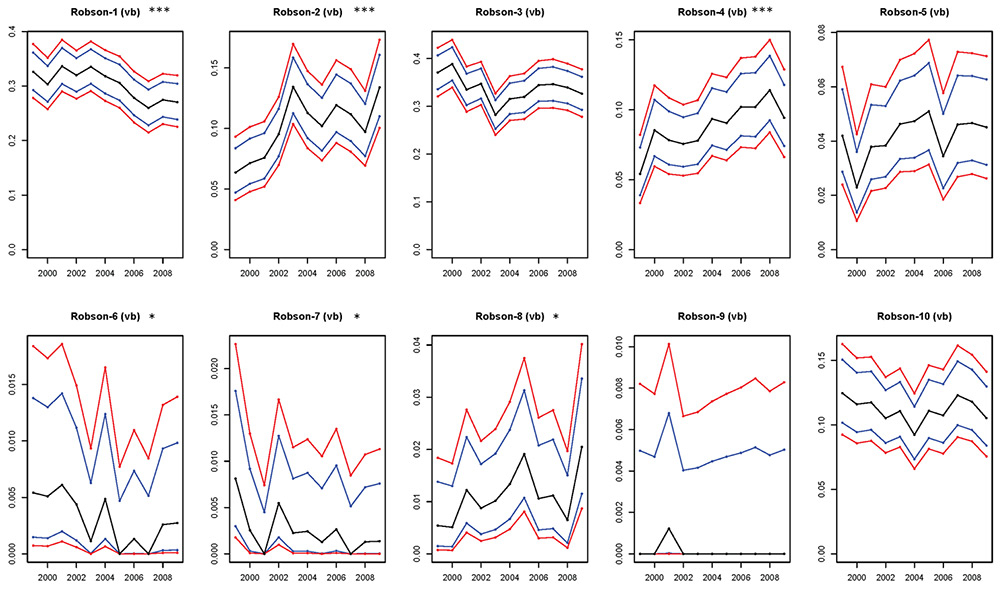
Figure 4
Temporal change within each Robson group in births delivered vaginally.
Relative size is presented in the observed period of time. Blue lines are 95% confidence limits and red lines are simultaneous 95% confidence limits. The relative sizes of Groups 1, 6 and 7 decreased significantly and the relative sizes of Groups 2, 4 and 8 increased significantly.
*p ≤0.05, **p ≤0.01, ***p ≤0.001.
The CS rate and the relative sizes of Groups 1 to 10 and absolute and relative contribution to the overall CS rate of each group are summarised in table 2. Group 1 (nulliparous women with single cephalic pregnancy, ≥37 weeks gestation, in spontaneous labour) and Group 3 (multiparous [excluding previous CS] women with single cephalic pregnancy, ≥37 weeks gestation, in spontaneous labour) were the two largest groups in the obstetric population (23.6% and 22.4% of the total, respectively). Group 1 showed the second lowest CS rate and Group 3 the lowest CS rate (17.8% and 4.2%). Group 1 was the fourth biggest contributor to the overall CS rate (11.6%) and Group 3 was the smallest contributor (2.6%).
Group 2 (nulliparous women with single cephalic pregnancy, ≥37 weeks gestation, induced labour or CS before labour) and Group 4 (multiparous women with single cephalic pregnancy, ≥37 weeks gestation, induced labour or CS before labour) accounted for 11.2% and 7.4% of all deliveries, respectively. Group 2 showed a CS rate of 42% and Group 4 a CS rate of 24.6%. Group 2 was the third biggest contributor and Group 4 the third smallest contributor to the overall CS rate (12.9% and 5%).
Group 5 (woman with a previous CS and single cephalic pregnancy ≥37 weeks) represented 8.8% of all deliveries. This group, which showed a CS rate of 69.9%, was the second biggest contributor to the overall CS rate (17%).
Groups 6 to 9 (women with breeches, multiple pregnancies or abnormal lies) were the smallest groups in the obstetric population (3.9%, 2.5%, 4.6% and 0.9% respectively). They all showed a high CS rate (94.9%, 93.7%, 84.5% and 99.2%, respectively), but were small contributors to the overall CS rate (10.1%, 6.6%, 10.6% and 2.6%, respectively). Group 9 (all presentations other than cephalic or breech [including previous CS]) was the smallest group but had the highest CS rate.
Group 10 (women with preterm delivery, <37 weeks) was the third largest group in the obstetric population (14.8%). This group showed a CS rate of 51.9% and was the biggest contributor to the overall CS rate (21.1%).
The temporal evaluation of CS rates displayed several changes over time; the results are summarised in figure 1. The overall CS rate increased significantly, to 42.8% in 2009 (p <0.001; fig. 2). A detailed temporal assessment of Robson groups displayed several changes in the CS rate and, interestingly, it increased significantly only in Groups 6, 7 and 10, reaching 96.3%, 97.2% and 62.6%, respectively, in 2009.
Dividing all deliveries into either VBs or CSs and analysing the relative size over time (figs 3 and 4) showed the following results:
– In Group 1 a significant decrease in VBs and CSs was detected. Group 3 showed no significant change of VBs and a significant decrease of CSs.
– In Groups 2 and 4 a significant increase of VBs but no significant change in CSs was detected.
– Group 5 showed no significant changes of VBs but a significant increase of CSs.
– Groups 6 and 7 showed a significant decrease of VBs but no significant change of CSs.
– Group 8 showed a significant increase in VBs and CSs. Groups 9 and 10 showed no significant change of VBs or CSs.
CSMR was evaluated independently. Figure 5 summarises the results. The mean CSMR was 1.45% of all CSs and a significant increase from 1999 to 2009 was detected (p = 0.008). Group 2 displayed the highest CSMR (7.6%), followed by Group 4 (4.8%). Groups 1, 3 and 10 showed CSMR beneath 1%.
The mean maternal age was 30.1 years. It increased significantly from 29.3 to 30.9 years in 2009 (p <0.001; fig. 6). Analysis of maternal age as an independent risk factor in women with CSMR compared with women who had CS without maternal request was not significant (p = 0.184; fig. 7).
|
Table 2: Rates for each group of the ten-group classification system. |
|
Group
|
Obstetric population
|
CS rate in each group
nx/dx (%)
|
Relative size of the group
dx/D (%)
|
Absolute contribution to the overall CS rate
nx/D (%)
|
Relative contribution to the overall CS rate
(%)
|
| 1 |
Nulliparous, single cephalic, ≥37 weeks, in spontaneous labour |
17.8 |
23.6 |
4.2 |
11.6 |
| 2 |
Nulliparous, single cephalic, ≥37 weeks, induced or CS before labour |
42.0 |
11.2 |
4.7 |
12.9 |
| 3 |
Multiparous (excluding previous CS), single cephalic, ≥37 weeks, in spontaneous labour |
4.2 |
22.4 |
0.9 |
2.6 |
| 4 |
Multiparous (excluding previous CS), single cephalic, ≥37 weeks, induced or CS before labour |
24.6 |
7.4 |
1.8 |
5.0 |
| 5 |
Previous CS, single cephalic, ≥37 weeks |
69.9 |
8.8 |
6.2 |
17.0 |
| 6 |
All nulliparous breeches |
94.9 |
3.9 |
3.7 |
10.1 |
| 7 |
All multiparous breeches (including previous CS) |
93.7 |
2.5 |
2.4 |
6.6 |
| 8 |
All multiple pregnancies (including previous CS) |
84.5 |
4.6 |
3.8 |
10.6 |
| 9 |
All presentations other than cephalic or breech (including previous CS) |
99.2 |
0.9 |
0.9 |
2.6 |
| 10 |
All single cephalic, <37 weeks (including prev. CS) |
51.9 |
14.8 |
7.6 |
21.1 |
| Total |
|
36.3 |
100.0 |
36.3 |
100.0 |
| nx = number of caesarean sections (CSs) in each group; dx = total number of women who delivered in each group; D = total number of women who delivered |
Discussion
This observational study is an assessment of obstetric practice over a period of 11 years. Stratification of all deliveries using the TGCS provides a solid scientific basis not only for an observational study but also for comparison between time periods and different labour wards [8–10]. Our study differs from previously published data due to its evaluation not only of CSs but also VBs over an extended period of time. This approach enabled us to identify specific changes in our obstetric population and practice, which is essential for interventional strategies.
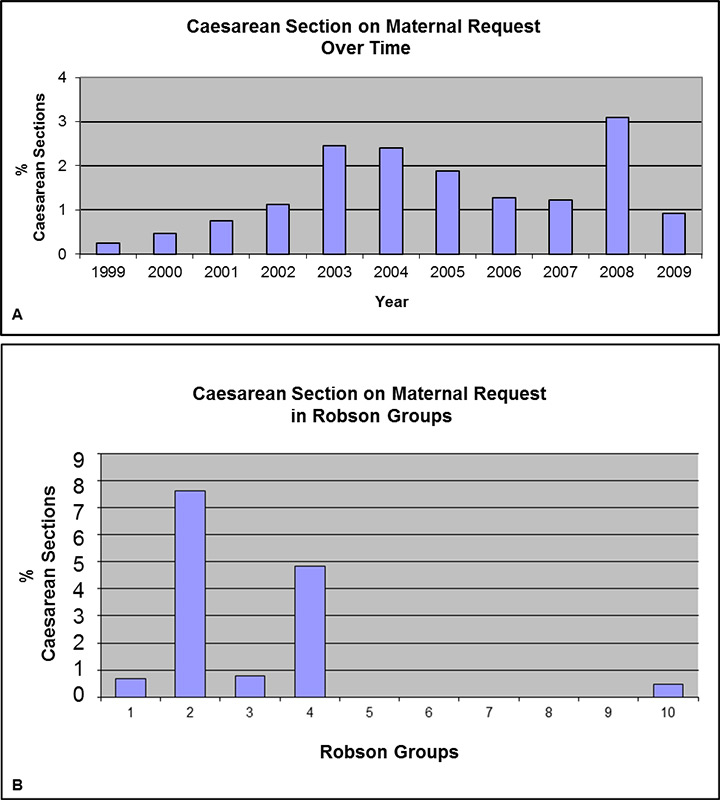
Figure 5
A: Temporal change of the caesarean section on maternal request (CSMR) rate in the observation period of time. The mean CSMR was 1.45% and a significant increase was detected (p = 0.008).
B: Caesarean section on maternal request in different Robson groups in the observation period of time. Groups 2 and 4 (woman with single cephalic pregnancy ≥37 weeks gestation with induced labour or CS before labour) displayed the highest CSMR rates (7.6% and 4.8%, respectively).
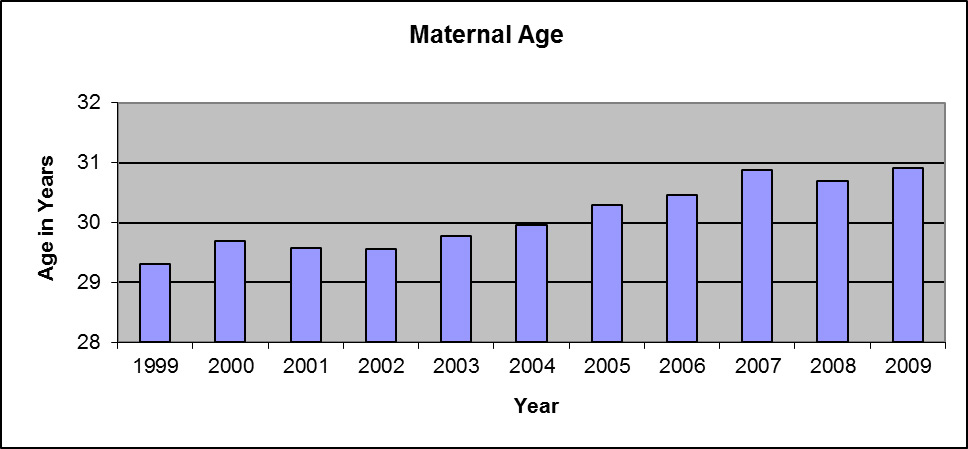
Figure 6
The maternal age increased significantly from 29.3 to 30.9 years in 2009 (p <0.0001).
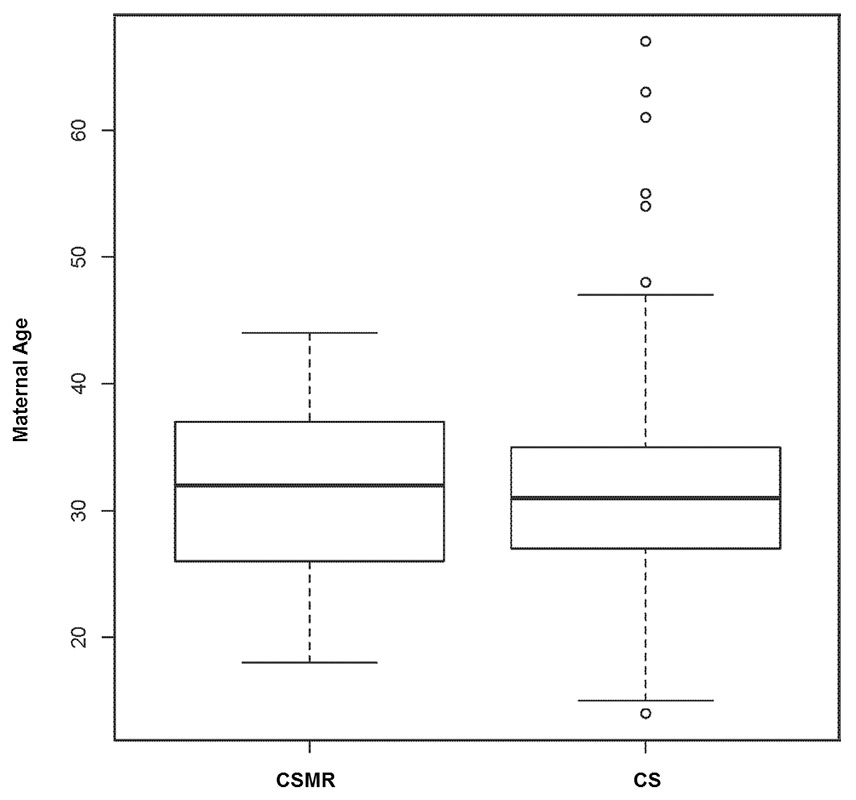
Figure 7
Comparison of maternal age in mothers with caesarean section on maternal request (CSMR) and all mothers with caesarean section (CS) was not significant (p = 0.1844).
Groups 1 and 3 represent the two largest populations in our cohort with low CS rates; they reflect the lowest risk population. Interestingly, the relative size of these groups changed significantly over time, leading to the observation of a shift towards a higher risk population. This is supported by the fact that the relative size of higher risk groups such as those including induced labour (Groups 2 and 4), previous CS (Group 5) or multiple pregnancy (Group 8) increased significantly over time. We report also a low CS rate in Groups 1 and 3 compared with an analysis of international CS delivery rates, which reflects solid obstetric management [8]. Although the TGCS does not allow for the identification of indications for CSs, differences in obstetric management, as a major factor contributing to high CS rates in these groups, were proposed [8]. A recent meta-analysis confirmed the benefit of interventions with timely amniotomy and with the early administration of oxytocin in the reduction of CS rate [11].
Induction of labour is an independent risk factor for CS and the implementation of rationalised management may reduce the CS rate [12]. Groups 2 and 4 represent this patient cohort and the CS rate in both groups is in line with previous reports [8].
Interestingly, the significant increases in the relative size of Groups 2 and 4 (in VB) did not have an impact on the CS rate. Although data from the TGCS does not deliver a definitive answer, we hypothesise that the use of active management of the first stage of labour and strict diagnosis of onset of labour may contribute to these results [11]. Medically indicated induction of labour represents a great benefit for mother and/or foetus in contrast to induction with marginal or even absent medical indications [13]. In our cohort, induction of labour was associated with a doubling of the CS rate in Group 2 compared with Group 1 and an even higher risk of CS when comparing Group 3 with Group 4. In multiparous women, the induction of labour increased the CS rate from 4.2% in Group 3 to 24.6% in Group 4. Patients need to be counselled carefully, especially when there are features suggesting an increased risk of postpartum haemorrhage and blood transfusions after induction of labour, and, if possible, induction of labour should be avoided [14].
Induction of labour leads to a higher rate of women with previous uterine scar in subsequent pregnancy. Group 5 (previous CS) was the second biggest contributor to the overall CS rate, with a significantly increased relative size of this group. The CS rate was 69.9% and in line with similar institutions [8]. VBAC is a topic of rigorous discussion; in a recent study, VBAC was successful in 57.1% of patients attempting vaginal delivery but only 28.8% attempted this [15]. Repeat CSs had a big impact on the CS rate and although about two-thirds of patients are eligible for a trial of labour, the actual rate is low [4, 16]. Slightly increased absolute risks of maternal and neonatal morbidity, professional liability concerns and recent evolution of physician and patients’ attitudes are the main reasons for the low rate of trial of labour [15, 17].
The proportion of pregnancies complicated by breech position, multiple pregnancies, and abnormal lies are represented by Groups 6 to 9. The CS rates in these groups were relatively high, but they account only for few births, so the contribution to the overall CS rate was low. Breech presentation was associated with a significantly decreased number of VBs, explained by a change in patients’ and doctors’ attitudes after the Term Breech Trial [18]. Multiple pregnancies (Group 8) increased over time. A significant increase in both VBs and CSs reflects a dilemma regarding patient counselling, owing to a lack of good evidence on the method of birth [19]. Women need to be informed of possible benefits and risks of either of the two approaches. Further clinical trials are needed. However, interventions aiming to reduce the CS rate in these groups will not result in a significant reduction of the overall CS rate because of the relatively small contributions of these groups to total CSs.
The biggest contributor to the overall CS rate was Group 10 (relative contribution to overall CS rate: 21.1%) consisting of the majority of preterm deliveries with a CS rate of 51.9%. High CS rates in tertiary referral centres are expected, owing to the management of high-risk pregnancies. Although the TGCS as a method enabled us to assess the biggest contributor to the CS rate, a detailed evaluation of this group in terms of the CS rate in deliveries at less than 28 weeks of gestation or less than 34 weeks of gestation was not possible. Still, we are able to explain the reasons at least partially [20]. Group 10 is very heterogeneous and it is probably the most consistent in terms of decision-making in favour of CS as a result of limited obstetric options, so a shift towards higher risk pregnancies is probable. This is supported by the fact that extreme prematurity was reported to have a CS rate over 60% [15]. Although other centres reported slightly lower CS rates, the contribution of this group to overall population was lower and did not exceed 10% [8]. A detailed assessment of this group is necessary in particular because there is evidence of more medical interventions aiming to reduce high CS rates [20].
CSMR has been a topic of great interest and is considered to be a contributor to the rising CS rate [9]. The risk associated with the procedure itself needs to be considered, especially in the absence of a medical indication. CS without medical indication is associated with a higher risk for maternal and neonatal morbidity, but this is also not an accurately reported condition, which makes it difficult to study in terms of risks and benefits [21]. In our cohort, CSMR increased significantly, which is in line with previous publications, but, with a contribution of 1.45%, it did not have an impact on the overall CS rate [22]. Interestingly, Groups 2 and 4 were the biggest contributors and maternal age was not associated with CSMR. In the current study, the identification of reasons for CSMR is not possible, but severe fear of childbirth or post-traumatic stress disorder after previous birth may contribute to the decision [23]. Counselling women who desire CSMR is difficult and should include a full consideration of the safety of the mother and of the neonate, weighing the risks of adverse outcomes [24].
This study has several limitations. It did not include additional variables associated with high CS rates such as body mass index or race [25]. Moreover, data on the indication for CS should be analysed, but it has to be collected prospectively with strictly defined definitions for critical events such as dystocia and foetal distress. The strengths of our study include evaluation of a large patient cohort over a period of 11 years, which enabled us to identify Groups 5 and 10 as the main contributors to the CS rate and to observe an overall shift towards a higher risk population. The comparison with international institutions suggests solid obstetric management, with a relatively low proportion of CSMR.
The TGCS is a robust tool enabling a detailed analysis of a patient cohort over a period of time and a standardised international comparison. A prospective analysis and the launch of interventions in consequence are planned. These interventions include prospective analysis of all deliveries using the TGCS, standardised analysis of foetal and maternal indications for CSs and instrumental deliveries, and detailed evaluation of Group 10 with respect to the degree of prematurity. Furthermore we will initiate a multidisciplinary and multifaceted approach aiming to reduce the CS rate by organising monthly CS conferences with analysis of CS’s indications in each group, positive feedback, consistent team approach, comparing and modifying current practice, and finally conducting education to medical staff and patients. This will result in a medical audit further completing this “feedback loop”.
Supplementary material
| Number of vaginal births (VB), caesarean sections (CS) and total number of deliveries (TND) per year and Robson group. |
| YEAR
ROBSON-GROUP |
1999 |
2000 |
2001 |
2002 |
2003 |
2004 |
2005 |
2006 |
2007 |
2008 |
2009 |
Total |
| 1 |
VB |
241 |
238 |
275 |
292 |
297 |
262 |
240 |
210 |
186 |
212 |
198 |
2,651 |
| CS |
66 |
71 |
47 |
64 |
43 |
50 |
46 |
46 |
45 |
48 |
50 |
576 |
| TND |
307 |
309 |
322 |
356 |
340 |
312 |
286 |
256 |
231 |
260 |
248 |
3,227 |
| 2 |
VB |
47 |
56 |
62 |
87 |
119 |
93 |
80 |
90 |
80 |
75 |
98 |
887 |
| CS |
45 |
46 |
52 |
56 |
62 |
65 |
61 |
66 |
57 |
67 |
66 |
643 |
| TND |
92 |
102 |
114 |
143 |
181 |
158 |
141 |
156 |
137 |
142 |
164 |
1,530 |
| 3 |
VB |
274 |
305 |
274 |
317 |
250 |
260 |
251 |
260 |
248 |
262 |
239 |
2,940 |
| CS |
15 |
17 |
11 |
9 |
12 |
12 |
19 |
10 |
9 |
10 |
5 |
129 |
| TND |
289 |
322 |
285 |
326 |
262 |
272 |
270 |
270 |
257 |
272 |
244 |
3,069 |
| 4 |
VB |
40 |
67 |
64 |
69 |
69 |
77 |
71 |
77 |
73 |
88 |
69 |
764 |
| CS |
21 |
21 |
23 |
22 |
28 |
18 |
21 |
23 |
23 |
27 |
22 |
249 |
| TND |
61 |
88 |
87 |
91 |
97 |
95 |
92 |
100 |
96 |
115 |
91 |
1,013 |
| 5 |
VB |
31 |
18 |
31 |
35 |
41 |
39 |
40 |
26 |
33 |
36 |
33 |
363 |
| CS |
55 |
64 |
59 |
81 |
74 |
75 |
70 |
81 |
91 |
94 |
100 |
844 |
| TND |
86 |
82 |
90 |
116 |
115 |
114 |
110 |
107 |
124 |
130 |
133 |
1,207 |
| 6 |
VB |
4 |
4 |
5 |
4 |
1 |
4 |
|
1 |
|
2 |
2 |
27 |
| CS |
43 |
41 |
48 |
42 |
43 |
48 |
48 |
42 |
42 |
56 |
52 |
505 |
| TND |
47 |
45 |
53 |
46 |
44 |
52 |
48 |
43 |
42 |
58 |
54 |
532 |
| 7 |
VB |
6 |
2 |
|
5 |
2 |
2 |
1 |
2 |
|
1 |
1 |
22 |
| CS |
26 |
30 |
30 |
33 |
16 |
26 |
28 |
32 |
33 |
37 |
35 |
326 |
| TND |
32 |
32 |
30 |
38 |
18 |
28 |
29 |
34 |
33 |
38 |
36 |
348 |
| 8 |
VB |
4 |
4 |
10 |
8 |
9 |
11 |
15 |
8 |
8 |
5 |
15 |
97 |
| CS |
43 |
33 |
43 |
45 |
27 |
39 |
51 |
44 |
69 |
61 |
72 |
527 |
| TND |
47 |
37 |
53 |
53 |
36 |
50 |
66 |
52 |
77 |
66 |
87 |
624 |
| 9 |
VB |
|
|
1 |
|
|
|
|
|
|
|
|
1 |
| CS |
12 |
18 |
8 |
9 |
11 |
9 |
8 |
16 |
12 |
9 |
17 |
129 |
| TND |
12 |
18 |
9 |
9 |
11 |
9 |
8 |
16 |
12 |
9 |
17 |
130 |
| 10 |
VB |
92 |
91 |
96 |
96 |
98 |
76 |
87 |
81 |
88 |
91 |
77 |
973 |
| CS |
93 |
95 |
78 |
82 |
93 |
75 |
72 |
110 |
112 |
109 |
129 |
1,048 |
| TND |
185 |
186 |
174 |
178 |
191 |
151 |
159 |
191 |
200 |
200 |
206 |
2,021 |
| Total |
VB |
739 |
785 |
818 |
913 |
886 |
824 |
785 |
755 |
716 |
772 |
732 |
8,725 |
| CS |
419 |
436 |
399 |
443 |
409 |
417 |
424 |
470 |
493 |
518 |
548 |
4,976 |
| TND |
1,158 |
1,221 |
1,217 |
1,356 |
1,295 |
1,241 |
1,209 |
1,225 |
1,209 |
1,290 |
1,280 |
1,3701 |
Acknowledgement: We would like to thank Prof. Lutz Duembgen (University of Bern, Department of Mathematics and Statistics Institute of Mathematical Statistics and Actuarial Science) for performing the statistical analysis.
References
1 Althabe F, Sosa C, Belizan JM, Gibbons L, Jacquerioz F, Bergel E. Cesarean section rates and maternal and neonatal mortality in low-, medium-, and high-income countries: an ecological study. Birth. 2006;33(4):270–7.
2 Habiba M, Kaminski M, Da Fre M, Marsal K, Bleker O, Librero J, et al. Caesarean section on request: a comparison of obstetricians’ attitudes in eight European countries. BJOG: an international journal of obstetrics and gynaecology 2006;113(6):647–56.
3 Joseph KS, Young DC, Dodds L, O’Connell CM, Allen VM, Chandra S, et al. Changes in maternal characteristics and obstetric practice and recent increases in primary cesarean delivery. Obstet Gynecol. 2003;102(4):791–800.
4 Landon MB, Hauth JC, Leveno KJ, Spong CY, Leindecker S, Varner MW, et al. Maternal and perinatal outcomes associated with a trial of labor after prior cesarean delivery. N Engl J Med. 2004;351(25):2581–9.
5 Appropriate technology for birth. Lancet. 1985;2(8452):436–7.
6 Torloni MR, Betran AP, Souza JP, Widmer M, Allen T, Gulmezoglu M, et al. Classifications for cesarean section: a systematic review. PloS one. 2011;6(1):e14566.
7 Robson MS. Can we reduce the caesarean section rate? Best practice & research Clin Obstetr Gynaecol. 2001;15(1):179–94.
8 Brennan DJ, Robson MS, Murphy M, O’Herlihy C. Comparative analysis of international cesarean delivery rates using 10–group classification identifies significant variation in spontaneous labor. Am J Obstet Gynecol. 2009;201(3):308 e301–308.
9 Florica M, Stephansson O, Nordstrom L. Indications associated with increased cesarean section rates in a Swedish hospital. International journal of gynaecology and obstetrics: the official organ of the International Federation of Gynaecology and Obstetrics. 2006;92(2):181–5.
10 Delbaere I, Cammu H, Martens E, Tency I, Martens G, Temmerman M: Limiting the caesarean section rate in low risk pregnancies is key to lowering the trend of increased abdominal deliveries: an observational study. BMC Pregnancy Childbirth. 2012;12:3.
11 Wei S, Wo BL, Qi HP, Xu H, Luo ZC, Roy C, et al. Early amniotomy and early oxytocin for prevention of, or therapy for, delay in first stage spontaneous labour compared with routine care. Cochrane Database Syst Rev 2012;9: CD006794.
12 Ehrenthal DB, Jiang X, Strobino DM. Labor induction and the risk of a cesarean delivery among nulliparous women at term. Obstet Gynecol. 2010;116(1):35–42.
13 Nicholson JM, Parry S, Caughey AB, Rosen S, Keen A, Macones GA. The impact of the active management of risk in pregnancy at term on birth outcomes: a randomized clinical trial. Am J Obstetr Gynecol. 2008;198(5):511 e511–515.
14 Grobman WA. Elective induction: When? Ever? Clin Obstet Gynecol. 2007;50(2):537–46.
15 Zhang J, Troendle J, Reddy UM, Laughon SK, Branch DW, Burkman R, et al. Contemporary cesarean delivery practice in the United States. Am J Obstetr Gynecol. 2010;203(4):326 e321–326 e310.
16 Landon MB: Vaginal birth after cesarean delivery. Clin Perinatol. 2008;35(3):491–504, ix-x.
17 Macones GA. Clinical outcomes in VBAC attempts: what to say to patients? Am J Obstetr Gynecol. 2008;199(1):1–2.
18 Hannah ME, Hannah WJ, Hewson SA, Hodnett ED, Saigal S, Willan AR. Planned caesarean section versus planned vaginal birth for breech presentation at term: a randomised multicentre trial. Term Breech Trial Collaborative Group. Lancet. 2000;356(9239):1375–83.
19 Hofmeyr GJ, Barrett JF, Crowther CA. Planned caesarean section for women with a twin pregnancy. Cochrane Database Syst Rev 2011(12):CD006553.
20 Scarella A, Chamy V, Sepulveda M, Belizan JM. Medical audit using the Ten Group Classification System and its impact on the cesarean section rate. Eur J Obstetr Gynecol Reprod Biol. 2011;154(2):136–40.
21 Karlstrom A, Lindgren H, Hildingsson I. Maternal and infant outcome after caesarean section without recorded medical indication: findings from a Swedish case-control study. BJOG: an international journal of obstetrics and gynaecology 2013;120(4):479–86; discussion 486.
22 Stjernholm YV, Petersson K, Eneroth E. Changed indications for cesarean sections. Acta Obstet Gynecol Scand. 2010;89(1):49–53.
23 Soderquist J, Wijma B, Thorbert G, Wijma K. Risk factors in pregnancy for post-traumatic stress and depression after childbirth. BJOG: an international journal of obstetrics and gynaecology 2009;116(5):672–80.
24 Wiklund I, Andolf E, Lilja H, Hildingsson I. Indications for cesarean section on maternal request – guidelines for counseling and treatment. Sexual & reproductive healthcare: official journal of the Swedish Association of Midwives 2012;3(3):99–106.
25 Lynch CM, Sexton DJ, Hession M, Morrison JJ. Obesity and mode of delivery in primigravid and multigravid women. Am J Perinatol. 2008;25(3):163–7.