Cost-effectiveness of dabigatran for stroke prevention in atrial fibrillation in Switzerland
DOI: https://doi.org/10.4414/smw.2013.13732
Mark
Pletscher, Rafael
Plessow, Klaus
Eichler, Simon
Wieser
Summary
OBJECTIVES: Atrial fibrillation is a major risk factor for ischemic stroke and anticoagulation therapy is indicated to reduce risk. Dabigatran is a new oral anticoagulant that does not require INR monitoring. This study evaluated the cost-effectiveness of dabigatran versus vitamin K antagonists for stroke prevention in atrial fibrillation in Switzerland.
METHODS: A Markov model simulating the course of treatment and occurrence of clinical events in two treatment arms over the lifetime of patients was adapted to the Swiss context. The adaptation included the cost of anticoagulation therapy and clinical events in Switzerland. The cost of inpatient care was estimated on data of all inpatient hospital stays in 2008. The calculation of outpatient care costs was based on peer reviewed studies, expert interviews and local tariffs.
RESULTS: Patients treated with dabigatran had a higher life expectancy and experienced more quality adjusted life years (QALY) while incurring higher costs than patients treated with vitamin K antagonists. The estimated incremental cost-effectiveness ratio (ICER) was CHF 25,108.‒ per QALY with 110 mg and CHF 9,702 per QALY with 150 mg of dabigatran. A sequential dosage scheme, in which 150 mg are administered up to the age of 80 years and 110 mg thereafter, resulted in an ICER of CHF 10,215 per QALY. A sensitivity analysis confirmed that these results are robust.
CONCLUSIONS: Dabigatran can be considered cost-effective in comparison with vitamin K antagonists in the Swiss context. The higher drug cost of dabigatran is compensated by savings in INR monitoring, lower cost of clinical events and QALY-gains.
Key words:dabigatran; warfarin; marcoumar; oral anticoagulation; atrial fibrillation; stroke prevention; vitamin K antagonist; VKA; cost; cost-effectiveness; QALY; ICER; Switzerland
|
AbbreviationsAF: atrial fibrillationAMI: acute myocardial infarctionASA: acetylsalicylic acidBID: twice a dayCHADS: stroke risk prediction rule (congestive heart failure, hypertension, age, diabetes, prior stroke)DRG: diagnosis related groupsECH: extracranial haemorrhageGP: general practitionerHS: haemorrhagic strokeICER: incremental cost-effectiveness ratio: Difference in total cost between two therapy options divided by the difference in QALY. Expresses the additional cost per QALY gained by choosing the more effective therapy option.IH: intracranial haemorrhageINR: international normalized ratioIS: ischemic strokeMB: minor bleedMedStat: Swiss Medical Statistics of Hospitals: This dataset contains information on all hospitalizations in Swiss hospitals. Patients are tagged with the same ID during all inpatient stays.PSA: probabilistic sensitivity analysisQALY: quality adjusted life year: The product of quality of life and life years. One life year at 50% quality of life corresponds to 0.5 QALY.RR: relative riskSA: sensitivity analysisSE: systemic embolismTIA: transient ischemic attackTTR: time in therapeutic INR rangeVKA: vitamin K antagonist |
Introduction
Atrial fibrillation is the most common sustained cardiac arrhythmia in the general population and its prevalence increases with age [3, 4]. Atrial fibrillation is a major risk factor for ischemic stroke and strokes due to atrial fibrillation are more severe than other types of IS [5, 6]. Thus oral anticoagulation therapy is strongly indicated for the reduction of stroke risk. The current standard of care in oral anticoagulation therapy is vitamin K antagonists (VKA), which require constant INR monitoring [7].
Dabigatran is an oral direct thrombin inhibitor that is taken in a fixed dose twice daily (BID). It does not require INR monitoring and does not interact with food [8]. Dabigatran has proven to be very effective in preventing IS while avoiding haemorrhagic events [9, 10]. Although dabigatran can save INR monitoring costs, drug costs are higher than with VKA.
Cost-effectiveness analysis is needed to determine whether the preventive effects and the savings of INR monitoring costs are worth the higher price of dabigatran. Studies in other countries have shown that dabigatran is cost-effective among AF patients with a medium to high risk of stroke when compared to a well-adjusted VKA [2, 11–14] . As these results are dependent on the local standard of care, local prices and peculiarities of the local health care system, they cannot be transferred to other countries. This may be particularly important in the context of the Swiss health care system with its comparably high per-capita health care expenditures.
In this study we assessed the cost-effectiveness of dabigatran versus VKA for stroke prevention in AF in Switzerland.
Model
A cost-effectiveness model originally developed by Sorensen et al. [1, 2] was adapted to the Swiss context. The model has a Markov structure and simulates the occurrence of clinical events in 3 month cycles over the remaining lifetime of patients. Clinical events include IS, systemic embolism (SE), transient ischemic attack (TIA), intracranial haemorrhage (IH), haemorrhagic stroke (HS), extra-cranial haemorrhage (ECH), minor bleed (MB), acute myocardial infarction (AMI) and death. According to definitions in the RE-LY trial, HS include intra-cerebral and subarachnoid haemorrhages, and ICH consists of HS and subdural haemorrhage [9]. All clinical events induce one-time treatment costs and a temporary loss of quality of life. Some clinical events (IS, HS and ICH) may also lead to permanent disability causing long-term follow-up costs and a permanent loss of quality of life. The disability status of these patients is categorised as independent, moderately dependentor totally dependent. See figure 1 for a simplified representation of the model structure and the publications by the authors of the model for a detailed description [1, 2].
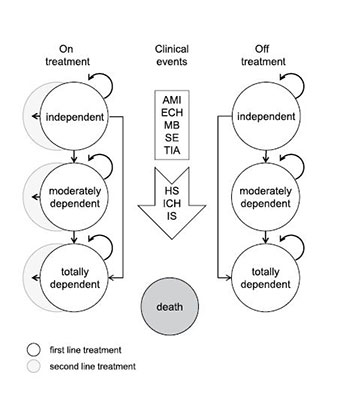
Figure 1
Simplified representation of Markov model.
Health states are modelled in 3-month cycles in which a patient may experience no event, a clinical event, or death. All clinical events induce one-time treatment costs and a temporary loss of quality of life. IS, HS, and ICH may lead to permanent disability (moderate or total) causing long-term follow-up costs and a permanent loss of quality of life. Disability levels can only get worse and never improve.
After a haemorrhagic event, 50% of the patients are assumed to discontinue treatment. Without any event, the time until treatment discontinuation is modelled by a Weibull hazard function based on data from the RE-LY trial. After treatment discontinuation, 70% of patients on dabigatran and 78% of patients on VKA are assumed to use ASA as a second line treatment.
AMI = acute myocardial infarction; ECH = extra-cranial haemorrhage; HS = hemorrhagic stroke; ICH = intracranial haemorrhage, IS = ischemic stroke; MB = minor bleed; SE = systemic embolism; TIA = transient ischemic attack.
The model compared two treatment arms; one with dabigatran and the other with VKA as the first line treatment. In both arms, treatment can be switched to acetylsalicylic acid (ASA) as a second line treatment or can be discontinued. While in Anglo-Saxon countries warfarin is considered the standard VKA, we substituted it with phenprocoumon, the most common VKA in Switzerland [15, 16]. Warfarin and phenprocoumon have proven to be equally effective in anticoagulation therapy [17, 18]. The choice of phenprocoumon as a comparator therefore only affects daily drug costs but not the probabilities of clinical events.
The dosage of dabigatran was modelled in three different scenarios: single dose scenarios with 110 mg or 150 mg BID and a sequential dose scenario, in which dabigatran is administered at 150 mg BID until the age of 80 years and at 110 mg BID thereafter. The sequential dose scenario is the recommended prescribing scheme for the European Union [19] and Switzerland.
The cost-effectiveness analysis was performed from a payer’s perspective and included all medical costs borne by health insurance, governmental institutions and patients. Future costs and QALYs were discounted at a rate of 2%. This rate represents the real long-term interest rate in Switzerland [20].
The model delivered the following results for the simulated patient cohort in the two treatment arms: residual lifetime, total medical costs, and total QALY experienced in the model. These results were used to calculate the incremental cost-effectiveness ratio (ICER) of dabigatran versus VKA. Univariate sensitivity analysis (SA) covered time in therapeutic INR range (TTR), CHADS2 score at model entry, dabigatran price, INR monitoring costs, and discount rate. In the probabilistic sensitivity analysis (PSA) model parameters were randomly varied within their statistical distributions, based on 95% confidence intervals (CI). Baseline risks of adverse events in the VKA arm were modelled as beta distributions due to the special relationship of this distribution with binomial data. The relative risks for patients on dabigatran were assumed to be log-normally distributed as CI of relative risks are estimated on the log scale. Utilities were varied within a beta distribution which ensured a lower bound at zero, and cost inputs were assumed to be gamma distributed due to the skewed nature often found in cost data.
Data
Patient properties were derived from sub-samples of the RE-LY trial [9, 10]. The average age at model entry was 71 years in the 110 mg and 150 mg scenarios and 69.1 years in the sequential dose scenario. A total of 63.6% or 65.0% of patients were males in the separate dose or sequential dose scenarios. Probabilities of clinical events stemmed from a mixed treatment comparison of dabigatran versus warfarin [21]. In the VKA arm, stroke frequency and severity also depended on the INR status of patients [22], which was modelled according to patients in the RE-LY trial [9, 10]. In the base case analysis, the INR was modelled to lie between 2 and 3 during 64% of study time. Since patients in clinical trials are usually better managed than in real life [23, 24], the TTR was subjected to univariate SA. A scenario with well managed Swiss patients using self-checking devices was also evaluated [24].
Cost of anticoagulation therapy
We calculated the cost of anticoagulation therapy with dabigatran and VKA in the Swiss context. The daily doses of dabigatran and phenprocoumon stemmed from clinical trials and published literature [9, 17, 18]. The number of INR tests and the associated physician visits were based on treatment recommendations and a survey of physicians commissioned by Boehringer Ingelheim [25–27]. Prices of drugs and services were obtained from publicly available sources [28–30].
The daily drug cost of dabigatran at retail price was assumed to be CHF 4.00 in all dosage scenarios as this corresponds to current retail prices of both dabigatran 110 mg and 150 mg in Switzerland [31]. The daily dose of phenprocoumon (Marcoumar®) was assumed to be 2.25 mg [17, 18] at a cost of CHF 0.21 per day [28]. Based on a survey among general practitioners (GP) [25] and published treatment recommendations [26, 27], we estimated 11.6 INR tests in the first month of VKA therapy and 1.14 tests per month thereafter. In the survey, GPs reported an average of 4.6 visits until their patients reached the target band [25]. Niederer et al. [26] recommend a test every 1–2 days until patients reach the target band, and a test every 2–3 days in the 2–3 weeks thereafter. In the subsequent months, one test every 3–4 weeks is assumed [26, 27]. As doctors need to discuss the results of the test, we assumed that there is a 10-minute consultation at a cost of CHF 23 per test [30]. The duration of the consultation per test was subjected to univariate SA. On average, INR monitoring costs amount to CHF 511 per year. We also assumed that one INR test is done before initiation of dabigatran treatment since a laboratory expert and two clinical cardiologists suggested that some GPs might do an initial INR test in an early phase of the use of dabigatran although it is not necessary. This is also in line with the conservative approach we employed in order to avoid an underestimation of the treatment cost of dabigatran.
Cost of clinical events and long-term follow-up costs
We calculated the one-time cost of clinical events and long-term follow-up costs according to the Swiss standard of care. Event costs in table 1 comprise of inpatient and outpatient costs in the first 3 months after a clinical event.
|
Table 1:
Event costs of clinical events in the first 3 months. Clinical event costs are the direct medical costs in the first 3 months after an event. For SE, TIA, and AMI, they include the cost of the first year because these events are treated for longer than just 3 months in Switzerland and the model does not allow long-term follow-up costs for these events. Sources: Swiss medical statistics of hospitals [32], Brüggenjürgen et al. [38], Mahler et al. [39], Swiss medical tariffs [28–30, 32–34, 37]. |
| |
|
Direct medical costs [CHF]
|
Share of inpatient care [%]a
|
|
Ischemic stroke
|
|
| |
Fatal |
9,824 |
97 |
| |
Independent |
21,377 |
94 |
| |
Moderately dependent |
23,881 |
90 |
| |
Totally dependent |
29,333 |
98 |
|
Systemic embolism (1st year)
|
|
| |
Fatal |
30,876 |
97 |
| |
Non-fatal |
26,078 |
91 |
|
Transient ischemic attack (1st year)
|
1,408 |
|
|
Intracranial haemorrhage
|
|
| |
Fatal |
8,298 |
94 |
| |
Independent |
32,818 |
96 |
| |
Moderately dependent |
36,860 |
95 |
| |
Totally dependent |
37,872 |
98 |
|
Haemorrhagic stroke
|
|
| |
Fatal |
8,298 |
94 |
| |
Independent |
32,818 |
96 |
| |
Moderately dependent |
36,860 |
95 |
| |
Totally dependent |
37,872 |
98 |
|
Extra-cranial haemorrhage
|
|
| |
Fatal |
16,300 |
95 |
| |
Non-fatal, non-GI |
13,682 |
97 |
| |
Non-fatal, GI |
13,881 |
96 |
|
Minor bleed
|
142 |
|
|
Acute myocardial infarction (1st year)
|
|
| |
Fatal |
7,225 |
96 |
| |
Non-fatal |
26,249 |
88 |
|
a Inpatient care: hospital, inpatient rehabilitation, nursing home. |
Information on services used in inpatient care (acute care, rehabilitation, nursing home) stemmed from the Swiss Medical Statistics of Hospitals (MedStat) [32]. In this dataset, patients who experienced one of the clinical events can be identified by ICD-10 diagnoses. The MedStat also contains AP-DRG codes which allow the valuation of inpatient stays by AP-DRG cost weights [33]. These inpatient costs were then corrected with a mark-up of 13.8% since inpatient health expenditures calculated by AP-DRG cost weights underestimate the total cost of inpatient care in comparison to a more comprehensive source of total inpatient care costs [34, 35]. The cost of inpatient rehabilitation was calculated by multiplying the length of stay from MedStat and CHF 655, which represents the average daily tariff of three major rehabilitation clinics (Aar Schinznach-Bad, Reha Rheinfelden and Rehaklinik Bellikon) in 2008 [36]. The cost of inpatient nursing homes was represented by medical expenditures in the Statistics of Social Medical Institutions [37] of CHF 42,360 per year.
Outpatient costs in the first 3 months after a clinical event covered transportation to the hospital, physician visits, therapies, diagnostic interventions, medication, outpatient nursing, and outpatient rehabilitation. The cost of an ambulance ride to hospital amounts to CHF 1,252 for IS, HS, and ICH patients and CHF 1,617 for AMI and SE patients according to sample invoices of two ambulance services. The number and frequency of outpatient physician visits after an inpatient stay (GPs, neurologists, psychiatrists), diagnostic interventions (rest electrocardiography, holter electrocardiography, magnetic resonance imaging, neuroangiography), laboratory tests (low-density lipoprotein, high-density lipoprotein, hematogram I, potassium, glucosis, creatinine, presence charge), and drugs used (beta inhibitors, ACE inhibitors, diuretics, AT-2 inhibitors, antispastics, antieptileptics, antidepressants) were modelled according to a survey of German experts conducted by Brüggenjürgen et al. [8]. The results of this survey were adapted to the Swiss context with the support of local clinical experts. The amounts charged for these services were obtained from the list of laboratory analyses [29], the TARMED medical tariff [30], and the list of medical specialties [28]. The annual cost of outpatient rehabilitation was estimated as the cost of physiotherapy of CHF 2,167 from Mahler et al. [39]. The annual cost of outpatient nursing of CHF 2,807 from Mahler et al. [39] was doubled to account for contributions by local governments [40] and corrected to reflect 12% inflation in health care from 2003 to 2008 [41].
Event costs and long-term follow-up costs were calculated separately for independent, moderately dependent or totally dependent patients, and for fatal events. IS, HS and ICH patients discharged to go home and labelled as “healed” in the MedStat [32] were categorised as independent patients requiring only outpatient medical care after the initial inpatient stay (physician visits, therapies, diagnostic interventions, medication). Patients not qualified as “healed” but discharged to go home were identified as moderately dependent. It was assumed that these patients use outpatient nursing, physiotherapy, and outpatient medical care. Patients transferred to nursing homes after inpatient care were identified as totally dependent patients. Their follow-up costs correspond to the costs of medical care in Swiss nursing homes.
Long-term follow-up costs were determined by medical services which stroke patients use from the fourth month after an event. Since quantities of services used decrease steadily after a stroke [38], long- term follow-up costs per model cycle are an average over the residual lifetime after a stroke. In the model, the mean age when experiencing a stroke was 80 years. 80-year-old individuals have a life expectancy of 87.5 years and therefore incur follow up costs during 7.5 years. Although stroke patients may have reduced long-term survival [42, 43] , this is in line with our conservative costing approach. Follow-up costs of outpatient care of independent patients amounted to CHF 368 per 3-month cycle, the costs of care for moderately dependent patients amounted to CHF 2,070 per cycle, and costs in nursing homes for totally dependent patients amounted to CHF 10,589 per cycle (table 2).
|
Table 2:
Composition of follow-up costs per 3-month cycle [CHF]. The follow-up costs represent the average resources an individual uses over its average lifetime after a stroke of 7.5 years. In the Markov model, the average age when experiencing a stroke is 80 years. At this age the residual life expectancy of all patients in the model is 7.5 years. Sources: Brüggenjürgen et al. [38], Mahler et al. [39], Swiss medical tariffs [28–30]. |
| |
Independent
|
Moderately dependent
|
Totallydependent
|
| Physician visits |
100 |
100 |
|
| Laboratory tests |
43 |
43 |
|
| Diagnostic interventions |
89 |
89 |
|
| Medication |
137 |
137 |
|
| Physiotherapy |
|
131 |
|
| Outpatient nursing |
|
1,572 |
|
| Inpatient nursing home |
|
|
10,589 |
|
Total
|
368
|
2,070
|
10,589
|
Quality of life
Data on temporary utility decrements during the cycles with a clinical event (see table 3) came from Sullivan and colleagues [44]. Since long term consequences of clinical events were modelled by the use of different disability levels, estimates of quality of life for minor, moderate and major stroke from Tengs and Lin [45] were used in the cycles after an IS, HS or ICH.
|
Table 3: Quality of life decrements due to clinical events. |
| |
Mean
|
Std. err.
|
Source
|
|
3 month dis-utilities per event |
| Ischemic stroke |
0.139 |
0.011 |
Sullivan et al. [44] |
| Systemic embolism |
0.120 |
0.009 |
Sullivan et al. [44] |
| Transient ischemic attack |
0.103 |
0.008 |
Sullivan et al. [44] |
| Intracranial haemorrhage |
0.181 |
0.014 |
Sullivan et al. [44] |
| Haemorrhagic stroke |
0.139 |
0.011 |
Sullivan et al. [44] |
| Extra-cranial haemorrhage |
0.181 |
0.014 |
Sullivan et al. [44] |
| Minor bleed |
0.004 |
0.001 |
Sullivan et al. [44] |
| Acute myocardial infarction |
0.125 |
0.009 |
Sullivan et al. [44] |
|
Permanent utility levels by disability status |
| Independent, without strokea
|
0.81 |
0.060 |
Sullivan et al. [44] |
| Independent, with stroke |
0.65 |
0.048b
|
Tengs and Lin [45] |
| Moderately dependent |
0.46 |
0.034b
|
Tengs and Lin [44, 45] |
| Totally dependent |
0.30 |
0.022b
|
Tengs and Lin [45] |
|
a Quality of life of patients with AF from Sullivan et al. [44]; bstandard errors of mean utility levels after a stroke are assumed to be same proportion of the mean as without stroke from Sullivan et al. |
Results
Effectiveness
Patients on dabigatran lived longer and experienced higher quality of life than patients treated with VKA. Considering the 10,000 patients as a whole, dabigatran led to a gain of 1,949 life years in the 110 mg scenario, 2,330 life years in the 150 mg scenario, and 2,774 life years in the sequential dose scenario. The number of clinical events which occurred during the time patients spend in the model (table 4 and table 5) was not only a consequence of the risk of these events, but also of the residual lifetime since additional clinical events may occur with additional lifetime gained. As the sequential dose scenario was modelled on a slightly different sub-population of the RE-LY trial, the estimated number of events cannot be compared directly to the results from the two single dose scenarios.
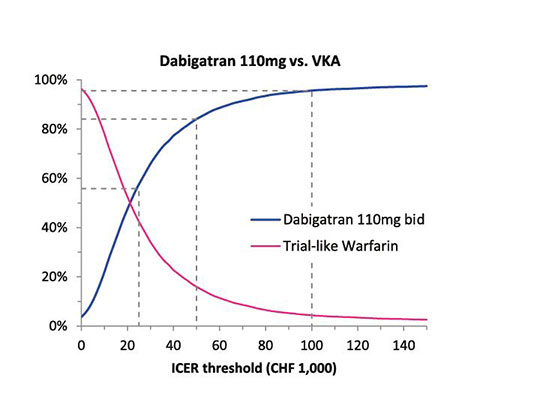


Figure 2
Cost-effectiveness acceptability curves of dabigatran versus VKA in three dabigatran dosage scenarios.
The cost-effectiveness acceptability curve (CEAC) of dabigatran shows the probability of dabigatran to be the cost-effective treatment versus the alternative VKA treatment at different ICER thresholds. The CEAC is generated on the basis of 10,000 PSA model runs. A point on the line can be interpreted as the probability to correctly choose dabigatran as the cost-effective drug at a determinate ICER threshold. The dotted lines indicate these probabilities at thresholds of CHF 25,000.‒, CHF 50,000.‒, and CHF 100,000.‒
The largest effect of dabigatran versus VKA lies in the strong reduction of HS and ICH. Patients in the dabigatran 110 mg scenario experienced more IS and less HS/ICH than those in the VKA arm. Patients in the dabigatran 150 mg scenario and in the sequential dose scenario experienced less IS and HS/ICH, and particularly less severely disabling strokes, despite the longer lifetime of patients. However, in these two scenarios more extracranial bleedings occurred among patients on dabigatran than in the VKA arms of the respective models.
QALY gains of patients on dabigatran result from longer lifetime and quality of life gains due to the prevention of clinical events and their long-term consequences. QALY gains in the simulated cohort of 10,000 patients in the dabigatran arm amount to 1,848 QALYs (110 mg scenario), 2,433 QALYs (150 mg scenario), and 2,846 QALYs (sequential dose scenario) versus patients on VKA (table 6).
Cost-effectiveness
Dabigatran was able to save INR monitoring costs and reduce the cost of clinical events. However, overall total medical costs were higher with dabigatran due to higher drug costs. Total lifetime medical costs per patient in the dabigatran arm exceeded medical costs in the VKA arm by CHF 4,639 with dabigatran 110 mg, by CHF 2,361 with dabigatran 150 mg, and by CHF 2,907 with sequential dose dabigatran (table 6). The incremental medical cost per life year spent in the model amounted to CHF 418 with 110 mg, CHF 212 with 150 mg and CHF 241 in a sequential dosage scheme.
When incremental costs are compared to QALYs gained, dabigatran 110 mg yielded an ICER of CHF 25,108 per QALY, dabigatran 150 mg yields CHF 9,702 per QALY, and sequential dose dabigatran yields CHF 10,215 per QALY.
Sensitivity analysis
The robustness of the results was tested by five univariate SA and a PSA:
SA on TTR: Since anticoagulation therapy is likely to be better managed in clinical trials than in real practice [23], the TTR of 64% from the RE-LY trial was replaced by the 55% of INR values between 2 and 2.9 from the usual care arm of a Swiss study comparing self-checking devices with the standard laboratory analysis [46]. Although some health systems yield even better results than reported in the RE-LY trial, 55% is an empirically well supported assumption [47]. This real-world INR adjustment led to a significantly lower ICER of dabigatran versus VKA of CHF 6,291 for the 110 mg scenario. The 150 mg and the sequential scenarios even become cost-saving under simulated real-world conditions (table 7). We also evaluate a scenario with a considerably higher TTR. If patients are within target range during 72% of time, as in a Swiss study on the use of self-checking devices [24], the ICERs take values between CHF 15,239 and 38,608. With a median age of 52 years, however, the participants in this study are considerably younger than the model population.
SA on CHADS2 score at model entry: Following Banerjee et al. [48] we changed the CHADS2score distribution from the RE-LY sample to the values of 0, 1 or 2 to 6 for the whole model population. The results showed only minor effects on the ICER in the 150 mg and the sequential scenarios. However, in the 110 mg scenario, the higher the CHADS2 score, the less cost-effective dabigatran was versus VKA.
SA on dabigatran price: We evaluated two additional dabigatran pricing scenarios by varying the assumed base price of the daily dose of CHF 4.00 by ± CHF 1.00. At a daily cost of CHF 3.00, the ICER decreased by approximately 40% in the 110 mg scenario. 150 mg and sequential dose dabigatran were estimated to be cost-saving at a daily drug cost of CHF 3.00. At a daily cost of CHF 5.00, the ICER of dabigatran 110 mg increases by 60%, and in the 150 mg and sequential dose scenarios, the ICER more than doubles.
SA on two additional INR monitoring cost scenarios: (1.) Yearly cost amounted to CHF 175 when only laboratory analyses but no GP consultations were included and (2.) to CHF 735 when a consultation of 15 minutes instead of 10 minutes was assumed with each INR test. The ICER of dabigatran versus VKA increased substantially in the first scenario (from +55% in the 110 mg to +108% in the 150 mg scenario) and decreased substantially in the second scenario (from –35% in the 110 mg to –72% in the 150 mg scenario).
SA on discount rate: Changing the discount rate of 2% in the base scenario to 0% or 4% only had a modest effect on the ICER (table 7).
In the PSA risks of clinical events, probability of treatment discontinuation, mortality risk, disutility as a result of clinical events, and cost parameters were varied randomly in 10,000 model runs. This allowed the estimation of a mean ICER and a graphical representation of cost-effectiveness acceptability curves (CEAC) which showed the probabilities with which the ICER lies below a certain threshold (fig. 2). The mean ICER was CHF 23,300 in the 110 mg scenario, CHF 14,818 in the 150 mg scenario, and CHF 13,764 in the sequential dose scenario. The ICER in the 110 mg scenario lay below a threshold of CHF 100,000 with a probability of 95.6% and below a threshold of CHF 50,000 with a probability of 84.0%. For the 150 mg scenario and the sequential dose scenario, the corresponding probabilities were 99.0% and 99.6% (below CHF 100,000) and 95.8% and 97.7% (below CHF 50,000).
|
Table 4: Number of events in the 110 mg and 150 mg dosage scenarios. The number of events represents the sum of clinical events of all 10,000 patients over their entire time in the model. The difference to the number of events in the VKA arm is the result of relative effectiveness and lifetime of patients. |
| |
|
Dabigatran 110 mg
|
Dabigatran 150 mg
|
VKA
|
| |
Events [n] |
∆ to VKA [n] |
Events [n] |
∆ to VKA [n] |
∆ to 110 mg [n] |
Events [n] |
| Ischemic stroke |
3,907 |
215 |
3,528 |
‒164 |
‒379 |
3,692 |
| |
Fatal |
1,264 |
22 |
1,246 |
4 |
‒18 |
1,242 |
| |
Independent |
1,551 |
19 |
1,482 |
‒50 |
‒69 |
1,532 |
| |
Moderate disability |
796 |
126 |
592 |
‒78 |
‒204 |
670 |
| |
Totally dependent |
297 |
49 |
209 |
‒39 |
‒88 |
248 |
| Systemic embolism |
371 |
39 |
372 |
‒38 |
1 |
410 |
| |
Fatal |
1 |
|
1 |
|
|
1 |
| |
Non-fatal |
369 |
39 |
370 |
‒38 |
1 |
408 |
| Transient ischemic attack |
1,021 |
178 |
1,128 |
‒71 |
107 |
1,199 |
| Intracranial haemorrhage and haemorrhagic stroke |
435 |
‒551 |
518 |
-468 |
38 |
986 |
| |
Fatal |
182 |
‒285 |
222 |
-245 |
40 |
467 |
| |
Independent |
44 |
‒42 |
51 |
‒35 |
7 |
86 |
| |
Moderate disability |
50 |
‒48 |
58 |
‒40 |
8 |
98 |
| |
Totally dependent |
159 |
‒176 |
186 |
‒149 |
27 |
335 |
| Extra cranial haemorrhage |
3,323 |
‒92 |
3,647 |
232 |
326 |
3,416 |
| |
Fatal |
38 |
‒1 |
42 |
3 |
4 |
39 |
| |
Non-fatal, non-GI |
2,622 |
‒151 |
2,789 |
16 |
167 |
2,773 |
| |
Non-fatal, GI |
663 |
60 |
816 |
213 |
153 |
603 |
| Acute myocardial infarction |
1,138 |
185 |
1,136 |
183 |
‒2 |
952 |
| |
Fatal |
13 |
2 |
13 |
2 |
|
11 |
| |
Non-fatal |
1,125 |
183 |
1,123 |
181 |
‒2 |
942 |
| n = number of events rounded to integer values |
|
Table 5: Number of events in the sequential dose model. The number of events represents the sum of clinical events of all 10,000 patients over their entire time in the model. The difference to the number of events in the VKA arm is the result of relative effectiveness and lifetime of patients. As the sequential dose scenario is modelled on a slightly different sub-population of the RE-LY trial, the comparison of the results of the sequential dose scenario with the other two scenarios should be limited to the comparison of the ICER and should not include a comparison of the number of clinical events prevented. |
| |
|
Sequential dose dabigatran
|
VKA
|
| |
Events [n] |
∆ to VKA [n] |
Events [n] |
| Ischemic stroke |
4,079 |
‒159 |
4,238 |
| |
Fatal |
1,537 |
8 |
1,529 |
| |
Independent |
1,389 |
‒157 |
1,546 |
| |
Moderate disability |
706 |
42 |
664 |
| |
Totally dependent |
447 |
-52 |
499 |
| Systemic embolism |
488 |
-54 |
542 |
| |
Fatal |
2 |
|
2 |
| |
Non-fatal |
486 |
‒54 |
540 |
| Transient ischemic attack |
1,261 |
‒223 |
1,484 |
| Intracranial haemorrhage and haemorrhagic stroke |
465 |
‒580 |
1,045 |
| |
Fatal |
194 |
‒303 |
497 |
| |
Independent |
47 |
‒43 |
90 |
| |
Moderate disability |
53 |
‒50 |
103 |
| |
Totally dependent |
170 |
‒185 |
355 |
| Extra cranial haemorrhage |
4,199 |
426 |
3,773 |
| |
Fatal |
51 |
6 |
45 |
| |
Non-fatal, non-GI |
3,254 |
195 |
3,059 |
| |
Non-fatal, GI |
894 |
226 |
668 |
| Acute myocardial infarction |
1,374 |
249 |
1,125 |
| |
Fatal |
15 |
3 |
12 |
| |
Non-fatal |
1,358 |
246 |
1,112 |
| n = number of events rounded to integer values. |
|
Table 6:
Incremental costs and QALY in the whole patient population. As the sequential dose scenario is modelled on a slightly different subpopulation of the RE-LY trial, the comparison of the results of the sequential dose scenario with the other two scenarios should be limited to the comparison of the ICER and should not include a comparison of the number of clinical events prevented. |
| |
Dabigatran 110 mg
|
Dabigatran 150 mg
|
Sequential dose dabigatran
|
|
Incremental utility
|
|
|
|
| Life years in the modela
|
111,001 |
111,382 |
120,399 |
| Incremental life years |
1,949 |
2,330 |
2,774 |
|
Incremental QALYc
|
1,848
|
2,433
|
2,846
|
|
Incremental costs
b
|
|
|
|
| Incremental drug cost |
107,231,907 |
104,240,515 |
116,180,274 |
| Incremental monitoring cost |
‒38,766,790 |
‒38,766,790 |
‒42,509,345 |
| Incremental event cost |
‒4,549,378 |
‒6,702,890 |
‒6,273,658 |
| Incremental follow-up cost |
‒17,544,121 |
‒35,187,222 |
‒38,343,126 |
| Incremental treatment discontinuation costd
|
17,057 |
22,880 |
19,481 |
|
Total incremental costs
|
46,388,675
|
23,606,493
|
29,073,626
|
|
Total incremental costs per life year in the model
|
418
|
212
|
241
|
|
ICERe
|
25,108
|
9,702
|
10,215
|
|
a Life years in the model are the sum of the residual lifetime of all 10,000 patients entering the model; b incremental cost is the difference in total medical costs of all 10,000 patients between the dabigatran arm and the VKA arm; c incremental QALY is the difference in total QALY experienced by all 10,000 patients between the dabigatran arm and the VKA arm; d treatment discontinuation cost is the cost of one GP visit when the treatment is switched to acetyl salicylic acid without the occurrence of an adverse event; e the incremental cost-effectiveness ratio (ICER) is the ratio between incremental costs and incremental QALY. |
|
Table 7: Univariate sensitivity analysis of the ICER in the three dabigatran dosage scenarios versus VKA. The univariate sensitivity analysis shows how the ICER (CHF/QALY) changes when single model parameters are modified. The central column contains the ICERs of the base case analysis. |
| |
Time in INR target range
|
|
Dabigatran
|
Self check (72%)
|
Trial-like (64%)
|
Real world (55%)
|
| 110 mg |
38,608 |
25,108 |
6,291 |
| 150 mg |
15,640 |
9,702 |
-812 |
| Sequential |
15,239 |
10,215 |
-417 |
| |
CHADS2 at model entry
|
|
Dabigatran
|
|
1
|
2-6
|
| 110 mg |
14,342 |
16,455 |
30,850 |
| 150 mg |
10,636 |
10,034 |
9,520 |
| Sequential |
9,378 |
9,476 |
10,663 |
| |
Price of daily dabigatran dose
|
|
Dabigatran
|
CHF 3
|
CHF 4
|
CHF 5
|
| 110 mg |
9,813 |
25,108 |
40,404 |
| 150 mg |
‒1,598 |
9,702 |
21,002 |
| Sequential |
‒545 |
10,215 |
20,975 |
| |
INR monitoring cost
|
|
Dabigatran
|
CHF 175
|
CHF 511
|
CHF 735
|
| 110 mg |
38,903 |
25,108 |
15,912 |
| 150 mg |
20,176 |
9,702 |
2,719 |
| Sequential |
20,034 |
10,215 |
3,669 |
| |
Discount rate
|
|
Dabigatran
|
0%
|
2%
|
4%
|
| 110 mg |
22,538 |
25,108 |
27,861 |
| 150 mg |
8,194 |
9,702 |
11,395 |
| Sequential |
8,639 |
10,215 |
11,968 |
Discussion
Patients treated with dabigatran have a higher life expectancy and experience more QALYs than patients treated with VKA. The findings from this study showed that dabigatran is able to save on medical costs of adverse events and INR monitoring costs but incurs higher total medical costs over the lifetime of patients due to the drug cost of dabigatran. Despite the longer lifetime of patients on dabigatran, the reduction of the number of events and the reduced stroke severity lead to lower clinical event cost and lower follow up costs (table 6). The largest effect of dabigatran versus VKA lies in the strong reduction of HS and ICH. The result that incremental QALYs gained are higher than incremental life years gained for dabigatran 150mg and sequential dose dabigatran indicates that the higher effectiveness of dabigatran in these scenarios mainly stems from its capability to reduce the severity of IS and not only from its superiority in preventing fatal events. This is also in line with the number of events in table 1 and table 2.
A comparison between the 150 mg and the 110 mg dosage scenarios showed that the 150 mg dose prevents substantially more IS at the disadvantage of a higher number of TIA, IH and ECH. Total QALY gains, however, were clearly higher in the 150 mg scenario and incremental costs are lower due to the higher costs of the prevented IS. The ICERs of both the 150 mg and the sequential dose scenario are less than half the size of the ICER of the 110 mg dosage scheme.
Whether dabigatran can be considered cost-effective with these ICERs depends on the threshold applied, which means how much the health care system or society is willing to pay for an additional QALY gained. As there is no established threshold in Switzerland, we will briefly discuss what could be a plausible threshold by looking at three reference values: 1) If we transfer the ICER threshold of GBP 20,000 to GBP 30,000 per QALY [49] applied in the English National Health Service to Switzerland by scaling it on the gross domestic product (GDP) per capita in 2011 [50], we obtain a threshold of CHF 60,000 to CHF 90,000 per QALY. 2) If we apply the value proposed by the WHO Commission on Macroeconomics and Health [51] for highly cost-effective interventions (less than GDP per capita), we obtain a threshold of CHF 72,000 per QALY in 2011 [50]. 3) The Swiss Federal Supreme Court uses a limit of CHF 100,000 per life year in its judgment on the reimbursement of the drug Myozyme [52].
In the face of these thresholds between CHF 60,000 and CHF 100,000 per QALY, dabigatran can be considered cost-effective in Switzerland in all three dosage scenarios. This result is confirmed by the four univariate SA and the PSA. The SA on the TTR showed that cost-effectiveness of dabigatran versus VKA is likely to be substantially better in the real world than in a controlled trial population and worse in a group of very well managed patients. In addition compliance of patients on dabigatran may also be lower, as periodic INR monitoring may enhance compliance. The PSA showed that the ICER is particularly robust in the sequential scenario.
These results should be considered in light of the conservative approach we took by making assumptions favouring the cost-effectiveness of VKA rather than dabigatran. The calculatory dose of Marcoumar®, for instance, is rather low. We also tried to avoid an underestimation of the cost of AMI, SE, and TIA, which are less effectively prevented by dabigatran, by including the cost of the first year after the event in the event cost calculation, instead of only the first three months. On the contrary, we tended to underestimate the costs of the clinical events that are more effectively prevented by dabigatran. The cost of health services used after an IS, HS and ICH are, for example, averaged over a rather long residual lifetime, which reduces the follow-up cost after these events. We also made a rather conservative assumption regarding the length of GP visits in the INR monitoring, since a 10-minute consultation per INR test is the minimum to achieve a good INR adjustment according to personal communication with GPs. We also neglected the disutility of constant INR monitoring for patients.
The study has the following strengths. Firstly, it is based on an elaborate model simulating the sequence of different treatment options and a multitude of possible clinical events. Secondly, we thoroughly adapted the costs of anticoagulation therapies and clinical events to the context of the Swiss healthcare system. Thirdly, we followed a conservative approach in the calculation of treatment and event costs, favouring VKA rather than dabigatran, which puts us on the safe side in the interpretation of the results.
However, there are some limitations that need to be mentioned. Firstly, the generalisability of the results may be limited since efficacy data mainly stemmed from patients who met inclusion criteria for the RE-LY trial. A second limitation is that QALY weights of single health events cannot be adapted to the local context as they are simply not available for Switzerland. Thirdly, in the absence of Swiss data, we need to make several assumptions on the frequency of services used and on the duration of therapies. A fourth limitation is that the model does not include long-term follow-up costs after AMI and SE, which does not represent the Swiss standard of care. Fifth, the regular visits for INR monitoring may not only induce medical costs but may also help to maintain compliance. Thus compliance could decrease when these regular visits are omitted after a switch from VKA to dabigatran.
Conclusion
Dabigatran can be considered a cost-effective therapy option for the prevention of stroke among patients with atrial fibrillation in Switzerland. The use of dabigatran is more preferable the worse VKA patients are managed.
Correspondence: Simon Wieser, PhD, Winterthur Institute of Health Economics, St. Georgenstrasse 70, CH-8400 Winterthur, Switzerland, simon.wieser[at]zhaw.ch
Acknowledgement:The authors thank three anonymous reviewers for their helpful comments and the clinicians and institutions who supported this study with information on prices, treatments and costs.
References
1 Sorensen SV, Dewilde S, Singer DE, Goldhaber SZ, Monz BU, Plumb JM. Cost-effectiveness of warfarin: trial versus “real-world” stroke prevention in atrial fibrillation. Am Heart J. 2009;157(6):1064–73.
2 Sorensen SV, Kansal AR, Connolly S, Peng S, Linnehan J, Bradley-Kennedy C, et al. Cost-effectiveness of dabigatran etexilate for the prevention of stroke and systemic embolism in atrial fibrillation: A Canadian payer perspective. Thromb Haemostasis. 2011;105(5):908–19.
3 Conen D, Osswald S, Albert CM. Epidemiology of atrial fibrillation. Swiss Med Wkly. 2009;139(25–26):346–52.
4 Go AS, Hylek EM, Phillips KA, Chang Y, Henault LE, Selby JV, et al. Prevalence of diagnosed atrial fibrillation in adults: national implications for rhythm management and stroke prevention. The anticoagulation and risk factors in atrial fibrillation (ATRIA) study. JAMA. 2001;285(18):2370–5.
5 Hylek EM, Go AS, Chang Y, Jensvold NG, Henault LE, Selby JV, et al. Effect of intensity of oral anticoagulation on stroke severity and mortality in atrial fibrillation. N Engl J Med. 2003;349(11):1019–26.
6 Lin HJ, Wolf PA, Kelly-Hayes M, Beiser AS, Kase CS, Benjamin EJ, et al. Stroke severity in atrial fibrillation. The Framingham study. Stroke. 1996;27(10):1760–4.
7 Camm AJ, Kirchhof P, Lip GYH, Schotten U, Savelieva I, Ernst S, et al. Guidelines for the management of atrial fibrillation. Eur Heart J. 2010;31:2369–429.
8 Stangier J. Pharmacology, pharmacokinetics, and pharmacodynamics of dabigatran etexilate, an oral direct thrombin inhibitor. Clin Pharmacokinet. 2008;47(5):285–95.
9 Connolly SJ, Ezekowitz MD, Yusuf S, Eikelboom J, Oldgren J, Parekh A, et al. Dabigatran versus warfarin in patients with atrial fibrillation. N Engl J Med. 2009;361(12):1139–51.
10 Connolly SJ, Ezekowitz MD, Yusuf S, Reilly PA, Wallentin L. Newly Identified events in the RE-LY trial. N Engl J Med. 2010;363(19):1875–6.
11 Shah SV, Gage BF. Cost-effectiveness of dabigatran for stroke prophylaxis in atrial fibrillation / clinical perspective. Circulation. 2011;123(22):2562–70.
12 Freeman JV, Zhu RP, Owens DK, Garber AM, Hutton DW, Go AS, et al. Cost-effectiveness of dabigatran compared with warfarin for stroke prevention in atrial fibrillation. Ann Intern Med. 2010;154(1):1–11.
13 Pink J, Lane S, Pirmohamed M, Hughes DA. Dabigatran etexilate versus warfarin in management of non-valvular atrial fibrillation in UK context: Quantitative benefit-harm and economic analyses. BMJ. 2011;343.
14 Kansal AR, Sorensen SV, Gani R, Robinson P, Pan F, Plumb JM, et al. Cost-effectiveness of dabigatran etexilate for the prevention of stroke and systemic embolism in UK patients with atrial fibrillation. Heart. 2012;98(7):573–8.
15 Fattinger K, Frisullo R, Masche U, Braunschweig S, Meier P, Roos M. No clinically relevant drug interaction between paracetamol and phenprocoumon based on a pharmacoepidemiological cohort study in medical inpatients. Eur J Clin Pharmacol. 2002;57(12):863–7.
16 Marko P, Flückiger H. Orale Antikoagulation mit Warfarin. Pharma-Kritik. 1993;15(8):29–32.
17 Kristiansen C, Lassen JF, Dahler-Eriksen BS, Dahler-Eriksen K, Larsen TB, Brandslund I. Evaluation of a simple dosage scheme for transition from phenprocoumon to warfarin in oral anticoagulation. Thromb Res. 2000;98(2):157–63.
18 van Leeuwen Y, Rosendaal FR, van der Meer FJM. The relationship between maintenance dosages of three vitamin k antagonists: Acenocoumarol, warfarin and phenprocoumon. Thromb Res. 2008;123(2):225–30.
19 European Medicines Agency – Committee for Medicinal Products for Human Use (CHMP). Product information as approved by the CHMP on 24 May 2012, pending endorsement by the European Commission. Annex I: Summary of Product Characteristics 2012.
20 Swiss National Bank. Monthly Statistical Bulletin. 2011;86(2).
21 Roskell NS, Lip GYH, Noack H, Clemens A, Plump JM. Treatments for stroke prevention in atrial fibrillation: A network meta-analyses and indirect comparisons versus dabigatran etexilate. Thromb Haemost. 2010;104(6):1106–15.
22 Walker AM, Bennett D. Epidemiology and outcomes in patients with atrial fibrillation in the United States. Heart Rhythm. 2008;5(10):1365–72.
23 Kalra L, Yu G, Perez I, Lakhani A, Donaldson N. Prospective cohort study to determine if trial efficacy of anticoagulation for stroke prevention in atrial fibrillation translates into clinical effectiveness. Br Med J. 2000;320(7244):1236–9.
24 Fritschi J, Raddaz-Müller P, Pirmin S, Wuillemin WA. Patient self-management of long term oral anticoagulation in Switzerland. Swiss Med Wkly. 2007;137:252–8.
25 Lauper P. Antikoagulanzien. Unpublished online survey commissioned by Boehringer Ingelheim GmbH. Hergiswil: GfK Switzerland AG, GfK HealthCare; 2010.
26 Niederer A, Wuillemin WA, de Moerloose P. Orale Antikoagulation: Praktisches Vorgehen. Swiss Med Forum. 2001;1(17):425–30.
27 Swiss Compendium of Medicines. Basel: Documed AG; 2011 [updated 2011 September; cited 2011 September 30]. Available from: http://www.kompendium.ch.
28 Monthly index of medical specialities. Bern: Swiss Federal Office of Public Health; 2011 [updated 2011 September; cited 2011 September 30]. Available from: http://bag.e-mediat.net/SL2007.Web.External/.
29 List of laboratory analyses. Bern: Swiss Federal Office of Public Health; 2011 [updated 2011 July 1; cited 2011 September 30]. Available from: http://www.bag.admin.ch/themen/krankenversicherung/00263/00264/04185/index.html.
30 TARMED Suisse tariff browser. Bern: TARMED Suisse; 2011 [updated 2010 April 1; cited 2011 September 30]. Available from: http://www.tarmedsuisse.ch.
31 Monthly index of medical specialities. Bern: Swiss Federal Office of Public Health; 2012 [updated 2011 September; cited 2012 September 26]. Available from: http://bag.e-mediat.net/SL2007.Web.External/.
32 Swiss Federal Statistical Office. Medical statistics of hospitals 2008. Neuchâtel: Swiss Federal Statistical Office; 2010.
33 Swiss Federal Statistical Office. Statistics of diagnosis related cost: cost per case by AP-DRG and hospital typology – year 2008. Neuchchâtel: Swiss Federal Statistical Office; 2010.
34 Swiss Federal Statistical Office. Costs and financing of the health care system – detailed results 2008 and recent developments. Neuchâtel: Swiss Federal Statistics Office; 2011.
35 Wieser S, Rüthemann I, De Boni S, Eichler K, Pletscher M, Radovanovic D, et al. Cost of acute coronary syndrome in Switzerland in 2008. Swiss Med Wkly. 2012;142:0.
36 santésuisse. Inpatient tariffs in hospitals. March 2008 ed. Solothurn: tarifsuisse AG; 2008.
37 Swiss Federal Statistical Office. Statistics of social medical insitutions 2008 – statistical table. Neuchâtel: Swiss Federal Statistical Office; 2010.
38 Brüggenjürgen B, Rupprecht HJ, Willich SN, Spannagl M, Ehlken B, Smala A, et al. Cost of atherothrombotic diseases – myocardial infarction, ischaemic stroke and peripheral arterial occlusive disease in Germany. J Public Health. 2005;13(4):216–24.
39 Mahler MP, Zuger K, Kaspar K, Haefeli A, Jenni W, Leniger T, et al. A cost analysis of the first year after stroke – early triage and inpatient rehabilitation may reduce long term costs. Swiss Med Wkly. 2008;138(31-32):459–65.
40 Husi B. Pflegefinanzierung (Festlegung des kantonalen Vergütungs anteils 2012 im Bereich der Akut- und Übergangspflege). Auszug aus dem Protokoll des Regierungsrates des Kantons Zürich 2011; Sitzung vom 23. März 2011.
41 Landesindex der Konsumentenpreise. Neuchâtel: Swiss Federal Office of Statistics; 2011 [updated 2011; cited 2011 September 30]. Available from: http://www.bfs.admin.ch/bfs/portal/de/index/themen/05/02.html.
42 Brønnum-Hansen H, Davidsen M, Thorvaldsen P, Group ftDMS. Long-term survival and causes of death after stroke. Stroke. 2001;32(9):2131–6.
43 Minn YK, Cho SJ, Kim SG, Kwon KH, Kim JH, Oh MS, et al. Long-term outcomes of acute ischemic stroke in patients aged 80 years and older. Yonsei Med J. 2008;49(3):400–4.
44 Sullivan PW, Arant TW, Ellis SL, Ulrich H. The cost effectiveness of anticoagulation management services for patients with atrial fibrillation and at high risk of stroke in the US. PharmacoEconomics. 2006;24(10):1021–33.
45 Tengs TO, Lin TH. A meta-analysis of quality-of-life estimates for stroke. PharmacoEconomics. 2003;21(3):191–200.
46 Hentrich DP, Fritschi J, Muller PR, Wuillemin WA. INR comparison between the CoaguCheck S and a standard laboratory method among patients with self-management of oral anticoagulation. Thromb Res. 2007;119(4):489–95.
47 Wieloch M, Själander A, Frykman V, Rosenqvist M, Eriksson N, Svensson PJ. Anticoagulation control in Sweden: reports of time in therapeutic range, major bleeding, and thrombo-embolic complications from the national quality registry AuriculA. Eur Heart J. 2011;32(18):2282–9.
48 Banerjee A, Lane DA, Torp-Pedersen C, Lip GY. Net clinical benefit of new oral anticoagulants (dabigatran, rivaroxaban, apixaban) versus no treatment in a “real world” atrial fibrillation population: a modelling analysis based on a nationwide cohort study. Thromb Haemost. 2012;107(3):584–9.
49 McCabe C, Claxton K, Culyer AJ. The NICE cost-effectiveness threshold: what it is and what that means. PharmacoEconomics. 2008;26(9):733–44.
50 World economic outlook database. International Monetary Fund; 2011 [updated 2011; cited 2011 September 30]. Available from: http://www.imf.org/external/pubs/ft/weo/2011/02/weodata/WEOSep2011all.xls.
51 WHO cost-effectiveness thresholds. World Health Organization; 2012 [updated 2011; cited 2012 January 22]. Available from: http://www.who.int/choice/costs/CER_thresholds/en/index.html.
52 Federal Supreme Court of Switzerland. Judgement of 23 November 2010. 9C 334/2010 2011.