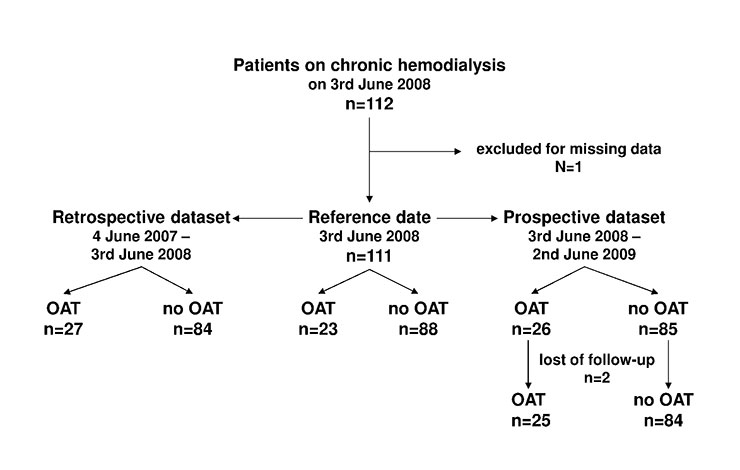
Figure 1
Study design. OAT: Oral anticoagulation therapy
DOI: https://doi.org/10.4414/smw.2013.13730
Abbreviations
AF atrial fibrillation
ASA acetylsalicylic acid
CAD coronary artery disease
CVA cerebrovascular accident
DM diabetes mellitus
ESRD end stage renal disease
INR international normalised ratio
OAT oral anticoagulation treatment
PAD peripheral arterial disease
PAI platelet aggregation inhibitor
PC permanent tunnelled central venous catheter
The standard intervention for therapy and prevention of thromboembolic events is oral anticoagulation therapy (OAT) with vitamin K antagonists. OAT has a narrow therapeutic range with risk of bleeding in over-anticoagulation and risk of thromboembolism in under-anticoagulation [1]. It is monitored by measurement of prothrombin time, expressed as international normalised ratio (INR) [2, 3]. An INR below 1.3 indicates a normal prothrombin time, while values above this reference indicate a prolonged prothrombin time and an increased risk of bleeding [4]. To minimise complications, OAT dosage is continuously adapted to keep the INR within a defined target range. American College of Chest Physicians (ACCP) guidelines currently recommend a moderate intensity OAT (target INR 2.0–3.0), but state that a single therapeutic target range may not be optimal for all indications [2]. Depending on the stability of INR results, INR should be monitored between daily at the initiation of OAT and at least once every 12 weeks when a stable dose of OAT has been established [5]. INR control correlates negatively with the risk of adverse events [6, 7]. However, good INR control is difficult to achieve. In a meta-analysis of 47 studies in outpatients with atrial fibrillation (AF) mostly treated with warfarin, median percentage of INR in target range was 53% (range 34–68%) for retrospective studies, whereby 26% (10–51%) and 17% (14–29%) of all measurements were below and above target range, respectively [6]. In recently published randomized controlled trials comparing safety and efficacy of factor Xa and thrombin inhibitors to warfarin in patients with AF or acute venous thromboembolism, 50 to 67% of INRs in the warfarin group were in target range [8–15].
Since patients on chronic haemodialysis suffer from a variety of co-morbidities associated with thromboembolic complications, the need for antithrombotic prophylaxis and therapy is high in this group of patients. The prevalence of AF in patients on dialysis varies between 7.7% and 27% [16–22], while in the general population its overall prevalence is 0.95%, ranging from 0.1% in patients younger than 55 years to 9% in patients older than 80 years [23]. Additionally, vascular accesses such as arterio-venous graft and permanent tunnelled central venous catheter (PC) present an increased risk of local or systemic thromboembolism [24–27].
However, only few studies have been published on the control of OAT in end stage renal disease (ESRD) and dialysis [21, 28, 29]. There is to date no study evaluating phenprocoumon in haemodialysis patients. The aim of this study was to analyse the quality of OAT control in a chronic haemodialysis population treated with phenprocoumon and to document potential effects on thromboembolic and bleeding events.
We conducted a cohort study including all patients who were on chronic haemodialysis at the University Hospital of Basel on 3 June 2008 (reference date). Patients quitting the program before or entering it after this date were not included. Data about oral anticoagulation control were collected retrospectively for 12 months preceding the reference date and prospectively for 12 months following the reference date (fig. 1). Initiated primarily as a quality control survey, the study was performed without approval by the institutional review board and informed consent was not obtained from the study participants. Prior to data analysis this mistake was disclosed and reported to the Ethical Committee of both Cantons of Basel. The Ethical Committee has examined the issue and reviewed the study protocol on 2-23-2011. No ethical concerns have been raised apart from the failure to submit timely.
Figure 1
Study design. OAT: Oral anticoagulation therapy
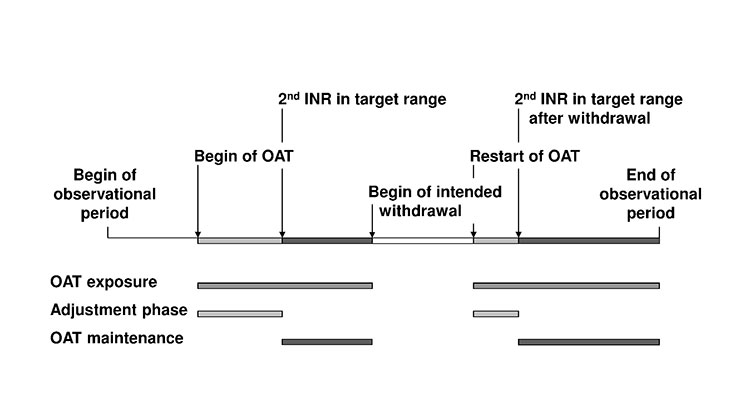
Figure 2
Definition of oral anticoagulation therapy (OAT) exposure, adjustment phases and OAT maintenance. OAT: oral anticoagulation therapy. OAT exposure: time from the first dose of OAT to the end of OAT (temporary or definitive). Adjustment phase: time from first INR at start/restart of OAT to the 2nd INR value within target range. Intended withdrawal: time of temporary suspension of OAT (e.g., for scheduled surgery). OAT maintenance: time from 2nd INR value in target range after start/restart to end of OAT (temporary or definitive).
In the dialysis programme at the University Hospital Basel all clinical data are prospectively and continuously collected in standardised flow sheets and in medical records. Baseline characteristics, indication for OAT, INR target range and INR measurements in the retrospective dataset were abstracted from the medical records by a single trained researcher (RG). The same researcher prospectively collected INR measurement and outcome data of the secondary endpoints for the prospective dataset. Preceding the statistical analysis, all data points were re-evaluated by an independent physician (CP). Both researchers had no influence on treatment decisions. The study was unblinded and the treating medical care team informed about the study.
Co-morbidities were reported and defined as follows: diagnosis of diabetes mellitus (DM) with prescription of either oral antidiabetics or insulin, or an entry in the medical record of DM according to current diagnostic criteria [30]. Diagnosis of coronary artery disease (CAD) was based either on a positive stress test, a positive coronary angiography, an aorto-coronary bypass or an entry in the medical record of an acute coronary event. Peripheral arterial disease (PAD) was defined by duplex ultrasound, angiography, a history of percutaneous angioplasty or bypass surgery, or an appropriate clinical event in the medical history. Diagnosis of an ischaemic cerebrovascular accident (CVA) was based on a medical record of a clinical event. Vascular disease was used to summarise any history of CAD, PAD and CVA. Active malignancies were based on a histological diagnosis. The diagnosis of autoimmune disease was based on the decision of the “Interdisciplinary Vasculitis Board” of the University Hospital Basel.
Underlying renal pathologies were summarised in nine categories: Vascular nephropathy, diabetic nephropathy, glomerulonephritis, focal segmental glomerulosclerosis, analgesic nephropathy, polycystic kidney disease, interstitial nephropathy, other and unknown. Medication with platelet aggregation inhibitors (PAI) (acetylsalicylic acid (ASA) or clopidogrel) was recorded.
Primary endpoint was the percentage of INR values within the target range during OAT maintenance. The number of INR measurements within, above and below target range was recorded. If not defined otherwise for specific clinical reasons, INR target ranges were: for prosthetic mitral valve 2.5 to 3.5, for AF, prosthetic aortal valve, pulmonary embolism or deep venous thrombosis 2.0–3.0 and for PC and arterio-venous graft 2.0–2.5 [31–33]. Secondary endpoints were patient outcome including the frequency of bleeding (cerebral, gastrointestinal, soft tissue) and thromboembolic events (venous thrombosis, pulmonary embolism, CVA, thrombosis of the arterio-venous fistula, catheter dysfunction).
All INR measurements were performed in the central laboratory of the University Hospital Basel. Prothrombin time was measured in citrate plasma using a standardised reagent (Dade® Innovin, Siemens) with an ISI value of 0.9, and a fully automated clotting detector (STA-R® Evolution Coagulation Analyzer, Diagnostica Stago Inc.). The test is insensitive to therapeutic levels of Heparin (Heparin concentration <1U per ml citrate plasma). In most patients INR control was part of a weekly performed complete blood count and blood chemistry monitoring. Blood samples for INR measurements were taken after puncture of the vascular access. Subsequently, all of our patients, regardless of the OAT status, received intravenous low molecular weight heparin (enoxaparin (Clexane®), 60 U per kg bodyweight) to avoid clotting of the dialysis filter as reported previously [34].
In view of the fact that a low intake of vitamin K may cause unstable OAT, all of our patients on haemodialysis were regularly seen by dieticians [35]. The importance of regular dietary intake of vitamin K and the pitfalls of vitamin supplements that may contain vitamin K were discussed. Further, patients were instructed to keep vitamin K intake adequate and consistent avoiding excess of vitamin K rich food as well as diets low in vitamin K.
The following definitions were used (fig. 2):
i) OAT exposure: time from first dose of OAT to end of OAT (temporary or definitive).
ii) Adjustment phase of OAT: time from first INR at start/restart of OAT to 2nd INR within target range.
iii) Intended withdrawal of OAT: time of temporary suspension of OAT (e.g. for scheduled surgery).
iv) OAT maintenance: time from 2nd INR in target range after start/restart to end of OAT (temporary or definitive).
v) Frequency of measurements, expressed by the average number of days between INR measurements: duration of OAT divided by number of INR measurements.
vi) INR measurements within target range (%): Number of measurements within the clinical defined target range divided by number of performed measurements.
The statistical analyses were performed using SPSS/PC (IBM SPSS Statistics 19). Discrete variables are expressed as counts (percentage) and continuous variables as median and range. Comparison between male and female patients or patients with and without OAT was done with Fisher’s exact test for categorial variables and Mann-Whitney test for not normally distributed continuous variables. Correlations between not normally distributed continuous variables were calculated using Spearman-Rho correlation coefficient. Significances are 2-tailed. A statistical significance level of <0.05 was used.
112 patients were on chronic haemodialysis on 3 June 2008. After exclusion of one patient due to missing data, 111 patients were enrolled in the study. Two female patients were lost to follow-up due to transfer to another dialysis centre but remained in the analysis until the transfer date (day 49 and day 115 of the prospective dataset) (fig. 1).
All patients received phenprocoumon as OAT. Overall 30 patients (27%) received OAT, 23 patients in both observational periods, 4 patients in the retrospective dataset (n = 27) only and 3 patients in the prospective dataset (n = 26) only (fig. 1).
The most frequent reasons for OAT were AF (36%, n = 11) and PC (27%, n = 8) (table 1). Mean CHADS2 score in patients receiving OAT for AF was 2.6 (SD 1.1) [36]. In male AF (50%, n = 7) and aortic valve replacement (29%, n = 4) and in female AF (25%, n = 4) and PC (44%, n = 7) were the most common reason for OAT. PC as a reason for OAT were more common in female (44%, n = 7) than in male (7%, n = 1) (p = 0.04). Corresponding with the indication, the most frequent target INR value was 2.0–2.5 for women and 2.0–3.0 for men (table 1).
Patient characteristics by OAT status are summarised in table 2. Apart from the number of patients treated with PAI, there was no difference in baseline characteristics in patients treated with OAT or without OAT.
In the prospective dataset, median time of OAT exposure was 306 days (range 63–365) (table 3). The median number of days between INR measurements during OAT exposure was 6 days (range 4–13 days). 44% (range 0–62%) of all INR measurements were within the target INR range. While 23 of the 26 patients already had OAT at the reference date, 3 patients started OAT for the first time during the prospective dataset. In addition, 20 adjustment phases were caused by an intended withdrawal in 13 patients (1–5 episodes per patient). Median duration of the adjustment phases was 20 days (range 1–80 days) and the median number of INR measurements was 4 (range 1–13). The median duration of OAT maintenance was 285 days (range 0–365 days). During the OAT maintenance, the median number of days between INR measurements was 6.5 days (range 4–13 days). 49% (range 21–65%) of all INR measurements during OAT maintenance were within, 19% (range 4–56%) above and 33% (range 9–57%) below the target range (table 3). The median percentage of INR in/below/above target range during OAT maintenance did not differ between patients treated with or without PAI (data not shown). There was no correlation between frequency of measurements and percentage of INR in target range (Spearman-Rho 0.211, p = 0.3). Characteristics of OAT in the retrospective dataset were similar to the prospective dataset and are summarised in table 3.
In the retrospective and prospective dataset, the percentage of INR measurements within target range was significantly higher in patients with a target range width of 1.0 (59% and 50%, respectively) than in patients with a target range width of 0.5 (45% and 39%, respectively) (p = 0.04 and p = 0.02, respectively) (table 4). The percentage of INR measurements above target range was lower in patients with an upper limit of 3.0 (17% and 15%, respectively) than in patients with an upper limit of 2.5 (25% and 27%, respectively). However, the difference was not statistically significant (p = 0.5 and p = 0.1, respectively) (table 4).
Two female patients (one with OAT) were lost to follow-up due to change to another dialysis centre. Of the remaining 109 patients in the prospective dataset, a total of 24 (22%) patients discontinued dialysis. 12 (11%) patients received a kidney transplant; none of them had OAT. Twelve (11%) patients died during the observational period. The number of deaths was significantly higher in the OAT group (32% versus 5%, p = 0.001) (table 5).
Overall, 10 patients (9%) had 11 thromboembolic events. The percentage of patients with at least one thromboembolic event was 4% in patients with and 11% in patients without OAT. In total, 7 patients (6%) had 9 bleeds. The percentage of patients with at least one bleed was 4% in patients with and 7% in patients without OAT. There was no statistically significant difference in number of bleeding or thromboembolic events between patients with and without OAT (table 5).
Five of the nine bleeds occurred in patients who had a PAI therapy (all ASA). None of the patients with bleeds had a dual therapy (ASA + clopidogrel or PAI + OAT) (table 6).
| Table 1: Indication for oral anticoagulation therapy (OAT) and INR target range overall and by gender. | ||||
| All n = 30 (100%) | Female n = 16 (53%) | Male n = 14 (47%) | p-value° | |
| Indication for OAT | 0.03 | |||
| Atrial fibrillation (AF) | 11 (36%) | 4 (25%) | 7 (50%) | 0.3 |
| Aortal prosthetic valvea | 5 (17%) | 1 (6%) | 4 (29%) | 0.2 |
| Permanent catheter (PC)b | 8 (27%) | 7 (44%) | 1 (7%) | 0.04 |
| Repeated shunt occlusions | 3 (10%) | 3 (19%) | 0.2 | |
| Otherc | 3 (10%) | 1 (6%) | 2 (14%) | 0.6 |
| INR target range | 0.02 | |||
| 2.0–2.5 | 12 (40%) | 10 (63%) | 2 (14%) | 0.01 |
| 2.0–3.0 | 16 (54%) | 5 (31%) | 11 (79%) | 0.01 |
| 2.5–3.0 | 1 (3%) | 1 (7%) | 0.5 | |
| 3.0–3.5 | 1 (3%) | 1 (6%) | 1.0 | |
| Included were all patients who were exposed to OAT in the retrospective and/or the prospective dataset. Data are displayed as counts and percentage (%) of exposed patients. °p-value of difference between male and female patients, Fisher’s exact Test; aone patient with target INR 2.5–3.0; bone patient with target INR 3.0–3.5; cone patient with myocardial dyskinesia with target INR 2.0–3.0, one patient with vasculitis and repeated arterial occlusions with target INR 2.0–2.5, one patient with metastatic cancer with target INR 2.0–3.0. | ||||
| Table 2: Patient characteristics by oral anticoagulation therapy (OAT) status. | ||||
| Patient characteristics | All n = 111 (100%) | OAT n = 30 (27%) | No OAT n = 81 (73%) | p-value° |
| Male sex | 59 (53) | 14 (47) | 45 (56) | 0.5# |
| Age (years) | 69 [21-93] | 70 [26-82] | 68 [21-93] | 0.5* |
| Age at start of dialysis (years) | 65 [17-93] | 67 [24-79] | 65 [17-93] | 0.5* |
| Time on dialysis (years) | 2.5 [0-17] | 2.7 [0-17] | 2.5 [0-15] | 0.6* |
| BMI (kg/m2) | 26 [17-59] | 26 [19-37] | 26 [17-59] | 0.4* |
| Co-morbidities | ||||
| Diabetes mellitus | 40 (36%) | 10 (33%) | 30 (37%) | 0.8# |
| – Type 1 | 3 (3%) | 1 (3) | 2 (3%) | 1.0# |
| – Type 2 | 37 (33%) | 9 (30%) | 28 (35%) | 0.8# |
| Vascular diseasea | 49 (44%) | 12 (40%) | 37 (46%) | 0.7# |
| – Coronary artery disease (CAD) | 32 (29%) | 10 (33%) | 22 (27%) | 0.6# |
| – Peripheral arterial disease (PAD) | 28 (25%) | 10 (33%) | 18 (22%) | 0.3# |
| – Cerebrovascular accident (CVA) | 9 (8%) | 2 (7%) | 7 (9%) | 1.0# |
| Chronic obstructive pulmonary disease | 12 (11%) | 3 (10%) | 9 (11%) | 1.0# |
| Autoimmune disease | 9 (8%) | 4 (13%) | 5 (6%) | 0.2# |
| Malignancies | 16 (14%) | 2 (7%) | 14 (17%) | 0.2# |
| Underlying kidney disease | 0.7# | |||
| Vascular nephropathy | 24 (22%) | 7 (23%) | 17 (21%) | |
| Diabetic nephropathy | 20 (18%) | 7 (23%) | 13 (16%) | |
| Glomerulonephritis | 17 (15%) | 6 (20%) | 11 (14%) | |
| Focal segmental glomerulosclerosis | 11 (10%) | 2 (7%) | 9 (11%) | |
| Analgesic nephropathy | 7 (6%) | 2 (7%) | 5 (6%) | |
| Polycystic kidney disease | 4 (4%) | 4 (5%) | ||
| Interstitial nephropathy | 3 (3%) | 3 (4%) | ||
| Otherb | 12 (11%) | 2 (7%) | 10 (12%) | |
| Unknown | 13 (12%) | 4 (13%) | 9 (11%) | |
| Platelet aggregation inhibitors | ||||
| PAI overall | 57 (51%) | 10 (33%) | 47 (58%) | 0.03# |
| – ASA | 50 (45%) | 10 (33%) | 40 (49%) | 0.1# |
| – Clopidogrel | 2 (2%) | 2 (3%) | 1.0# | |
| – ASA and clopidogrel | 6 (5%) | 1 (3%) | 5 (6%) | 1.0# |
| Included were all patients who were exposed to OAT in the retrospective and/or the prospective dataset. Data are displayed as median [range] or counts and percentage (%). *Mann-Whitney-U-Test; #Fisher’s exact Test; °p-values: comparing OAT and no-OAT; avascular disease: patient suffered at least from one of CAD, PAD, CVA; bincludes vesicoureteral reflux (n = 5), nephrectomy due to renal cell carcinoma (n = 3), multiple myeloma (n = 2), cystinosis (n = 2); PAI = platelet aggregation inhibitors; ASA = acetylsalicylic acid. | ||||
| Table 3: Characteristics of oral anticoagulation therapy (OAT). | ||
| Retrospective dataset n = 27 | Prospective dataset n = 26 | |
| OAT exposure (days) | 334 (12-365) | 306 (63-365) |
| INR measurements (n) | 47 (2–81) | 40 (10-67) |
| Number of days between measurementsa | 6 (1-16) | 6 (4-13) |
| % of INR measurements in target range | 44 (0-70) | 44 (0-62) |
| Adjustment phases (nb) | 33 [11+22] | 23 [3+20] |
| Duration per episode (days) | 13 (1-63) | 20 (1-80) |
| INR measurements per episode (n) | 4.5 (2-12) | 4 (1-13) |
| OAT maintenance (days) | 306 (0-365) | 285 (0-365) |
| INR measurements (n) | 41 (0-79) | 36 (0-67) |
| Number of days between measurementsa | 6.5 (5-13) | 6.5 (4-13) |
| % of INR measurements in target range | 54 (17-74) | 49 (21-65) |
| % of INR measurements above target range | 17 (0-45) | 19 (4-56) |
| % of INR measurements below target range | 27 (8-83) | 33 (9-57) |
| Data are displayed as median and (range). OAT exposure: time from first dose of OAT to end of OAT (temporary or definitive). Adjustment phase: time from first INR at start/restart of OAT to the 2nd INR value within target range. OAT maintenance: Time from 2nd INR value in target range after start/restart to end of OAT (temporary or definitive) with normalisation of INR. % of INR measurements in target range: Number of measurements within the clinical defined target range divided by number of performed measurements. aTime under OAT (days)/number of measurements; bnumber of episodes [new beginnings + restart after intended withdrawal]. | ||
| Table 4: INR target range and oral anticoagulation therapy (OAT) control during OAT maintenance*. | |||
| Width of INR target range 0.5a | Width of INR target range 1.0 | p-value° | |
| % in target range in retrospective dataset (n = 13 / n = 12)c | 45 (17-71) | 59 (33-74) | 0.04 |
| % in target range in prospective dataset (n = 10 / n = 14)c | 39 (21-56) | 50 (32-65) | 0.02 |
| Upper limit of INR target range 2.5 | Upper limit of INR target range 3.0b | ||
| % above target range in retrospective dataset (n = 11 / n = 13) | 25 (0-45) | 17 (8-36) | 0.5 |
| % above target range in prospective dataset (n = 8 / n = 15) | 27 (6-56) | 15 (4-37) | 0.1 |
| Data are displayed as median and (range). °p-value of difference between groups in Mann-Whitney-U-Test; *OAT maintenance: Time from 2nd INR value in target range after start/restart to end of OAT (temporary or definitive) with normalisation of INR; aincludes all patients with a target range of 2.0–2.5, 2.5–3.0 or 3.0–3.5; bincludes all patients with a target range of 2.0–3.0 or 2.5–3.0; cnumber of patients in left/right column. | |||
| Table 5: Outcome by oral anticoagulation therapy (OAT) status. | ||||
| All n = 111 | OAT n = 26 | No OAT n = 85 | p-value | |
| Lost to follow-up | 2 (2%) | 1 (4%) | 1 (1%) | 1.0# |
| Transplantation | 12 (11%) | 12 (14%) | 0.06# | |
| Death | 12 (11%) | 8 (32%)a | 4 (5%)b | 0.001# |
| No thromboembolic event | 101 (91%) | 25 (96%) | 76 (89%) | 0.5# |
| Shunt thrombosis | 7 (6%) | 1 (4%)c | 6 (7%) | 1.0# |
| Ischaemic cerebrovascular accident (CVA) | 4 (4%) | 4 (5%)d | 1.0# | |
| No bleeding event | 104 (94%) | 25 (96%) | 79 (93%) | 0.6# |
| Soft tissue bleedinge | 4 (4%) | 1 (4%)e | 3 (3%) | 1.0# |
| Gastrointestinal bleedingf | 4 (4%)f | 4 (5%) | 0.6# | |
| Intracerebral bleedingf | 1 (1%)f | 1 (1%) | 1.0# | |
| Data are displayed as counts of events and percentage of exposed patients. #Fisher’s exact Test. Due to the fact that repeated bleeds or thromboembolic events were possible in the same patient, numbers do add up to more than 100% (one patient with a second soft tissue bleed, one patient with gastrointestinal bleeding and posttraumatic intracerebral bleeding (medication with acetylsalicylic acid), one patient with a second ischaemic CVA; all in the No OAT group);. aone patient died from cardiac arrest, two patients died from acute infection with underlying severe peripheral arterial disease and previous limb amputation. For 5 patients who died out of hospital the definitive cause of death was indeterminate, and unfortunately no autopsy was performed; btwo patients died after withdrawal of dialysis, one patient died from a metastatic small cell lung carcinoma, one patient died after repeated cerebrovascular insults; cINR at event: 1.5; dthree strokes (two in the same patient) and one transient ischaemic attack; eone major bleeding event, INR at event: 7.7, no platelet aggregation inhibitor involved; fall major bleeding events. Definition of CVA, minor and major bleeding events as described in the RE-LY study protocol [52]. | ||||
| Table 6: Number of bleeding events stratified by platelet aggregation inhibitors (PAI) and oral anticoagulation therapy (OAT) status. | ||||
| Medication and total number of bleeding events | All n = 9 (111) | OAT n = 1 (26) | No OAT n = 8 (85) | p-value° |
| ASA | 5/50 (10%)a | 0/7 | 5/43(12%)a | 1.0# |
| Clopidogrel | 0/2 | 0/0 | 0/2 | |
| ASA and Clopidogrel | 0/5 | 0/0 | 0/5 | |
| No platelet aggregation inhibitors | 4/54 (8%)a | 1/19 (5%) | 3/35 (9%)a | 1.0# |
| Number of bleeding events/ total number of exposed patients and percent (); #Fisher’s exact Test. ASA = acetylsalicylic acid; °p-value of difference of number of bleedings between OAT and no-OAT group; atwo bleeding events in the same patient. | ||||
This is the first study analysing the quality of OAT control in patients treated with phenprocoumon in a chronic haemodialysis population. The median percentage of INR measurements in the target range was around 50% and comparable with previously published data on OAT control with warfarin and acenocoumarol in ESRD (37–50% in target range) [21, 28, 29]. In a secondary analysis by Limdi et al. of a prospective cohort study on OAT with warfarin in 53 ESRD patients, 40% of INR measurements were within the target range of 2.0–3.0 [28]. In a retrospective cohort study by To et al. on 155 patients on haemodialysis, 11 patients receiving warfarin had INR values in the therapeutic range 50% of the time [21]. In a retrospective study by Gompou et al. on INR deviations in 11 haemodialysis patients under OAT with acenocoumarol, 37% of INR measurements were within the target range of 2.0–2.5 [29].
However, since a variety of factors substantially influence INR control, direct comparison of INR control between studies is difficult. Several methods for measuring quality of OAT are established [7]. The fraction of time in therapeutic range by linear interpolation is considered the most elaborate method because it is unbiased by more frequent measurements in patients with out of range INRs [7], but it is less practical and so far has not been utilised for the evaluation of OAT in ESRD. As in the present study, Limdi et al. measured the individual percentage of measurements in target range [28]. To et al. described a ‘proportion of time in target range’, but did not specify the method utilised [21]. Gompou et al. calculated the population based percentage of INR in target range for all measurements obtained during the study period [29]. Both individual and population based percentage of measurements in target range can be biased by more frequent measurements in patients with difficult adjustment of OAT, resulting in an underestimation of OAT control [37]. In our study, we did not find a correlation between individual frequency of measurements and percent of INR in target range. To determine whether a high frequency of measurements per se leads to a better OAT control, a randomized study with predefined frequencies of measurement would be needed. In our study, in spite of a higher frequency of INR measurements compared to other studies (measurements every 21–31 days [28, 29]) the percentage of INR in target range did not exceed 54%.
The indication for OAT may influence the percentage of INR measurements in target range both as an independent risk factor and via the height and width of target range [7, 38, 39]. Obviously, as directly shown in our study, patients with a wider target range are more likely to have a higher percentage of INRs in target range than patients with a narrower target range. Similar results could be seen by indirect comparison of studies with different target ranges. In the study by Gompou et al. the percentage of INR measurements was 37%, with an INR target range width of 0.5 (INR 2.0–2.5), while in the studies by Limdi et al. and To et al. the percentages of INR measurements in target range were 40% and 50% with a target range width of 1.0 (INR 2–3) [21, 28, 29]. The absolute height of target range also can influence the percentage of INR measurements in target range. In our study the percentage of INR measurements above target range was lower in patients with a higher compared to patients with a lower upper limit of target range. Physicians are probably more carefully avoiding an INR above a predefined high upper limit of target range [38].
Pharmacological differences between oral anticoagulants are another potential influencing factor that needs to be considered. While warfarin, the most investigated oral anticoagulant agent, has a half life of 20–60 hours, the half-life of phenprocoumon is 72–96 hours. The effect of this difference in pharmacokinetics has been discussed controversially [39]. The longer half life of phenprocoumon could lead to a more stable blood level and INR in OAT maintenance and contrary to the need of more time to readjust INRs outside the range. Two recent cohort studies that directly compared phenprocoumon and warfarin in non-ESRD patients found that phenprocoumon allowed a better INR control than warfarin [39, 40]. While Leiria et al. described the percentage of measurements in target range of 60.7% with phenprocoumon and 45.6% with warfarin (p = 0.001) [40], the difference in time in therapeutic range described by Jensen et al. was minimal (74% versus 70.2%, p = 0.008) [39]. Thus, while there is a lack of consistent studies directly comparing the two agents, these data suggest that with respect to OAT control phenprocoumon seems to be at least not inferior to warfarin.
Since OAT withdrawals and adjustment phases can lead to a substantial underestimation of OAT control, we studied OAT control for both overall exposure and OAT maintenance. In our study, the percentage of INR in target range in OAT maintenance was 5–10% higher than in overall OAT exposure.
Previously published studies on OAT in the general population have shown that the incidence of thromboembolic events correlates with the percentage of INR below target range, and the incidence of bleeding events increases with poor INR control, specifically when INR is very high [6, 7, 41, 42]. In our study, the number of patient years and thromboembolic or bleeding events observed was not sufficient to allow a correlation with INR control. However, we did not find evidence for excessive bleeding in patients with OAT as described by some authors for ESRD patients [16, 43–45]. The higher number of bleedings in the patients without OAT in our study may be partly explained by the high prevalence of PAI in this group and the close INR monitoring in the OAT group. Recent studies indicate that while the efficacy of OAT for stroke prevention in patients with AF is superior to PAI, the bleeding risks of moderate dose OAT (target INR 2–3) and of PAI treatment might be similar [46, 47].
The number of deaths was significantly higher in the OAT group, but only one of these deaths was directly associated with OAT. Although the patient characteristics did not significantly differ, many patients on OAT are part of a high risk population due to the medical condition requiring OAT, e.g. AF and mechanical heart valve replacement. Consistently, no patient in the OAT group was scheduled for a kidney transplant. Therefore, the higher number of deaths might not be attributed to the OAT but rather to the higher mortality risk of the exposed patient group.
This study has several limitations: The number of patients under OAT was relatively small, limiting the power of the investigation. Additionally, we were not able to report on influencing factors such as dietary vitamin K intake and drug-drug interactions or on genetic factors influencing response to OAT [48–51].
While for the general population the new generation of oral anticoagulants might simplify OAT in the near future, its application in ESRD patients will be limited due to the lack of studies and/or to altered pharmacokinetics. Therefore, OAT with vitamin K antagonists will remain a basic strategy for therapy and prevention of thromboembolic events in ESRD. To allow informed treatment decisions, our results have to be confirmed in larger studies powered for analysing the factors influencing INR control and the impact of INR control on bleeding and thromboembolic events in ESRD patients treated with phenprocoumon.
Authors’ contribution: C. Praehauser and R. Grandjean both contributed equally and should be considered as first authors.
Acknowledgement: The authors thank Catherine Haenlin, patient administrator of our dialysis unit, for her help during the data collection process. Further, a particular debt of gratitude is owed to our nursing team for their enthusiasm and daily work to achieve the best care for our patients.
1 Reynolds MW, Fahrbach K, Hauch O, Wygant G, Estok R, Cella C, et al. Warfarin anticoagulation and outcomes in patients with atrial fibrillation: a systematic review and metaanalysis. Chest. 2004;126(6):1938–45.
2 Ageno W, Gallus AS, Wittkowsky A, Crowther M, Hylek EM, Palareti G, et al. Oral anticoagulant therapy: antithrombotic therapy and prevention of thrombosis, 9th ed: American College of Chest Physicians Evidence-Based Clinical Practice Guidelines. Chest. 2012;141(2 Suppl):e44S–88S.
3 Kirkwood TB. Calibration of reference thromboplastins and standardisation of the prothrombin time ratio. Thromb Haemost. 1983;49(3):238–44.
4 van der Meer FJ, Rosendaal FR, Vandenbroucke JP, Briet E. Bleeding complications in oral anticoagulant therapy. An analysis of risk factors. Arch Intern Med. 1993;153(13):1557–62.
5 Guyatt GH, Akl EA, Crowther M, Gutterman DD, Schuunemann HJ, American College of Chest Physicians Antithrombotic T, et al. Executive summary: antithrombotic therapy and prevention of thrombosis, 9th ed: American College of Chest Physicians Evidence-Based Clinical Practice Guidelines. Chest. 2012;141(2 Suppl):7S–47S.
6 Wan Y, Heneghan C, Perera R, Roberts N, Hollowell J, Glasziou P, et al. Anticoagulation control and prediction of adverse events in patients with atrial fibrillation: a systematic review. Circ Cardiovasc Qual Outcomes. 2008;1(2):84–91.
7 Kaatz S. Determinants and measures of quality in oral anticoagulation therapy. J Thromb Thrombolysis. 2008;25(1):61–6.
8 Granger CB, Alexander JH, McMurray JJ, Lopes RD, Hylek EM, Hanna M, et al. Apixaban versus warfarin in patients with atrial fibrillation. N Engl J Med. 2011;365(11):981–92.
9 Patel MR, Mahaffey KW, Garg J, Pan G, Singer DE, Hacke W, et al. Rivaroxaban versus warfarin in nonvalvular atrial fibrillation. N Engl J Med. 2011;365(10):883–91.
10 Lip GY, Rasmussen LH, Olsson SB, Jensen EC, Persson AL, Eriksson U, et al. Oral direct thrombin inhibitor AZD0837 for the prevention of stroke and systemic embolism in patients with non-valvular atrial fibrillation: a randomized dose-guiding, safety, and tolerability study of four doses of AZD0837 vs. vitamin K antagonists. Eur Heart J. 2009;30(23):2897–907.
11 11 Connolly SJ, Ezekowitz MD, Yusuf S, Eikelboom J, Oldgren J, Parekh A, et al. Dabigatran versus warfarin in patients with atrial fibrillation. N Engl J Med. 2009;361(12):1139–51.
12 Wallentin L, Yusuf S, Ezekowitz MD, Alings M, Flather M, Franzosi MG, et al. Efficacy and safety of dabigatran compared with warfarin at different levels of international normalised ratio control for stroke prevention in atrial fibrillation: an analysis of the RE-LY trial. Lancet. 2010;376(9745):975–83.
13 Schulman S, Kearon C, Kakkar AK, Mismetti P, Schellong S, Eriksson H, et al. Dabigatran versus warfarin in the treatment of acute venous thromboembolism. N Engl J Med. 2009;361(24):2342–52.
14 Weitz JI, Connolly SJ, Patel I, Salazar D, Rohatagi S, Mendell J, et al. Randomised, parallel-group, multicentre, multinational phase 2 study comparing edoxaban, an oral factor Xa inhibitor, with warfarin for stroke prevention in patients with atrial fibrillation. Thromb Haemost. 2010;104(3):633–41.
15 Bauersachs R, Berkowitz SD, Brenner B, Buller HR, Decousus H, Gallus AS, et al. Oral rivaroxaban for symptomatic venous thromboembolism. N Engl J Med. 2010;363(26):2499–510.
16 Wizemann V, Tong L, Satayathum S, Disney A, Akiba T, Fissell RB, et al. Atrial fibrillation in hemodialysis patients: clinical features and associations with anticoagulant therapy. Kidney Int. 2010;77(12):1098–106.
17 Winkelmayer WC, Patrick AR, Liu J, Brookhart MA, Setoguchi S. The increasing prevalence of atrial fibrillation among hemodialysis patients. J Am Soc Nephrol. 2011;22(2):349–57.
18 Vazquez E, Sanchez-Perales C, Garcia-Garcia F, Castellano P, Garcia-Cortes MJ, Liebana A, et al. Atrial fibrillation in incident dialysis patients. Kidney Int. 2009;76(3):324–30.
19 Vazquez E, Sanchez-Perales C, Lozano C, Garcia-Cortes MJ, Borrego F, Guzman M, et al. Comparison of prognostic value of atrial fibrillation versus sinus rhythm in patients on long-term hemodialysis. Am J Cardiol. 2003;92(7):868–71.
20 Vazquez E, Sanchez-Perales C, Garcia-Cortes MJ, Borrego F, Lozano C, Guzman M, et al. Ought dialysis patients with atrial fibrillation be treated with oral anticoagulants? Int J Cardiol. 2003;87(2-3):135–9; discussion 39–41.
21 To AC, Yehia M, Collins JF. Atrial fibrillation in haemodialysis patients: do the guidelines for anticoagulation apply? Nephrology. (Carlton) 2007;12(5):441–7.
22 Genovesi S, Pogliani D, Faini A, Valsecchi MG, Riva A, Stefani F, et al. Prevalence of atrial fibrillation and associated factors in a population of long-term hemodialysis patients. Am J Kidney Dis. 2005;46(5):897–902.
23 Go AS, Hylek EM, Phillips KA, Chang Y, Henault LE, Selby JV, et al. Prevalence of diagnosed atrial fibrillation in adults: national implications for rhythm management and stroke prevention: the AnTicoagulation and Risk Factors in Atrial Fibrillation (ATRIA) Study. JAMA. 2001;285(18):2370–5.
24 Coli L, Donati G, Cianciolo G, Raimondi C, Comai G, Panicali L, et al. Anticoagulation therapy for the prevention of hemodialysis tunneled cuffed catheters (TCC) thrombosis. J Vasc Access. 2006;7(3):118–22.
25 Zellweger M, Bouchard J, Raymond-Carrier S, Laforest-Renald A, Querin S, Madore F. Systemic anticoagulation and prevention of hemodialysis catheter malfunction. ASAIO J. 2005;51(4):360–5.
10 Obialo CI, Conner AC, Lebon LF. Maintaining patency of tunneled hemodialysis catheters – efficacy of aspirin compared to warfarin. Scand J Urol Nephrol. 2003;37(2):172–6.
27 LeSar CJ, Merrick HW, Smith MR. Thrombotic complications resulting from hypercoagulable states in chronic hemodialysis vascular access. J Am Coll Surg. 1999;189(1):73–9; discussion 79–81.
28 Limdi NA, Beasley TM, Baird MF, Goldstein JA, McGwin G, Arnett DK, et al. Kidney function influences warfarin responsiveness and hemorrhagic complications. J Am Soc Nephrol. 2009;20(4):912–21.
29 Gompou A, Griveas I, Kyritsis I, Agroyannis I, Tsakoniatis M, Agroyannis B. INR deviations in hemodialyzed patients under low dose oral anticoagulant therapy. Int J Artif Organs. 2009;32(10):752–5.
30 American Diabetes A. Diagnosis and classification of diabetes mellitus. Diabetes Care 2008;31(Suppl 1):S55–60.
31 Buller HR, Agnelli G, Hull RD, Hyers TM, Prins MH, Raskob GE. Antithrombotic therapy for venous thromboembolic disease: the Seventh ACCP Conference on Antithrombotic and Thrombolytic Therapy. Chest. 2004;126(3 Suppl):401S–28S.
32 Singer DE, Albers GW, Dalen JE, Go AS, Halperin JL, Manning WJ. Antithrombotic therapy in atrial fibrillation: the Seventh ACCP Conference on Antithrombotic and Thrombolytic Therapy. Chest. 2004;126(3 Suppl):429S–56S.
33 Salem DN, Stein PD, Al-Ahmad A, Bussey HI, Horstkotte D, Miller N, et al. Antithrombotic therapy in valvular heart disease – native and prosthetic: the Seventh ACCP Conference on Antithrombotic and Thrombolytic Therapy. Chest. 2004;126(3 Suppl):457S–82S.
34 Breidthardt T, Moser-Bucher CN, Praehauser C, Garzoni D, Bachler K, Steiger J, et al. Morbidity and mortality on chronic haemodialysis: A 10-year Swiss single centre analysis. Swiss Med Wkly. 2011;141:w13150.
35 Holmes MV, Hunt BJ, Shearer MJ. The role of dietary vitamin K in the management of oral vitamin K antagonists. Blood reviews. 2012;26(1):1–14.
36 Gage BF, Waterman AD, Shannon W, Boechler M, Rich MW, Radford MJ. Validation of clinical classification schemes for predicting stroke: results from the National Registry of Atrial Fibrillation. JAMA. 2001;285(22):2864–70.
37 Schmitt L, Speckman J, Ansell J. Quality assessment of anticoagulation dose management: comparative evaluation of measures of time-in-therapeutic range. J Thromb Thrombolysis. 2003;15(3):213–6.
38 Rombouts EK, Rosendaal FR, van der Meer FJ. Subtherapeutic oral anticoagulant therapy: frequency and risk factors. Thromb Haemost. 2009;101(3):552–6.
39 Jensen CF, Christensen TD, Maegaard M, Hasenkam JM. Quality of oral anticoagulant therapy in patients who perform self management: warfarin versus phenprocoumon. J Thromb Thrombolysis. 2009;28(3):276–81.
40 Leiria TL, Pellanda L, Miglioranza MH, Sant’anna RT, Becker LS, Magalhaes E, et al. Warfarin and phenprocoumon: experience of an outpatient anticoagulation clinic. Arq Bras Cardiol. 2010;94(1):41–5.
41 Wieloch M, Sjalander A, Frykman V, Rosenqvist M, Eriksson N, Svensson PJ. Anticoagulation control in Sweden: reports of time in therapeutic range, major bleeding, and thrombo-embolic complications from the national quality registry AuriculA. Eur Heart J. 2011;32(18):2282–9.
42 Connolly SJ, Pogue J, Eikelboom J, Flaker G, Commerford P, Franzosi MG, et al. Benefit of oral anticoagulant over antiplatelet therapy in atrial fibrillation depends on the quality of international normalized ratio control achieved by centers and countries as measured by time in therapeutic range. Circulation. 2008;118(20):2029–37.
43 Biggers JA, Remmers AR, Jr., Glassford DM, Sarles HE, Lindley JD, Fish JC. The risk of anticoagulation in hemodialysis patients. Nephron. 1977;18(2):109–13.
44 Wiesholzer M, Harm F, Tomasec G, Barbieri G, Putz D, Balcke P. Incidence of stroke among chronic hemodialysis patients with nonrheumatic atrial fibrillation. Am J Nephrol. 2001;21(1):35–9.
45 Chan KE, Lazarus JM, Thadhani R, Hakim RM. Warfarin use associates with increased risk for stroke in hemodialysis patients with atrial fibrillation. J Am Soc Nephrol. 2009;20(10):2223–33.
46 Mant J, Hobbs FD, Fletcher K, Roalfe A, Fitzmaurice D, Lip GY, et al. Warfarin versus aspirin for stroke prevention in an elderly community population with atrial fibrillation (the Birmingham Atrial Fibrillation Treatment of the Aged Study, BAFTA): a randomised controlled trial. Lancet. 2007;370(9586):493–503.
47 Rash A, Downes T, Portner R, Yeo WW, Morgan N, Channer KS. A randomised controlled trial of warfarin versus aspirin for stroke prevention in octogenarians with atrial fibrillation (WASPO). Age Ageing. 2007;36(2):151–6.
48 Luxembourg B, Schneider K, Sittinger K, Toennes SW, Seifried E, Lindhoff-Last E, et al. Impact of pharmacokinetic (CYP2C9) and pharmacodynamic (VKORC1, F7, GGCX, CALU, EPHX1) gene variants on the initiation and maintenance phases of phenprocoumon therapy. Thromb Haemost.2011;105(1):169–80.
49 Werner D, Werner U, Wuerfel A, Grosch A, Lestin HG, Eschenhagen T, et al. Pharmacogenetic characteristics of patients with complicated phenprocoumon dosing. Eur J Clin Pharmacol. 2009;65(8):783–8.
50 Beinema M, Brouwers JR, Schalekamp T, Wilffert B. Pharmacogenetic differences between warfarin, acenocoumarol and phenprocoumon. Thromb Haemost. 2008;100(6):1052–7.
51 Franco V, Polanczyk CA, Clausell N, Rohde LE. Role of dietary vitamin K intake in chronic oral anticoagulation: prospective evidence from observational and randomized protocols. Am J Med. 2004;116(10):651–6.
52 Ezekowitz MD, Connolly S, Parekh A, Reilly PA, Varrone J, Wang S, et al. Rationale and design of RE-LY: randomized evaluation of long-term anticoagulant therapy, warfarin, compared with dabigatran. Am Heart J. 2009;157(5):805–10, 10 e1–2.
Funding / potential competing interests: No financial support and no other potential conflict of interest relevant to this article were reported.
Correspondence: Michael Mayr, MD, Medical Outpatient Department, University Hospital Basel, Petersgraben 4, CH-4031 Basel, Switzerland, mmayr[at]uhbs.ch