Figure 1
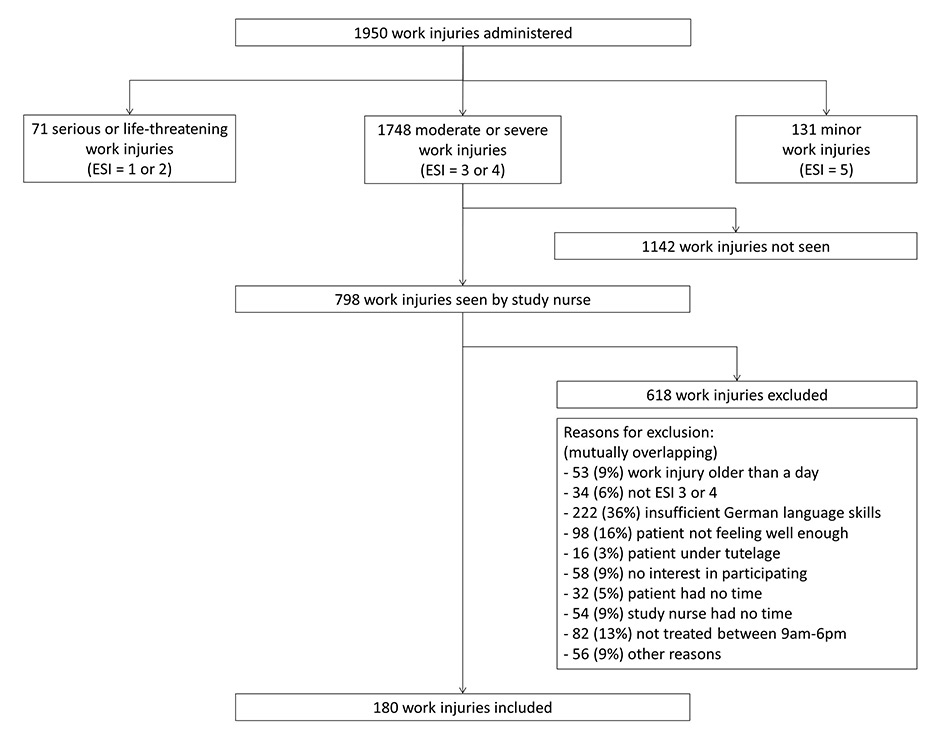
Flow chart of participants.
ESI = emergency severity index.
DOI: https://doi.org/10.4414/smw.2013.13902
Sleep problems present a risk for work injuries and are a major occupational health concern worldwide. Sleep problems were found to increase the risk of work injuries by 1.6–fold in a systematic review and meta-analysis that we conducted recently [1]. Moreover, there was a high prevalence of sleep problems among workers in Europe (18%) and in the United States (23%) in 2011 [2, 3].
Figure 1
Flow chart of participants.
ESI = emergency severity index.
Knowledge about the influence of sleep problems on work injury patterns is limited. There is evidence that sleep-related work injuries are associated with longer absences from work and more frequent hospital treatments [4]. In an investigation of various types of work injuries, sleep disorders in construction workers were associated with an increased risk of injury by moving objects [5]. However, no information is available concerning a general working population.
Different dimensions of sleep problems are involved in the physiological pathway and may be investigated separately. Poor sleep quality or short sleep duration limit the recovery function of sleep and can lead to sleepiness during the day. In turn, sleepiness may reduce the ability of people to process information about dangerous situations and may reduce their ability to respond adequately [6]. However, no research has thus far been undertaken that relates different dimensions of sleep problems to various types of work injuries. Therefore, the aim of this hospital-based study was to identify potential associations between different types of work injuries and sleep quality, sleep duration and daytime sleepiness.
In this study, 180 male and female work injury patients were recruited from the Emergency Department (ED) of the University Hospital of Basel, Switzerland, between December 1st 2009 and June 30th 2011 (fig. 2). Patients were eligible to participate in the study if they suffered from a moderate to severe work injury (emergency severity index [ESI] 3 or 4) (fig. 1) [7, 8], were admitted to hospital on the day or the day after injury occurred, were between 18 and 65 years old, were in an adequate general mental state, had sufficient language skills to complete the questionnaire, and agreed to participate. Data were collected through standardised, self-administered, questionnaires in German, administered in a preset procedure by a trained study nurse, who also took all standardised measurements. Work injuries were defined in accordance with Swiss law [9], which is consistent with the European methodology defined by Eurostat [10]. Work injury types were defined on the basis of groups of work injury variables that had been identified by factor analysis. Sleep problems were assessed using the total score of the Pittsburgh sleep quality index (PSQI) [11, 12], its subscales (see Supplement A), and the Epworth sleepiness scale (ESS) [13, 14]. Potential confounders considered included socioeconomic, health, lifestyle, occupational and environmental factors. Quantitative variables were di- or tri-chotomised as appropriate. Chi-squared tests or Fisher’s exact tests were used to describe the study population. To assess the relationship between injury type and sleep problems, multivariable logistic regressions were conducted, adjusted for age, sex, socioeconomic status and job risk. The stability of the regression models was tested trough sensitivity analysis. For a detailed description of the study methods, please see Supplement B.
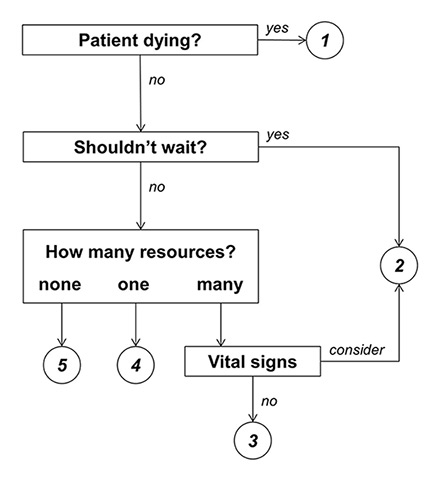
Figure 2
Emergency severity index conceptual algorithm, version 4.
Adapted from Gilboy, et al. 2005 [7]
The study protocol was approved by the local ethics committee (reference number 37/09).
| Table 1: Distribution of different work injury types according to various individual characteristics (n = 180). | |||||||||
| Number of subjects | Caught, hit | Handling, carrying | Side task | Tool, machine | Object | Cut, open wound | Musculo-skeletal injury, fall | Extremity | |
| n | % | % | % | % | % | % | % | % | |
| Total | 180 | 24.4 | 15.6 | 28.9 | 47.2 | 48.3 | 50.0 | 34.4 | 82.8 |
| Socioeconomic factors | |||||||||
| Gender | |||||||||
| Female | 36 | 22.2 | 22.2 | 30.6 | 41.7 | 41.7 | 47.2 | 38.9 | 91.7 |
| Male | 144 | 25.0 | 13.9 | 28.5 | 48.6 | 50.0 | 50.7 | 33.3 | 80.6 |
| Age | |||||||||
| 18–30 years | 74 | 17.6 | 10.8 | 25.7 | 56.8 * | 40.5 | 55.4 | 33.8 | 86.5 |
| 31–65 years | 106 | 29.2 | 18.9 | 31.1 | 40.6 | 53.8 | 46.2 | 34.9 | 80.2 |
| Socioeconomic status | |||||||||
| Low | 87 | 25.0 | 15.2 | 20.7 * | 60.9 ‡ | 50.0 | 57.6 * | 33.7 | 83.7 |
| Middle/high | 92 | 24.1 | 16.1 | 37.9 | 32.2 | 47.1 | 41.4 | 35.6 | 81.6 |
| Job risk | |||||||||
| Low | 68 | 27.9 | 19.1 | 38.2 * | 30.9 † | 48.5 | 38.2 * | 39.7 | 86.8 * |
| High | 112 | 22.3 | 13.4 | 23.2 | 57.1 | 48.2 | 57.1 | 31.3 | 80.4 |
| Sleep subscales and total scores | |||||||||
| Sleep efficiencya | |||||||||
| Normal (≥85%) | 149 | 24.8 | 18.1 * | 25.5 * | 49.0 | 49.7 | 49.7 | 33.6 | 83.2 |
| Low (<85%) | 31 | 22.6 | 3.2 | 45.2 | 38.7 | 41.9 | 51.6 | 38.7 | 80.6 |
| Sleep duration | |||||||||
| Short (<6h) | 17 | 23.5 | 5.9 | 58.8 † | 35.3 | 35.3 | 29.4 | 64.7 ‡ | 76.5 |
| Normal (6–7h) | 131 | 25.2 | 18.3 | 22.9 | 51.1 | 48.9 | 55.0 | 26.0 | 84.0 |
| Long (≥8h) | 31 | 19.4 | 9.7 | 35.5 | 38.7 | 51.6 | 38.7 | 54.8 | 83.9 |
| Problems staying awakeb | |||||||||
| Normal (<1 times/week) | 163 | 25.2 | 15.3 | 30.1 | 44.2 * | 49.1 | 49.1 | 35.0 | 82.8 |
| High (≥1 times/week) | 17 | 17.6 | 17.6 | 17.6 | 76.5 | 41.2 | 58.8 | 29.4 | 82.4 |
| PSQI | |||||||||
| Normal (≤5 points) | 131 | 24.4 | 18.3 | 27.5 | 47.3 | 48.9 | 48.9 | 33.6 | 84.0 |
| High (>5 points) | 35 | 22.9 | 8.6 | 31.4 | 45.7 | 42.9 | 51.4 | 40.0 | 85.7 |
| ESS | |||||||||
| Normal (≤10 points) | 151 | 25.2 | 15.9 | 28.5 | 46.4 | 49.0 | 49.0 | 34.4 | 81.5 |
| High (>10 points) | 28 | 21.4 | 14.3 | 28.6 | 50.0 | 46.4 | 53.6 | 35.7 | 89.3 |
| Work injury types were defined on the basis of groups of variables that had been identified by factor analysis. They are not mutually exclusive. Differences in different categories were assessed using the Chi-squared test or Fisher’s exact test, as appropriate. ESS = Epworth sleepiness scale; PSQI = Pittsburgh sleep quality index. Job risk = risk for a work injury compared with the average Swiss relative work injury risk in the 3 years available prior to study start (2005–2007) influenced by sex, age and job category. a a measure of sleep quality; b a measure of daytime sleepiness; *p <0.05, †p <0.01, ‡p <0.001: statistically significant association. | |||||||||
A total of 180 emergency patients with work injuries were recruited (fig. 1). Of the 1,950 work-injury patients attending the ED of the University Hospital of Basel during the 19–month study period, 798 (41%) were seen by our study nurses. Of those seen, 618 (77%) were excluded because at least one of the inclusion criteria were not met (n = 423, 68%), the patient was not interested in participating (n = 58,9%), or for administrative reasons (n = 168, 27%). The most frequent exclusion criterion was insufficient German language skills (n = 222, 35%). The patients included were compared with a subsample of excluded patients (n = 498, 81%) and the two groups were found to be similar regarding age, gender and perception of daytime sleepiness on the day of accident, but the excluded patients had lower perceptions of general health, general work satisfaction, general subjective sleep quality, sleep quality the night before the accident, concentration on the day of accident, and actual pain (data not shown). When the study population was compared with only the patients excluded owing to language barriers, the same picture emerged, except that excluded foreigners were more often male than the included cases (data not shown).
The majority of the population was male (n = 144, 80%), older than 30 years (n = 106, 59%), and high job risk workers (n = 112, 62%) (table 1). Age ranged from 18 to 63 years with a mean age of 35.5 years (standard deviation [SD] 11.5). Most work injuries happened during a work-related task rather than a side task (n = 128, 71%). In almost all work injuries, a tool, machine, or object was involved (n = 172, 96%). Extremities were injured most frequently (n = 149, 83%). No injury involved occupational driving. Most participants exhibited normal sleep characteristics and the most frequently observed sleep problem was poor sleep quality as measured with the PSQI (n = 35, 21%). For study characteristics stratified by gender, please see Supplement C.
Certain work injury types were more susceptible to particular risk factors than other types (table 1). Injuries while handling or carrying loads and work injuries during side tasks were significantly more often observed in workers with low sleep efficiency, as compared with workers with high sleep efficiency. Musculoskeletal injuries or falls and work injuries during side tasks were significantly more frequent in short and long sleepers than in normal sleepers. Being injured by, or while working with, a tool or machine was significantly more likely to happen to workers with problems staying awake than to their counterparts. The other work injury types were not significantly associated with the sleep variables investigated.
Sleep problems were associated with certain work injury types, even after control for age, gender, socioeconomic status, and job risk (table 2). Workers with low sleep efficiency had a greater risk for injuries during side tasks than workers with high sleep efficiency (OR = 2.43, 95% CI = 1.05–5.62). Workers with less than 6 hours of sleep per night had a more than 5–fold increased risk for both side task and falls or musculoskeletal injuries (OR = 5.17, 95% CI = 1.70–15.70; OR = 5.41, 95% CI = 1.81–16.22, respectively). The relationship with sleep duration was U-shaped and indicated an elevated risk also for those injuries in workers sleeping 8 hours and more per night (OR = 2.32, 95% CI = 0.98–5.50 for side task work injuries; OR = 3.45, 95% CI = 1.52–7.79 for musculoskeletal injuries or falls). Workers with problems staying awake at least once a week had a 3.7–fold increased risk of being injured by, or while working with, a tool or machine (OR = 3.73, 95% CI = 1.10–12.69). No significant associations between PSQI or ESS and the various work injury types were found. Sensitivity analysis confirmed the stability of the estimates. The results presented are a selection of analyses. The complete results are given in Supplement A.
| Table 2: Relationship between sleep problems and types of work injury: adjusted ORs and 95% CI calculated with multivariable logistic regression. | ||||||||||||||||
| Caught, hit | Handling, carrying | Side task | Tool, machine | Object | Cut, open wound | Musculoskeletal injury, fall | Extremities | |||||||||
| OR | 95% CI | OR | 95% CI | OR | 95% CI | OR | 95% CI | OR | 95% CI | OR | 95% CI | OR | 95% CI | OR | 95% CI | |
| Low sleep efficiency (<85%)a | 0.71 | (0.27‒1.91) | 0.15 | (0.02‒1.13) | 2.43 | (1.05‒5.62)* | 0.65 | (0.28‒1.50) | 0.65 | (0.29‒1.46) | 0.97 | (0.44‒2.17) | 1.32 | (0.59‒2.98) | 1.03 | (0.35‒2.98) |
| Short sleep duration (<6 h)b | 0.70 | (0.20‒2.40) | 0.23 | (0.03‒1.87) | 5.17 | (1.70‒15.70)† | 0.57 | (0.18‒1.78) | 0.45 | (0.15‒1.33) | 0.37 | (0.12‒1.14) | 5.41 | (1.81‒16.22)† | 0.65 | (0.19‒2.27) |
| Long sleep duration (≥8 h)b | 0.74 | (0.29‒1.92) | 0.43 | (0.12‒1.55) | 2.32 | (0.98‒5.50) | 0.49 | (0.21‒1.16) | 1.06 | (0.48‒2.35) | 0.52 | (0.23‒1.17) | 3.45 | (1.52‒7.79)† | 0.88 | (0.32‒2.46) |
| Problems staying awake (≥1x/w)c | 0.70 | (0.19‒2.63) | 1.19 | (0.30‒4.70) | 0.58 | (0.16‒2.20) | 3.73 | (1.10‒12.69)* | 0.75 | (0.27‒2.13) | 1.23 | (0.43‒3.50) | 0.84 | (0.28‒2.56) | 0.98 | (0.26‒3.76) |
| PSQI (>5)d | 0.84 | (0.33‒2.11) | 0.30 | (0.08‒1.13) | 1.16 | (0.50‒2.70) | 1.06 | (0.47‒2.37) | 0.73 | (0.33‒1.59) | 1.18 | (0.54‒2.58) | 1.24 | (0.56‒2.73) | 1.07 | (0.36‒3.16) |
| ESS (>10)e | 0.89 | (0.33‒2.41) | 0.96 | (0.30‒3.08) | 1.08 | (0.43‒2.71) | 1.03 | (0.44‒2.43) | 0.95 | (0.42‒2.16) | 1.11 | (0.49‒2.56) | 1.10 | (0.47‒2.57) | 1.93 | (0.54‒6.97) |
| Work injury types were defined on the basis of groups of variables that had been identified by factor analysis. They are not mutually exclusive. Adjusted for age, sex, socioeconomic status, and job risk. CI = confidence interval; ESS = Epworth sleepiness scale; OR = odds ratio; PSQI = Pittsburgh sleep quality index; x/w = times per week Reference groups were (a) normal sleep efficiency (≥85%) as a measure of sleep quality, (b) normal sleep duration (6–7 h), (c) rare problems staying awake (<1x/w) as a measure of daytime sleepiness, (d) normal PSQI (≤5), and (e) normal ESS (≤10) *p <0.05, †p <0.01, ‡p <0.001: Statistically significant association. | ||||||||||||||||
The findings of this hospital-based study, investigating 180 work injuries, suggested that workers with sleep problems had a 2- to 5-fold higher risk of certain types of work injury. The work injury types that were more likely to occur in workers with sleep problems included those that occurred while performing a side task, while working with, or being injured by, a tool or machine, and falls or musculoskeletal injuries. Moreover, each dimension of the sleep problems ‒ sleep quality, sleep duration and daytime sleepiness ‒ significantly increased the risk for at least one work injury type. However, the summary scores of the PSQI and the ESS were not significantly related to injury types and therefore could not discriminate between them.
Poor sleep quality, measured as low sleep efficiency, was significantly associated with injury during side tasks. Side tasks were therefore more susceptible for performance reduction by poor sleep quality than work-related tasks. Performance may be maintained through high attention despite sleep deprivation [15]. Thus, poor sleep quality might affect performance during side tasks more than during work-related tasks, if attention was higher during work-related tasks.
Short sleep duration was also significantly related to injuries during side tasks. Mechanisms similar to those that occur with low sleep efficiency could explain this relationship. Inattention may also account for the fact that short sleep duration was significantly more often present in patients with slips, trips and falls resulting in sprains, dislocations and fractures. Concerning the association between sleep duration and these work injuries, we observed a U-shaped pattern, with both short and long sleepers being at higher risk than normal sleepers. The observation that long sleepers were at higher risk than normal sleepers may be explained by underlying factors, such as overweight or smoking, that are more frequent in long sleepers [16, 17] and are related to problems in posture stabilisation, which could potentially lead to falls [5, 18–21]. In this study, being overweight and smoking tended to be more frequent in long sleepers but did not influence the relationship between sleep problems and work injuries as tested by sensitivity analysis.
Daytime sleepiness, measured as problems staying awake, was significantly related to injuries while working with, or being injured by, a tool or machine. This may indicate that if sleep is severely disturbed and sleep problems result in daytime sleepiness, complex tasks such as working with tools or machines may also be affected by performance reduction.
The ESS and the PSQI scores were not related to any of the work injury types and therefore were not sensitive enough to distinguish between different types of work injuries. Statistically, total scores are more reliable than single items if the relevant dimensions are captured [22]. However, to detect workers at risk for certain work injury types, specific characteristics of sleep problems may need to be asked about.
The strength of this study was the detailed information obtained on the work injuries, which was sufficient to categorise the injuries into different types and analyse them separately for their susceptibility to sleep problems. Sleep problems were assessed using standardised measures, facilitating comparisons across studies. Furthermore, detailed information was obtained regarding several potentially influencing factors, thereby allowing us to confirm the stability of the results by controlling for confounders and performing sensitivity analysis.
Methodological issues must be considered when interpreting the findings of this study. The study participants were recruited from the area of Basel City and may not be representative of Switzerland at large (see Supplement D). Concerning work injury types, this study observed more injuries during side tasks, more injured extremities, and fewer injuries from being caught or hit than reported in the Swiss national work injury statistics [23, 24]. This may be explained by the exclusion of serious to life-threatening work injuries, which may be more likely to happen during dangerous work processes than during side tasks, such as changing clothes or taking a break, which may more often affect the head or trunk than the extremities, and which may more often be a result of being hit, for example, by a heavy load. Additionally, the exclusion of minor injuries may amplify the under-representation of work injuries from being hit, if, for example, they result in bruises only limiting mobility and lead to work absence but not to medical treatment at a hospital. Serious or life-threatening injuries were excluded because those patients were not suitable for questioning. Minor injuries were excluded because the prevalence of minor injuries in the ED depends mainly on factors other than the need for treatment, such as the patient’s concerns or the availability of a general practitioner. Furthermore, sleep problems were slightly less frequent in the present study sample than in the general Swiss population, most likely owing to a more strict definition of sleep problems in this study [25]. However, for sociodemographic and occupational factors, the study sample was similar to the Swiss working population and the population of Swiss employees with work injury in gender, age, type of worker, socioeconomic status, job risk, shift work and occupational experience [26]. This may be surprising since injured workers were recruited only during weekdays and daytime.
A further limitation reflects the potential selection bias introduced by including only a small proportion of persons in relation to the population of interest. The most frequent reason for exclusion was the use of a German questionnaire. The main language of the study area was German, but many other languages are spoken in this area because of the large proportion of foreigners working in the Basel area (40% foreigners, of whom approximately 50% are from Germany) [27, 28]. Analysis of the exclusions showed that the nonparticipants were more likely to suffer from poor sleep quality than participants. However, we lack the information on their injury types needed to make a statement on how estimates might have been influenced. Additionally, the relatively small number of participants limited statistical power to detect significant associations. Thus, only strong relationships could be detected, and some weaker associations might have been missed.
This study investigated the impact of sleep problems on different types of work injuries – a topic addressed in only a few studies. An industry-based study on work injuries in French construction workers reported a 2.2–fold risk of being involved in an injury by moving objects for workers with sleep disorders compared with their colleagues without sleep disorders [5]. These results could not be replicated in our study, perhaps because of the different definition of sleep problems or study populations. Other hospital-based studies were not comparable because they either reported the relationship with other injury types, such as road traffic accidents [29], or did not investigate sleepiness as a risk factor for work injuries [30].
To better understand the consequences of sleep problems, it would be of interest to explore whether these findings could be replicated in larger studies and also whether they applied to minor or fatal work injuries. Little is known about the effect of sleep problems on work injury severity. Chau and coworkers observed that sleep problems increased the risk for work injuries, with longer sick leave and hospitalisation, in male construction workers [4]. However, to the authors’ knowledge, there is no evidence as to whether those associations might be true for every work injury type or for certain types only. Furthermore, it would be beneficial to learn more about the factors influencing the relationship between sleep problems and work injuries to better understand the mechanisms by which sleep problems affect work injuries. Our current knowledge about influencing factors is very limited, even for age [31], gender [32–35], and job parameters [32]. Additionally, intervention studies may improve the understanding of how sleep-related work injuries might be prevented. Melamed and Oksenberg [36] observed a decreased injury rate in workers with excessive daytime sleepiness 1 year after providing workers with their assessment results and with information on the implications of excessive daytime sleepiness for safety. However, further interventional studies are needed to learn more about the effectiveness and applicability of such programmes.
In practice, employers and work accident investigators may be recommended to examine work injuries more closely for factors related to sleepiness and sleep problems – mainly falls or musculoskeletal injuries, injuries incurred while working with, or being injured by, a tool or machine, and injuries incurred while carrying out a side task. Employees and occupational physicians should be aware that sleep problems could be a contributory cause for such injuries and represent an important hazard for safety.
Regarding the potential for prevention, the public health burden of sleep-related work injuries is high and thus the potential for prevention is large. Approximately 13% of work injuries could be prevented by eliminating sleep problems [1]. In Switzerland, this approximation translates into 35,000 work injuries and costs of approximately CHF 190 million per year [23]. To identify workers most at risk for certain injury types, specific questions should be asked, such as “Have you had problems staying awake in everyday life during the last four weeks?” rather than calculating commonly used scores. Workers with identified sleep problems could then specifically and individually be coached in taking steps to reduce sleep problems and/or in adopting safety behaviours to prevent injuries.
Sleep quality, sleep duration and daytime sleepiness were significant risk factors for at least one type of work injury. Work injuries that occurred while carrying out a side task, while working with, or being injured by, a tool or machine, and falls or musculoskeletal injuries were highly correlated with sleep problems. Employees and occupational physicians should be aware that sleep problems are a risk factor for certain types of work injuries, and employers may include sleep-related aspects in their health and safety management.
| Table Supplement A:Relationship between each subscale of Pittsburgh sleep quality index (PSQI) and each type of work injury: adjusted ORs and 95% CI calculated by multivariable logistic regression. | ||||||||||||||||
| PSQI subscales | Caught, hit | Handling, carrying | Side task | Object | Tool, machine | Cut, open wound | Musculoskeletal injury, fall | Extremities | ||||||||
| OR | 95% CI | OR | 95% CI | OR | 95% CI | OR | 95% CI | OR | 95% CI | OR | 95% CI | OR | 95% CI | OR | 95% CI | |
| Bad subjective sleep quality | 0.68 | (0.23‒1.99) | 0.39 | (0.08‒1.79) | 1.37 | (0.54‒3.51) | 1.13 | (0.46‒2.74) | 0.41 | (0.16‒1.03) | 0.84 | (0.35‒2.01) | 1.33 | (0.55‒3.21) | 0.60 | (0.21‒1.70) |
| Time to fall asleep (>30 min) | 0.98 | (0.29‒3.33) | 0.67 | (0.14‒3.30) | 0.69 | (0.20‒2.35) | 1.03 | (0.33‒3.16) | 1.46 | (0.50‒4.25) | 0.88 | (0.30‒2.61) | 1.36 | (0.47‒3.94) | 1.18 | (0.24‒5.71) |
| Not asleep within 30 min (≥1x/w) | 0.71 | (0.30‒1.69) | 0.90 | (0.34‒2.42) | 0.78 | (0.34‒1.78) | 1.18 | (0.55‒2.53) | 2.17 | (1.03‒4.55)* | 0.98 | (0.47‒2.03) | 1.28 | (0.61‒2.67) | 0.66 | (0.26‒1.68) |
| Poor sleep latencya | 0.88 | (0.34‒2.28) | 0.72 | (0.22‒2.32) | 0.84 | (0.34‒2.10) | 1.00 | (0.43‒2.35) | 2.22 | (0.96‒5.14) | 1.06 | (0.45‒2.41) | 1.01 | (0.44‒2.33) | 0.80 | (0.27‒2.35) |
| Short sleep duration (<6 h) | 0.70 | (0.20‒2.40) | 0.23 | (0.03‒1.87) | 5.17 | (1.70‒15.70)† | 0.57 | (0.18‒1.78) | 0.45 | (0.15‒1.33) | 0.37 | (0.12‒1.14) | 5.41 | (1.81‒16.22)† | 0.65 | (0.19‒2.27) |
| Long sleep duration (≥8 h) | 0.74 | (0.29‒1.92) | 0.43 | (0.12‒1.55) | 2.32 | (0.98‒5.50) | 0.49 | (0.21‒1.16) | 1.06 | (0.48‒2.35) | 0.52 | (0.23‒1.17) | 3.45 | (1.52‒7.79)† | 0.88 | (0.32‒2.46) |
| Low sleep efficiency (<85%) | 0.71 | (0.27‒1.91) | 0.15 | (0.02‒1.13) | 2.43 | (1.05‒5.62)* | 0.65 | (0.28‒1.50) | 0.65 | (0.29‒1.46) | 0.97 | (0.44‒2.17) | 1.32 | (0.59‒2.98) | 1.03 | (0.35‒2.98) |
| Disturbed sleep (≥1x/w) | 1.74 | (0.46‒6.57) | 0.27 | (0.03‒2.41) | 1.86 | (0.52‒6.66) | 2.53 | (0.67‒9.60) | 0.29 | (0.07‒1.15) | 1.76 | (0.49‒6.27) | 0.87 | (0.25‒3.19) | 0.52 | (0.12‒2.29) |
| Sleep medication (≥1x/w) | 1.74 | (0.26‒11.62) | 2.35 | (0.34‒16.25) | 0.61 | (0.06‒6.10) | 0.28 | (0.03‒2.83) | – | 1.73 | (0.26‒11.54) | 1.16 | (0.18‒7.62) | – | ||
| Problems staying awake (≥1x/w) | 0.70 | (0.19‒2.63) | 1.19 | (0.30‒4.70) | 0.58 | (0.16‒2.20) | 3.73 | (1.10‒12.69)* | 0.75 | (0.27‒2.13) | 1.23 | (0.43‒3.50) | 0.84 | (0.28‒2.56) | 0.98 | (0.26‒3.76) |
| Not enough swing | 0.87 | (0.36‒2.13) | 0.81 | (0.28‒2.37) | 1.19 | (0.52‒2.71) | 1.05 | (0.48‒2.28) | 1.09 | (0.52‒2.30) | 1.51 | (0.71‒3.23) | 0.88 | (0.40‒1.93) | 0.75 | (0.29‒1.97) |
| Daytime sleepinessb | 1.18 | (0.45‒3.10) | 0.59 | (0.16‒2.19) | 1.26 | (0.49‒3.20) | 1.84 | (0.75‒4.52) | 0.71 | (0.30‒1.68) | 1.66 | (0.69‒3.96) | 0.63 | (0.25‒1.60) | 0.60 | (0.21‒1.70) |
| Work injury types were defined on the basis of groups of variables that had been identified by factor analysis. They are not mutually exclusive. PSQI subscales values ranged from 0–4 points and were dichotomised into good (0–1 point) and poor (2–3 points), except for sleep duration which was trichotomised (long: 0 points; normal: 1 point; short: 2–3 points). Adjusted for age, sex, socio-economic status, and job risk.CI = confidence interval; OR = odds ratio; PSQI subscales were defined from the 19 items according to the Pittsburgh sleep quality index protocol; a sleep latency was calculated as average of “time to fall asleep” and “not asleep within 30 min”; b daytime sleepiness was calculated as average of “troubles staying awake” and “not enough swing”; min: minutes; x/w: times per week; *p <0.05, †p <0.01, ‡p <0.001: statistically significant association; -: not available. | ||||||||||||||||
Study population
This study uses data collected in the Emergency Department (ED) of the University Hospital of Basel, Switzerland (fig. 1). The hospital’s catchment area has 0.5 million inhabitants. During the study period, 67,925 patients were seen in the ED, of whom approximately 1,950 were seen for work injuries. We enrolled male and female patients from December 1st 2009 to June 30th 2011 who met the following inclusion criteria: (1.) age between 18 and 65 years; (2.) admitted to hospital owing to a work injury on the day or the day after the injury occurred; (3.) moderate to severe injury severity (emergency severity index [ESI] = 3 to 4) (fig. 2) [7, 8]; (4.) sufficient German language skills to complete the questionnaire; (5.) adequate general mental condition to complete the questionnaire and (6.) agreement to participate. Potential cases were identified in the following three ways: (1.) communication from the personnel of the Administration Department where all patients are required to register; (2.) notification by the treating physicians or nurses; and (3.) trained study nurses examining the internal medical administration system (ISMed). The following data collection procedure was performed throughout: Trained study nurses, who were either part of the permanent medical research team at the hospital or master students at the university and who were specifically hired for this purpose, were on site during normal business hours from Monday to Friday, 9 a.m. to 6 p.m. Work injury patients were approached and informed about the study in the waiting room. After having signed the informed consent, the participants were given a questionnaire to complete while waiting. Measurements were taken, and questions about the accident were asked in a private compartment within the emergency room. The data were verified for completeness, and recording was finished when patients were transferred internally or left the hospital. Participants were recruited consecutively until 180 work injury patients were included for analysis. The study protocol was approved by the local ethics committee (reference number 37/09).
Questionnaires and measurements
Work injuries were defined in accordance with Swiss law [9], which is consistent with the European methodology defined by Eurostat [10] and excludes repetitive strain injuries and commuting accidents. In accordance with Swiss national accident statistics, the following information on work injuries was collected: (1.) the task in process at the time of injury; (2.) the course of injury; (3.) objects involved in the accident; (4.) injured body parts; and (5.) injury diagnosis [23, 24]. The data on work injuries were collected by a trained study nurse, who completed a paper-based questionnaire. Injury severity was classified by hospital physicians using the ESI, a standard procedure in the management of the ED [7, 8].
Sleep problems were assessed using two standardised self-administered questionnaires. We used the German version of the Pittsburgh sleep quality index (PSQI) to retrospectively collect information on the subjective sleep quality during the previous 4 weeks [11, 12]. The PSQI consists of 19 self-reported items used to calculate the total sore and subscales, three of which are sleep duration, subjective sleep efficiency and problems staying awake. Values ranged from 0–3 points and were dichotomised into good (0–1 point) and poor (2–3 points), except for sleep duration which was trichotomised (long: 0 points; normal: 1 point; short: 2–3 points). Total scores range from 0 to 21, high values indicating reduced sleep quality. Bad sleep quality was defined as a PSQI total score higher than five, according to the protocol. We also used the German version of the Epworth sleepiness scale (ESS), which retrospectively measures subjective sleep propensity in daily situations over the previous weeks using eight items [13, 14]. Total scores ranged from 0 to 24, high values indicating increased sleep propensity. Excessive daytime sleepiness was defined as an ESS total score higher than ten, according to the protocol.
Information on potential confounders was collected using specific measuring instruments or validated self-administered questionnaires in German. Questions on demographic factors included sex, age, highest education (compulsory primary school, apprenticeship as a skilled worker, secondary school, general qualification for university entrance, higher professional education and university), occupational status (in training, without relevant professional experience, unskilled or semi-skilled worker, worker with apprenticeship, employee without particular education, employee with particular education, middle grade employee, self-employed small-scale trader, farmer, executive employee, entrepreneur, and director) and primary job (manager, scientist, technician, office worker, service occupation, skilled personnel for farming and fishery, craftsman, machine operator or assembler, and helpers). Questions on health and lifestyle factors included chronic diseases (present or not present), alcohol consumption (never, once to several times a month, once a week, several times a week, once a day and several times a day), smoking status (currently smoking or nonsmoking), and caffeine sensitivity based on nightly symptoms as a result of caffeine consumption after 4 p.m. (present or not present). Questions regarding occupational and environmental factors included noise, lighting, temperature, available or functional tools, spatial conditions, job hazards, physical workload, monotonous posture (very bad, quite bad, so-so, quite good, very good, or not applicable), shift or night work (present or not present), years in present occupation, and date of injury occurrence. Additionally, height (m), weight (kg), and waist and hip circumference (m) were measured by a trained study nurse. Furthermore, the study nurse researched the relative work injury risk based on the patient’s age, sex and primary job from the Swiss national accident statistics 2007 [24]. The average Swiss relative work injury risk in the 3 years available prior to the start of the study (2005–2007) was 68 work accidents per 1,000 fulltime employees annually [24]. The patient’s job risk was classified as high if his relative work injury risk was greater than the 3-year Swiss average. Blue-collar workers were technicians, service occupations, skilled personnel for farming and fishery, craftsmen, machine operators or assemblers, and labourers. Working conditions were considered to be adverse if the average total rating of occupational and environmental factors was mediocre or poorer. Socioeconomic status was determined as the average of education and occupational status and classified as low if the average was below one third of the maximum score. Body mass index (BMI) was calculated by dividing the weight by height squared, and overweight was classified as a BMI of at least 25 kg/m2 [37]. Waist-hip ratio (WHR) was calculated by dividing the waist by the hip circumference, and abdominal obesity was classified as a WHR of at least 0.85 or 0.90 for women or men, respectively [38].
Questionnaires were scanned using Sphinx software (Plus2 Sphinx Lexica edition, version 5.1.0.3.), and data were completed and checked by a trained study nurse. Independent, trained staff double-checked data and, if necessary, corrected entries. Data cleaning was performed using Stata software (version 10.1) following general research guidelines [39].
Statistical analysis
Of the comprehensive information on work injuries (94 items), we defined eight mutually nonexclusive work injury types. First, we summarised selected items into 11 binary characteristics based on conceptual concordance and frequency distributions. Then, we conducted a factor analysis based on those 11 binary characteristics, identifying four factors. By also considering the signs of the variable loadings, eight work injury types were defined: (i.) Being caught, hit, crushed, or struck; (ii.) handling or carrying loads by hand or using a handling device; (iii.) carrying out a side task such as walking around, cleaning, tidying, changing clothes or taking a break; (iv.) involving a tool or machine i.e., for cutting, assembling, forming, lifting, or digging; (v.) involving an object i.e., obstacles, inventory, ladders, or building parts; (vi.) being cut or open wound; (vii.) musculoskeletal injury or slip, trip, or fall; (viii.) extremity i.e., hands, arms, legs, or feet.
To describe the characteristics of the study population, we used standard descriptive statistics. To assess differences between male and female participants and between subjects with and without a given injury characteristic, the Chi-squared test or the Fisher’s exact test was used, as appropriate. To assess the relationship between a given injury type and each sleep variable individually, multivariable logistic regressions were performed with adjustment for age, sex, socioeconomic status and job risk. The stability of these regression models was tested in a sensitivity analysis, adding further potential confounding variables (p <0.2 in the bivariate analysis) one by one to the corresponding model. The degree of correlation between all variables was assessed. To facilitate interpretation, quantitative variables were dichotomised. However, if the relationship between the logit of the respective injury characteristic and a quantitative predictor variable was nonlinear, three categories were introduced. All statistical analyses were performed using STATA software (version 10.1).
| Table Supplement C:Characteristics of participants who presented with work injury by gender (n = 180). | |||||||
| Characteristics | Male | Female | Total | p-value | |||
| n | % | n | % | n | % | ||
| Socioeconomic characteristics | |||||||
| Gender | 144 | 80.0 | 36 | 20.0 | 180 | 100.0 | – |
| Age | 0.226 | ||||||
| 18–30 years | 56 | 38.9 | 18 | 50.0 | 74 | 41.1 | |
| 31–65 years | 88 | 61.1 | 18 | 50.0 | 106 | 58.9 | |
| Socioeconomic status | 0.093 | ||||||
| Low | 65 | 45.5 | 22 | 61.1 | 87 | 48.6 | |
| Middle/high | 78 | 54.5 | 14 | 38.9 | 92 | 51.4 | |
| Type of worker | 0.018 | ||||||
| White collar | 17 | 12.0 | 10 | 27.8 | 27 | 15.2 | |
| Blue collar | 125 | 88.0 | 26 | 72.2 | 151 | 84.8 | |
| Injury characteristics | |||||||
| Caught, hit | 36 | 25.0 | 8 | 22.2 | 44 | 24.4 | 0.729 |
| Handling, carrying | 20 | 13.9 | 8 | 22.2 | 28 | 15.6 | 0.217 |
| Side task | 41 | 28.5 | 11 | 30.6 | 52 | 28.9 | 0.805 |
| Tool, machine | 70 | 48.6 | 15 | 41.7 | 85 | 47.2 | 0.455 |
| Object | 72 | 50.0 | 15 | 41.7 | 87 | 48.3 | 0.371 |
| Cut, open wound | 73 | 50.7 | 17 | 47.2 | 90 | 50.0 | 0.709 |
| Musculoskeletal injury, fall | 48 | 33.3 | 14 | 38.9 | 62 | 34.4 | 0.530 |
| Extremity | 116 | 80.6 | 33 | 91.7 | 149 | 82.8 | 0.114 |
| Sleep subscales and total scores | |||||||
| Sleep efficiencya | 0.617 | ||||||
| Normal (≥85%) | 121 | 84.0 | 29 | 80.6 | 150 | 83.3 | |
| Low (<85%) | 23 | 16.0 | 7 | 19.4 | 30 | 16.7 | |
| Sleep duration | 0.502 | ||||||
| Short (<6h) | 15 | 10.5 | 2 | 5.6 | 17 | 9.5 | |
| Normal (6–7h) | 102 | 71.3 | 29 | 80.6 | 131 | 73.2 | |
| Long (≥8h) | 26 | 18.2 | 5 | 13.9 | 31 | 17.3 | |
| Problems staying awakeb | 0.702 | ||||||
| Normal (<1 times/week) | 131 | 91.0 | 32 | 88.9 | 163 | 90.6 | |
| High (≥1 times/week) | 13 | 9.0 | 4 | 11.1 | 17 | 9.4 | |
| PSQI | 0.021 | ||||||
| Normal (≤5 points) | 110 | 82.7 | 22 | 64.7 | 132 | 79.0 | |
| High (>5 points) | 23 | 17.3 | 12 | 35.3 | 35 | 21.0 | |
| ESS | 0.746 | ||||||
| Normal (≤10 points) | 120 | 83.9 | 31 | 86.1 | 151 | 84.4 | |
| High (>10 points) | 23 | 16.1 | 5 | 13.9 | 28 | 15.6 | |
| Health and lifestyle factors | |||||||
| Overweight | 0.131 | ||||||
| Normal (BMI <25 kg/m2) | 59 | 41.5 | 20 | 55.6 | 79 | 44.4 | |
| Overweight (BMI ≥25 kg/m2) | 83 | 58.5 | 16 | 44.4 | 99 | 55.6 | |
| Abdominal obesity | 0.039 | ||||||
| Normal (WHR ≤0.85 or 0.90) | 62 | 44.6 | 23 | 63.9 | 85 | 48.6 | |
| High (WHR >0.85 or 0.90) | 77 | 55.4 | 13 | 36.1 | 90 | 51.4 | |
| Chronic diseases | |||||||
| No chronic disease | 80 | 57.1 | 20 | 57.1 | 100 | 57.1 | 1.000 |
| Chronic disease(s) (at least one) | 60 | 42.9 | 15 | 42.9 | 75 | 42.9 | |
| Alcohol consumption | 0.129 | ||||||
| Rarely (≤1 times/week) | 106 | 74.1 | 31 | 86.1 | 137 | 76.5 | |
| Sometimes (>1 times/week) | 37 | 25.9 | 5 | 13.9 | 42 | 23.5 | |
| Current smoker | 0.062 | ||||||
| Not smoking | 67 | 46.5 | 23 | 63.9 | 90 | 50.0 | |
| Smoking | 77 | 53.5 | 13 | 36.1 | 90 | 50.0 | |
| Caffeine sensitivity | 0.388 | ||||||
| Not sensitive | 94 | 79.0 | 20 | 71.4 | 114 | 77.6 | |
| Sensitive (at least one symptom) | 25 | 21.0 | 8 | 28.6 | 33 | 22.4 | |
| Occupational and environmental factors | |||||||
| Job risk | 0.000 | ||||||
| Low | 37 | 25.7 | 31 | 86.1 | 68 | 37.8 | |
| High | 107 | 74.3 | 5 | 13.9 | 112 | 62.2 | |
| Working conditions | 0.329 | ||||||
| Good | 65 | 58.0 | 21 | 67.7 | 86 | 60.1 | |
| Adverse | 47 | 42.0 | 10 | 32.3 | 57 | 39.9 | |
| Shift or night work | 0.002 | ||||||
| No shift or night work | 127 | 88.2 | 24 | 66.7 | 151 | 83.9 | |
| Shift or night work | 17 | 11.8 | 12 | 33.3 | 29 | 16.1 | |
| Work experience | 0.673 | ||||||
| High (>5 years in present occupation) | 83 | 57.6 | 20 | 55.6 | 83 | 57.6 | |
| Low (≤5 years in present occupation) | 61 | 42.4 | 16 | 44.4 | 61 | 42.4 | |
| Season of injury occurrence | 0.469 | ||||||
| Spring/Summer | 101 | 70.1 | 23 | 63.9 | 124 | 68.9 | |
| Autumn/Winter | 43 | 29.9 | 13 | 36.1 | 56 | 31.1 | |
| Differences between males and females were assessed using the Chi-squared or the Fisher’s exact test, as appropriate. Work injury types were defined on the basis of groups of variables that had been identified by factor analysis. They are not mutually exclusive. Job risk is the risk for a work injury compared to the average Swiss relative work injury risk in the three years available previous to study start (2005–2007) influenced by sex, age and job category; working conditions: conditions concerning work environment, work setting and physical work load. BMI: body mass index; PSQI: Pittsburgh sleep quality index; ESS: Epworth sleepiness scale; WHR: waist-hip ratio for women and men, respectively. a a measure of sleep quality; b a measure of daytime sleepiness. | |||||||
| Table Supplement D: Characteristics of participants compared with general populations. | ||||
| Study sample (%) | Work injuries in Switzerland (%) [23] | |||
| Caught, hit | 24 | 48 | ||
| Handling, carrying loads | 16 | 12 | ||
| Side task | 15 | 29 | ||
| Tool, machine | 47 | 55 | ||
| Object | 48 | 45 | ||
| Cut, open wound | 47 | 50 | ||
| Musculoskeletal injury, fall | 34 | 38 | ||
| Extremity | 83 | 29 | ||
| Study sample (%) | Swiss employees with work injuries (%) [26] | |||
| Gender (male) | 80 | 77 | ||
| Age (30 years or less) | 41 | 49 | ||
| Type of worker (blue collar) | 85 | 82 | ||
| Study sample (%) | Swiss working population (%) [26] | |||
| Low socioeconomic status | 51 | 57 | ||
| High job risk | 62 | 62 | ||
| Shift work | 16 | 16 | ||
| Less than 5 years in present job | 42 | 46 | ||
| Study sample (%) | General Swiss population (%) [25] | |||
| Male | Female | Male | Female | |
| Sleep problems | 9‒21 | 6‒35 | 29 | 41 |
| Daily alcohol consumption | 6 | 3 | 20 | 10 |
| Overweight (body mass index ≥25 kg/m2) | 59 | 44 | 38 | 21 |
| Currently smoking | 54 | 36 | 32 | 24 |
| [23]: Swiss accident statistics 2012 (a total of 242,099 work injuries); [25]: Swiss health statistics 2012 (representative sample of 18,760 people); [26]: Swiss labour statics 2011 (representative sample of 126,000 people). For reference details, please see reference list of main paper. | ||||
Acknowledgements:The authors would like to thank all collaborating staff of the University Hospital of Basel, Switzerland, for their kind permission to recruit patients within their organisation and for their support in locating cases, and the team of study nurses – Rahel Bürgi, Salome Eisenhut, Elisa Maienza and Flora Reber – for their assistance in collecting data. We also thank Noëmi Lellé and Alfred Ruppert for their help in cleaning the data, and Sarah Balsiger for proofreading the manuscript.
1 Uehli K, Mehta AJ, Miedinger D, Hug K, Schindler C, Holsboer-Trachsler E, et al. Sleep problems and work injuries: a systematic review and meta-analysis. Sleep Med Rev. Forthcoming 2013.
2 Dregan A, Armstrong D. Cross-country variation in sleep disturbance among working and older age groups: an analysis based on the European Social Survey. Int Psychogeriatr. 2011:1–8.
3 Kessler RC, Berglund PA, Coulouvrat C, Hajak G, Roth T, Shahly V, et al. Insomnia and the performance of US workers: results from the America Insomnia Survey. Sleep. 2011;34(9):1161–71.
4 Chau N, Mur JM, Benamghar L, Siegfried C, Dangelzer JL, Francais M, et al. Relationships between certain individual characteristics and occupational injuries for various jobs in the construction industry: a case-control study. Am J Ind Med. 2004;45:84–92.
5 Chau N, Gauchard GC, Siegfried C, Benamghar L, Dangelzer JL, Francais M, et al. Relationships of job, age, and life conditions with the causes and severity of occupational injuries in construction workers. Int Arch Occup Environ Health. 2004;77(1):60–6.
6 Swaen GMH, van Amelsvoort LGPM, Bültmann U, Kant IJ. Fatigue as a risk factor for being injured in an occupational accident: results from the Maastricht Cohort Study. Occup Envrion Med. 2003;60(Suppl I):i88–i92.
7 Gilboy N, Tanabe P, Travers DA, Rosenau AM, Eitel DR. Emergency Severity Index, version 4: implementation handbook. Rockville, MD: Agency for Healthcare Research and Quality. May 2005. AHRQ Publication No. 05–0046–2.
8 Grossmann FF, Delport K, Keller DI. Emergency Severity Index: Deutsche Übersetzung eines validen Triageinstruments. Notfall Rettungsmed. 2009;12:290–2. German.
9 Schweizerische Eidgenossenschaft. Bundesgesetz über die Unfallverhütung (UVG). Landesrecht. 1981; Art. 7. German.
10 Eurostat. European statistics on accidents at work (ESAW): Summary methodology. Eurostat methodologies & working papers. 2012.
11 Buysse DJ, Reynolds CF, 3rd, Monk TH, Berman SR, Kupfer DJ. The Pittsburgh sleep quality index: a new instrument for psychiatric practice and research. Psyciatry Res. 1989;28:193–213.
12 Riemann D, Backhaus J, editors. Behandlung von Schlafstörungen. Weinheim: Psychologie Verlags Union; 1996. German.
13 Bloch KE, Schoch OD, Zhang JN, Russi EW. German version of the Epworth sleepiness scale. Respiration. 1999;66:440–7.
14 Johns MW. A new method for measuring daytime sleepiness: the Epworth sleepiness scale. Sleep. 1991;14(6):540–5.
15 Tomasi D, Wang RL, Telang F, Boronikolas V, Jayne MC, Wang GJ, et al. Impairment of attentional networks after 1 night of sleep deprivation. Cerebral cortex. 2009;19(1):233–40.
16 Theorell-Haglöw J, Berglund L, Janson C, Lindberg E. Sleep duration and central obesity in woman – differences between short sleepers and long sleepers. Sleep Med. 2012;13(8).
17 Beccuti G, Pannain S. Sleep and obesity. Curr Opin Clin Nutr Metab Care. 2011;14:402–12.
18 Corbeil P, Simoneau M, Rancourt D, Tremblay A, Teasdale N. Increased risk for falling associated with obesity: mathematical modeling of postural control. IEEE Trans Neural Syst and Rehabil Eng. 2001;9(2):126–36.
19 Gauchard GC, Chau N, Touron C, Benamghar L, Dehaene D, Perrin PP, et al. Individual characteristics in occupational accidents due to imbalance: a case-control study of the employees of a railway company. Occup Environ Med. 2003;60:330–5.
20 Østbye T, Dement JM, Krause KM. Obesity in workers’ compensation. Results from the Duke Health and Safety Surveillance System. Arch Intern Med. 2007;167:766–73.
21 Pereira CB, Strupp M, Holzleitner T, Brandt T. Smoking and balace: correlation of nicotine-induced nystagmus and postural body sway. Neuroreport. 2001;8:1223–6.
22 Cronbach LJ. Coefficient alpha and the internal structure of tests. Psychomerika. 1951;16(3):297–334.
23 Sammelstelle für die Statistik der Unfallversicherung UVG (SSUV). Unfallstatistik UVG 2012. 2012. German.
24 Schweizerische Unfallversicherungsanstalt (SUVA). Unfallstatistik UVG 2003–2007. 2009. German.
25 Bundesamt für Statistik. Gesundheitsstatistik 2012. Statistik der Schweiz. 2012;14. German.
26 Bundesamt für Statistik. Schweizerische Arbeitskräfteerhebung (SAKE). 2011. German.
27 Statistisches Amt. Beschäftigte nach Geschlecht und Staatsangehörigkeit. Tabelle t03205 [Internet]. 2010 [cited 2013 Mar 26]. Available from: http://www.statistik-bs.ch/tabellen/t03/2/.
28 Statistisches Amt des Kantons Basel-Stadt. Arbeitsmarktmonitoring 2011. Jahresbericht. Basel-Stadt: Präsidialdepartement des Kantons Basel-Stadt. 2011.
29 Laube I, Seeger R, Russi EW, Bloch KE. Accidents related to sleepiness: review of medical causes and prevention with special reference to Switzerland. Schweiz Med Wochenschr. 1998;128:1487–99.
30 Frickmann F, Wurm B, Jeger V, Lehmann B, Zimmermann H, Exadaktylos AK. 782 consecutive construction work accidents: who is at risk? Swiss Med Wkly. 2012;142:w13674.
31 Kunar BM, Bhattacherjee A, Chau N. A machted case-control study of occupational injury in underground coalmine workers. J S Afr Inst Min Metall. 2010;110(1):1–9.
32 Kling RN, McLeod CB, Koehoorn M. Sleep problems and workplace injuries in Canada. Sleep. 2010;33(5):611–8.
33 Nakata A, Ikeda T, Takahashi M, Haratani T, Fukui S, Swanson NG, et al. Sleep-related risk of occupational injuries in Japanese small and medium-scale enterprises. Ind Health. 2005;43:89–97.
34 Salminen S, Oksanen T, Vahtera J, Sallinen M, Härmä M, Salo P, et al. Sleep disturbances as a predictor of occupational injuries among public sector workers. J Sleep Res. 2010;19:207–13.
35 Ulfberg J, Carter N, Edling C. Sleep-disordered breathing and occupational accidents. Scand J Work Environ Health. 2000;26(3):237–42.
36 Melamed S, Oksenberg A. Excessive daytime sleepiness and risk of occupational injuries in non-shift daytime workers. Sleep. 2002;25(3):315–21.
37 World Health Organisation (WHO). BMI classification. Global database on body mass index [Internet]. [cited 2012 Dec 6]. Available from: http://apps.who.int/bmi/index.jsp?introPage=intro_3.html.
38 World Health Organisation (WHO), editor. Waist circumference and waist-hip ratio: report of a WHO expert consultation. Geneva: WHO Library; 2008.
39 Institute for Health and Care Research (EMGO+). Quality handbook: guidelines for each research phase. 2010 [cited 2011 Nov 1]. Available from: http://www.emgo.nl/kc/index.html.
Funding / potential competing interest:We gratefully acknowledge financial support from the Swiss National Accident Insurance Institution (Suva). David Miedinger and Katrin Uehli are employed at the Suva.