Brain atrophy: an in-vivomeasure of disease activity in multiple sclerosis
DOI: https://doi.org/10.4414/smw.2013.13887
Ernst Wilhelm
Radü, K.
Bendfeldt, Nicole
Mueller-Lenke, Stefano
Magon, T.
Sprenger
Summary
Multiple sclerosis (MS) has traditionally been considered to be primarily an inflammatory demyelinating disorder. Nowadays it is recognised as both an inflammatory and a neurodegenerative condition. This recognition is reflected in the development of new disease-modifying therapies that may offer the potential to reduce axon damage, either by inhibiting neurodegeneration or by promoting endogenous repair mechanisms. Since there is only a limited correlation between the clinical features of MS and findings on conventional magnetic resonance imaging (MRI), for the evaluation of such therapies new outcome measures are warranted. Grey matter atrophy occurs in the earliest stages of MS, progresses faster than in healthy individuals, and shows significant correlations with MRI lesion load, cognitive function and measures of physical disability; indeed, brain atrophy is the best predictor of subsequent disability and can be readily measured using MRI. Furthermore, it is becoming clear that currently available therapies differ in their effects on brain atrophy, and this may have important implications for the management of MS. New MRI techniques and advances in software development offer an opportunity to extend brain atrophy measurements beyond research studies to the routine management of MS patients.
Abbreviations
BBSI brain boundary shift integral
BICCR brain to intracranial capacity ratio
BPF brain parenchymal fraction
CDMS clinically definite multiple sclerosis
CIS clinically isolated syndrome
DMT disease-modifying therapy
EDSS expanded disability status scale
FSS fatigue severity scale
IFN interferon
MRI magnetic resonance imaging
MS multiple sclerosis
MSFC multiple sclerosis functional composite
NAA N-acetylaspartate
PPMS primary progressive multiple sclerosis
RRMS relapsing-remitting multiple sclerosis
SABRE semiautomatic brain region extraction
SD standard deviation
SIENA structural image evaluation, using normalisation, of atrophy
SIENAX SIENA cross-sectional
SPMS secondary progressive multiple sclerosis
VBM voxel-based morphometry
Introduction
Although it has been known since the pioneering work of Charcot in the 19th Century that axon transection and degeneration are features of multiple sclerosis (MS) [1], the disease has traditionally been considered to be primarily an inflammatory demyelinating disorder [2, 3]. However, it is now recognised that MS is both an inflammatory and a neurodegenerative condition: acute inflammation is responsible for the relapses that occur in most patients during the early stages of the disease, while accumulating axon damage leads to progressive disability [4]. Thus, the clinical manifestations of MS reflect the balance between progressive neurodegeneration and reparative processes within the brain [3, 5].
Disease-modifying therapies (DMTs) in MS have previously focused on the inflammatory component of the disease [6], but emerging new treatments may offer the possibility of reducing axon damage, either by inhibiting neurodegeneration or by promoting endogenous repair mechanisms [3]. However, there is only a limited correlation between the clinical signs and symptoms of MS and the changes seen on conventional magnetic resonance imaging (MRI) – the so-called “clinical-radiological paradox” [7]. This paradox arises as a result of a number of factors, including a lack of specificity of conventional MRI measures, involvement of gray matter, which is less amenable to conventional MRI, and limitations of clinical rating scales such as the Expanded Disability Status Scale (EDSS) [7, 8]. Consequently, the evaluation of treatments acting on neurodegeneration or neuronal regeneration and remyelination will require new outcome measures that extend beyond the traditional MRI measures for the diagnosis and monitoring of MS.
Within the last decade, the measurement of brain atrophy in MS has emerged as an outcome measure that can provide additional information on the disease process to that provided by conventional MRI measures [3, 9–11], and can also be used to evaluate the impact of new therapies on neurodegeneration. An example of the latter application can be found in the recent FREEDOMS and TRANSFORM studies [12, 13], in which treatment with the sphingosine-1-phosphate receptor modulator fingolimod resulted in significantly smaller decreases in brain volume than placebo or intramuscular interferon- (IFN-) β1a in patients with relapsing-remitting multiple sclerosis (RRMS) (see fig. 1). Such findings suggest that brain atrophy is likely to become an important outcome both in research and in routine clinical practice.
This review will briefly illustrate the techniques that are used to define volumetric abnormalities in MS (see table 1) and discuss the results that have added to the current understanding of atrophy in MS. A detailed discussion of the strengths and limitations of the different techniques and a critical and deep look at the potential for atrophy to be used as a clinical trials endpoint is beyond the scope of this review. Instead, we would like to refer the interested reader to a recently published review-paper by Vrenken et al. [14].
|
Table 1: Most common current measures for whole brain and regional brain atrophy. |
| |
Characteristics
|
Strengths
|
Limitations
|
|
Whole brain volumes
|
|
|
|
| VV [19] |
Semi-quantitative, linear; ventricle enlargement |
Use in clinical practice
2D images |
Lacks reproducibility
Requires a trained neuroradiologist |
| BPF [21] |
Segmentation-based; ratio of BPF to TIV |
Takes variation in head sizes into account |
Not well adapted to longitudinal studies |
| SIENAX [22] |
Segmentation-based; cross-sectional |
Automated; applicable to 2D images |
Regional analyses limited |
| SIENA [22] |
Registration-based; longitudinal |
Automated; applicable to 2D images |
Regional analyses limited |
|
Regional volumes
|
|
|
|
| VBM [117, 118] |
Includes segmentation and registration steps
Cross-sectional and longitudinal |
Automated; allows the entire brain to be regionally explored |
Requires 3D images
Aspects of the algorithm may reduce sensitivity to longitudinal changes
GM analysis; not known how well it deals with WM changes in MS |
| CT [119] |
Includes segmentation and registration steps
Cross-sectional and longitudinal |
Automated; allows the entire cortex to be regionally explored |
Difficult to obtain homogeneous GM boundaries owing to MRI field nonuniformities |
| BPF = brain parenchymal fraction; BPV = brain parenchymal volume; CT = cortical thickness measurement; GM = grey matter; SIENA = structural image evaluation, using normalisation, of atrophy; SIENAX = SIENA – cross-sectional; TIV = total intracranial volume; VBM = voxel-based morphometry; VV = ventricular volumes; WM = white matter |
Measurement of brain atrophy
Both global and regional brain atrophy in MS are studied using a wide variety of different MRI measures [3, 15–18]. Quantitative two-dimensional measures, such as measurements of the ventricular width of either the third ventricle or the lateral ventricles, can be used relatively easily in clinical practice, although manual measurements lack reproducibility [15, 19]. Very recently, however, VIENA, a fully-automated method for measuring ventricular volume changes in large datasets has been proposed [20].
Advances in MRI techniques and image-processing software during the last decade have allowed reproducible and accurate measurements of brain atrophy on three-dimensional MR images.
Segmentation-based (cross-sectional) techniques provide measurements of whole brain volume, or grey or white matter volume, within specific brain regions. One of the most widely used whole-brain techniques estimates the brain parenchymal fraction (BPF), which is defined as the ratio of brain parenchymal tissue to the sum of brain and ventricular cerebrospinal fluid (CSF) volumes [21]. This approach has the advantage that both parenchymal and total brain volumes are obtained automatically, and that it takes the interindividual variability in head size into account.
Registration-based techniques, on the other hand, provide reliable longitudinal measurements of brain atrophy over time [15, 22]. In these techniques, serial scans from a patient are compared, and areas with reductions in cortical volume identified after skull-stripping and adjustment for variations in head position or imaging plane. These techniques are largely automated, and current software allows the extensive image processing required to be completed in a reasonable time, thereby facilitating detailed and reliable image analysis. Table 1 lists the most common measures currently used in clinical routine and MS research.
Brain atrophy in multiple sclerosis
It has long been recognised that brain atrophy is a feature of advanced or severe MS [23], but it is now clear that atrophy also occurs in the earliest stages of the disease. A number of studies have shown that brain atrophy is present in patients with a clinically isolated syndrome (CIS) suggestive of MS [24–27] and in patients with early (<5 years from diagnosis) definite MS [8, 28–31]. For example, in a study involving 58 patients recruited within 3 months of CIS, patients who subsequently developed MS showed significantly greater decreases in BPF and grey matter fraction than those who did not. Similarly, in patients developing MS, significant global and regional white matter damage has been reported within 1 year of the first CIS [29].
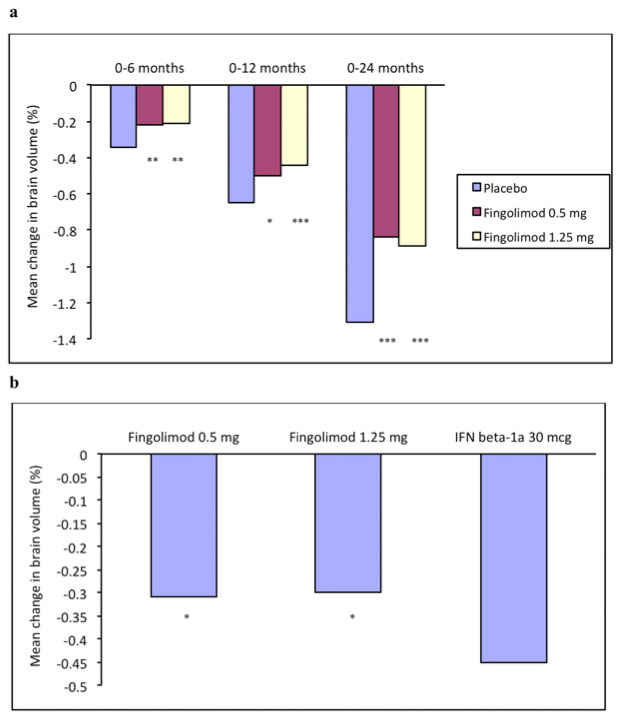
Figure 1
(a) Mean change in brain volume in patients with relapsing-remitting multiple sclerosis receiving oral treatment with fingolimod, 0.5 or 1.25 mg, or placebo once daily for 2 years in the FREEDOMS Study [11]. *,**,***p ≤0.05, 0.01, 0.001, respectively, versus placebo
(b) Mean change in brain volume over 1 year in relapsing-remitting multiple sclerosis patients receiving fingolimod, 0.5 or 1.25 mg daily or intramuscular IFNβ-1a 30 μg per week in the TRANSFORMS Study [12]. *p <0.001 versus IFNβ-1a
Brain atrophy is a feature of both relapsing and progressive (secondary progressive: SPMS; primary progressive: PPMS) forms of MS [8, 28, 30, 33–39]. The available evidence suggests that, once established, atrophy progresses inexorably throughout the course of the disease, at a rate that – after adjustment for baseline brain volume – is largely independent of MS subtype [34], although earlier it had been suggested that the gray matter atrophy rate increases with disease stage (CIS<RRMS<SPMS) [40]. The average atrophy rate in MS patients has been reported to be approximately 0.5%–1.3% per year, compared with 0.1%–0.4% per year in healthy individuals [3, 23, 41].
The rate of brain atrophy in an individual patient may be affected by a number of factors, including disease stage, MS phenotype, genetic factors, toxic agents and the presence of MS lesions. Patients with the apolipoprotein E-ε4 genotype showed an annual decrease in brain volume five times higher than in patients without this genotype [42], although other studies have reported that this genotype has no effect on brain atrophy [43]. Exposure to toxins such as cigarette smoke [44] has also been reported to be associated with increased brain atrophy rates. However, the presence of inflammation triggered by disturbances of the blood-brain barrier, as manifested by conventional MRI measures such as T2 lesions or Gd-enhanced T1 lesions is not consistently associated with increased atrophy [28, 45–47].
Although MS was traditionally considered to be primarily a white matter disorder, it has become apparent during the last decade that grey matter atrophy occurs from the earliest stages of the condition [32, 48, 49]. Indeed, there is some evidence that selective gray matter atrophy may be predictive of conversion from CIS to MS [29, 50, 51]. Although white matter atrophy rates appear to be relatively constant across all disease stages, in contrast, grey matter atrophy may accelerate as MS progresses [23, 49], and is more related to physical disability and cognitive impairment [52–59] than T2- and T1-lesion volumes. Significant grey matter fraction reduction but not white matter fraction reduction was shown in patients at presentation with CIS who developed definite MS over the subsequent 3 years [32]. However, although grey matter atrophy is a common finding in the early phases of both RRMS [49, 53, 60–62] and PPMS [53, 63], studies that investigated grey matter atrophy in patients at presentation with CIS are still contradictory [27, 32, 50, 62, 64].
Importantly, brain atrophy in MS is not due simply to an acceleration of normal age-related changes; for example, in a study in patients with early MS, decreases in white matter fraction were greater than those in grey matter fraction, whereas the opposite was true in healthy controls [48].
Brain atrophy in MS patients affects a number of grey matter and white matter regions, including the cerebral lobes, brainstem, cerebellum and white matter tracts [15]. However, the underlying mechanisms appear to differ to some extent, depending on the site of atrophy. For example, in white matter areas, inflammation has been suggested to be more pronounced than in grey matter areas [15, 65]. Hence, in overt white matter lesions, atrophy may be largely due to focal loss of myelin and axon density secondary to inflammation [15, 66, 67]. However, in a 3-year longitudinal study in patients with early MS, there were significant increases in white matter volume despite an increasing white matter lesion load [32]. Such findings suggest that white matter volume may actually increase at sites of active inflammation as a result of oedema, and this effect may mask progressing atrophy [15]. A recent pathological study [68] has investigated the characteristics of cortical lesions obtained from biopsies in patients within days or weeks after presentation. Demyelinating cortical lesions were present in 38% of patients, of whom 47% had definite MS. These lesions were inflammatory in nature, as demonstrated by high rates of T cell infiltration and macrophage involvement, and were strongly associated with meningeal inflammation.
Cortical atrophy
Several studies have shown that in MS patients there is both diffuse cortical atrophy and focal thinning of the cerebral cortex. In one study, for example, the mean (standard deviation) overall thickness of the cortical ribbon in MS patients was 2.30 (0.14) mm, compared with 2.48 (0.11) mm in healthy controls [56]. There was also significant thinning of the frontal cortex (mean 2.37 mm vs 2.73 mm) and the temporal cortex (2.65 mm vs 2.95 mm), which was observed even in patients with early disease or mild disability. In addition, patients with long-standing disease or severe disability showed marked focal thinning of the motor cortex (mean 2.35 mm vs 2.74 mm) [56]. A further, larger study reported that the strongest correlations between total white matter lesion load and cortical atrophy were found in the anterior cingulate cortex, the insula and the transverse temporal gyrus [69]; this pattern is distinct from that seen in normal ageing, in which atrophy occurs mainly in the primary motor and premotor cortices, the prefrontal cortex and the calcarene cortex near the visual cortex [70]. Focal cortical atrophy, primarily involving the left fronto-temporal region and deep grey matter structures, has also been reported in a study using voxel-based morphometry (VBM) [71].
Thalamic atrophy
As described above, cortical atrophy may be present in early stages of MS, but recent studies suggest that grey matter atrophy develops even earlier in deep structures. Atrophy of the thalamus has been reported in patients with PPMS or early RRMS, whereas cortical and infratentorial atrophy developed later in the course of the disease in these studies [39, 72].
In an early study, the normalised thalamic volume in MS patients was decreased by an average of 17%, compared with healthy controls, and the mean width of the third ventricle was increased two-fold; there was a significant correlation between third ventricle width and thalamic atrophy (r= –0.59; p<0.05). Furthermore, examination of post mortem specimens showed a 22% decrease in neuronal density in the median dorsal thalamic nucleus, and a similar decrease in the mean volume of this structure; overall, it was estimated that neuronal loss in MS patients could be as high as 30%–35% [73]. Similar findings were reported in a subsequent study in patients with RRMS, which also showed significant correlations between decreases in thalamic concentrations of N-acetylaspartate (NAA: a measure of neuronal density) and thalamic volume loss in individual patients; furthermore, both NAA concentrations and normalised thalamic volumes showed significant inverse correlations with disease duration [74]. A further study, in patients with CIS, has suggested that a direct relationship exists between white matter lesions and thalamic atrophy [75]. This may be partly due to Wallerian degeneration following axonal injury at lesion sites [15, 76].
Patterns of brain atrophy in relapsing remitting versus secondary progressive disease course
Several studies have investigated patterns of brain atrophy in patients with different MS phenotypes. Tedeschi et al, in a study of almost 600 MS patients, showed that patients with SPMS had significantly more atrophy of both white matter and grey matter, and a greater lesion load, than those with RRMS [33]. Lesion load was related to both grey matter atrophy, and to a lesser extent to white matter atrophy.
In another study brain atrophy was found to develop in different structures in patients with RRMS, SPMS or PPMS [77]. In general, patients with RRMS tended to show ventricular enlargement, whereas cortical atrophy was predominant in those with progressive disease (table 2). Similar findings were obtained in a VBM study involving patients with CIS or different phenotypes of MS [78]. No grey matter loss was observed in patients with CIS, whereas RRMS patients showed significant atrophy in the right pre- and post-central gyri. SPMS patients showed significant grey matter loss in several regions of the frontal, parietal, temporal and occipital cortex, the cerebellum, the superior and inferior colliculus, and deep grey matter structures, compared with RRMS patients. SPMS patients also showed significant grey matter loss in the postcentral gyrus, the middle occipital gyrus, the thalamus, the cerebellum, and the superior and inferior colliculus, compared with PPMS patients.
|
Table 2: Brain regions with significant (p <0.001) atrophy in patients with multiples sclerosis of different phenotypes. |
|
RRMS
|
SPMS
|
PPMS
|
| Ventricular system
Pericerebellar spaces
Cerebellar tentorium
Putamen
Corpus callosum
Cingulate sulcus
Hippocampus
Parieto-occipital fissure
Lateral fissure
Frontal, parietal, temporal and occipital cortex |
Cingulate
Pulvinar
Caudate nucleus
Anterior orbital gyrus
Mammillary body
Fourth ventricle
Frontal, parietal, temporal and occipital cortex |
Bilateral central sulcus
Caudate nucleus
Prepontine and quadrigeminal cisterns
Lateral ventricle
Frontal, parietal, temporal and occipital cortex |
| PPMS = primary progressive multiple sclerosis; RRMS = relapsing-remitting multiple sclerosis; SPMS = secondary progressive multiple sclerosis |
Correlations between brain atrophy and clinical and pathological features of multiple sclerosis
Correlation of white matter lesions and grey matter atrophy
A number of studies have examined the correlation between measures of brain atrophy and the extent and progression of the white matter (T1 and T2) MRI lesion burden in patients with MS. Although there is clear evidence for a correlation between global grey matter volume and white matter lesion load [28, 53, 54, 57], in contrast, cross-sectional attempts to correlate regional grey matter atrophy with white matter lesion measures have revealed conflicting results, ranging from no [79, 80] to moderate correlation [56, 81]. In a VBM study of a mixed patient population that included both patients with CIS and clinically definite MS, focal white matter damage was found to be associated with grey matter atrophy upstream of the white matter lesion; this suggests that retrograde degeneration following axon damage is an important factor in the development of grey matter atrophy [82]. Similar findings were reported in a VBM study in patients with early PPMS [83].
To date, there are few longitudinal studies relating regional grey matter volume changes to white matter lesions. A positive correlation between T2 lesion burden and thalamic volume reduction at baseline has been shown in patients with primary progressive MS (PPMS) using VBM [84]. Another publication reported a positive correlation between changes in T2 and T1 lesion volumes and ventricular enlargement in 20 patients with RRMS [85].
Battaglini et al. [86] studied a cohort of 59 RRMS patients, in whom longitudinal measurements of regional brain atrophy were made by VBM. During a mean follow-up of 3 years, patients showed progressive atrophy in the lateral frontal and parietal cortex, which appeared to be at least partly dependent on the increase in T2-weighted lesion load. Significant grey matter volume reductions, particularly in the frontotemporal cortex were found in RRMS patients compared with healthy controls; over a 12-month period, further decreases in grey matter volume occurred in patients with progressing white matter lesions, whereas no such decrease occurred in patients with nonprogressive white matter lesions [87, 88]. Together, these longitudinal findings suggest that progression of regional grey matter reductions is associated, at least partly, with global progression of white matter (T1 and T2) lesion volume. It remains unclear, however, whether the observed regional grey matter volume changes are the consequence of ongoing tissue destruction in white matter lesions, such as axonal transection and retrograde neurodegeneration [28, 89], or whether they occur independently.
Correlations with disability
Studies have consistently shown significant correlations between measurements of brain atrophy and clinical disability in MS patients [56, 90, 91]. Indeed, it has been suggested that measurement of brain atrophy (particularly grey matter atrophy) may be the best MRI predictor of future disability in patients with MS [15, 33].
An early study showed significant negative correlations between EDSS scores and global cortical thickness (r= –0.56, p= 0.011) and the mean thickness of the motor cortex (r= –0.69, p= 0.001) [56]. Similarly, in a case-control study involving 88 patients with MS or CIS, there were significant negative correlations between EDSS scores and the thickness of the right parahippocampal, left lateral occipital and left postcentral cortex (all p≤0.001), and between EDSS scores and the volumes of the right caudate and right nucleus accumbens (both p ≤0.01) [90]. A further study reported a significant correlation (r= –0.428, p<0.001) between brain atrophy, as measured by the corpus callosum index, and EDSS scores at diagnosis; however, brain atrophy was not an independent predictor of long-term disability in this study [92]. Similarly, in a long-term study of patients presenting with CIS, the brain atrophy rate was predictive of EDSS scores in univariate analyses, but was not an independent predictor at 6 years [93].
In contrast to these studies showing correlations between measures of brain atrophy and EDSS scores, a further study [91] found a significant correlation between progression of grey matter atrophy and MSFC scores, but not between atrophy and EDSS scores. This finding was associated with a relatively low concordance (62%) between disability progression defined by means of the two measures. The lack of correlation between brain atrophy and EDSS scores in this study was attributed to two factors: insensitivity of the EDSS in identifying progression in severely disabled patients, and misclassification of EDSS progression in patients with stable MSFC scores and low EDSS scores [91]. Similar results were obtained in a recent study in SPMS patients, in which whole brain, grey matter and spinal cord atrophy all showed significant correlations with MSFC scores, but not with EDSS scores [36].
Correlations with fatigue
Fatigue is common in MS, affecting up to 80% of patients [94]. Fatigue is not directly related to overall disease evolution, to disability levels or localised lesions, although an association with dysfunction of fronto-thalamo-basal-ganglia circuits seems likely [95]. Studies that have attempted to determine the added value of volumetric measurements in relation to fatigue are rare [94, 96]. In a study comparing pimary fatigued patients with MS (n = 17) with nonfatigued patients (n = 17), the fatigued patients showed extended regional atrophy of supratentorial brain parenchyma, involving the cerebral cortex, nearby white matter and the caudate head, areas which are functionally related to attentional control [96]. The authors suggested that impaired central motor activation might be due to an interruption of the cortico-subcortical motor circuits involving the motor cortex. In a study involving 222 RRMS patients with low disability (EDSS ≤2), patients with high levels of fatigue (scoring ≥5 on the Fatigue Severity Scale [FSS]) had significantly higher abnormal white matter fractions and T1 or T2 lesion loads, and lower white matter and grey matter fractions, than those with low fatigue scores (FSS ≤4) [94]. The authors concluded that white matter or grey matter atrophy was a risk factor for fatigue in MS patients, irrespective of the level of disability.
Correlations with cognitive impairment
Cognitive impairment, affecting memory, attention and information processing speed, may be present in up to 70% of MS patients [97, 98], and has been shown to occur early (within 3 years of onset) in the course of the disease [99]. In a study in patients with RRMS, patients with cognitive impairment had significantly smaller normalised brain volumes and normalised neocortical grey matter volumes than those with normal cognition [37]. Indeed, cortical atrophy appears to be a good predictor of cognitive impairment, because even mild impairment has been shown to be associated with significant cortical thinning [100]. Significant correlations have also been reported between cognitive impairment and thalamic atrophy [101].
A recent study has investigated patterns of regional grey matter atrophy associated with cognitive dysfunction in MS [102]. In patients with RRMS, cognitive impairment was associated with significant grey matter loss in the left superior temporal gyrus, the left insula, thalamus and right middle occipital gyrus. SPMS patients with cognitive impairment showed grey matter losses in a number of regions, including the anterior cingulate cortex, the insula, hippocampus and the right superior frontal sulcus. Similarly, cognitively impaired PPMS patients showed significant grey matter loss in the anterior cingulate cortex and the right superior temporal gyrus. These findings suggest that differing patterns of regional grey matter loss are associated with cognitive impairment in different MS phenotypes.
There is some evidence that the impact of brain atrophy on cognitive function in MS may be attenuated in patients with higher “cognitive reserve” as a result of higher premorbid intelligence or education. In one study in patients with clinically definite MS, brain atrophy (estimated from measurements of third ventricle width) was associated with worse cognitive function, whereas cognitive reserve was associated with better function; there was also a significant interaction between these two variables, such that patients with higher cognitive reserve showed less cognitive impairment in the presence of brain atrophy [103].
Effects of disease-modifying therapies on brain atrophy in MS
Currently available DMTs for MS differ in their effects on brain atrophy (table 3) [21, 104–116].
In general, prospective studies with conventional therapies such as interferon- (IFN) β and glatiramer acetate have shown only limited and inconclusive evidence for a beneficial effect on brain atrophy. By contrast, in the recent FREEDOMS study in patients with RRMS [104, 110], the sphingosine-1-phosphate receptor modulator fingolimod significantly reduced the mean change in brain volume over 2 years, compared with placebo, and in the TRANSFORMS study [105] fingolimod treatment resulted in a significantly lower rate of brain atrophy than intramuscular IFNβ-1a (fig. 1). Decreases in brain atrophy in RRMS patients have also been reported with the quinoline derivative laquinimod [107].
These differences between agents may be related to the extent of the anti-inflammatory effects of DMTs, and the effects of different agents on the balance between demyelinating and reparative processes [110]. During the first months of treatment, many DMTs produce an apparent increase in atrophy rate (pseudoatrophy), probably due to a loss of intracellular water as a result of their anti-inflammatory activity.
|
Table 3: Effects of disease-modifying therapies (DMTs) on brain volume in multiple sclerosis. |
|
Reference
|
DMT
|
Multiple sclerosis phenotype
|
Cohort size
(no. of patients)
|
Treatment effect on brain volume (p-value)
|
| [13] |
Fingolimod (1.25 or 5 mg oral, daily)1
|
RRMS |
1,292 |
<0.001 (mths 0–12) |
| [12] |
Fingolimod (1.25 or 5 mg oral, daily)2
|
RRMS |
1,272 |
<0.001 (mths 0–24) |
| [107] |
Laquinimod (0.6 mg oral daily)2
|
RRMS |
1,106 |
<0.001 (mths 0–24) |
| [21] |
IFNβ-1a (30 µg i.m., weekly)2
|
RRMS |
156 |
<0.001 (yr 1, yr2) |
| [108] |
IFNβ-1a (60 µg i.m., weekly)2
|
PPMS |
50 |
0.025 (2 years) |
| |
IFNβ-1a (s.c.) |
RRMS |
519 |
n.s. (4 years) |
| [109] |
IFNβ-1a (22 µg s.c., weekly)2
|
CIS |
264 |
0.0031(mths 0–24) |
| [110] |
IFNβ-1b (250 µg s.c., every other day)2
|
CIS |
221 |
0.121 (5 years) |
| [111] |
IFNβ-1b (8 MIU s.c., every other day)2
|
SPMS |
95 |
0.34 (mths 0–36) |
| [112]
[120] |
Natalizumab (300 mg i.v., every 4 weeks) 2
Natalizumab (investigational treatments) 1
|
RRMS
RRMS |
942
26 |
0.822 (mths 0–24)
0.004 (mths 12–24)
0.05 (1.5 ys) |
| [113] |
Glatiramer acetate (20 mg s.c., daily)2
|
RRMS |
227 |
0.88 (18 mths) |
| [114] |
Cladribine (0.7 or 2.1 mg/kg, s.c.)2
|
PPMS |
159 |
0.34 (12 mths) |
| [115] |
Alemtuzumab (20 mg i.v. daily, 5 consecutive days)3
|
CDMS |
25 |
n.s. (18 mths) |
| [116] |
Ibudilast (60mg oral, 3 times daily)2
|
RRMS |
297 |
0.04 (yr 1) |
|
1 vs IFNβ, 2 vs placebo, 3 crossover trial
CDMS = clinically definite multiple sclerosis; CIS = clinically isolated syndrome; IFN = interferon; mths = months; RRMS = relapsing-remitting multiple sclerosis; SPMS = secondary progressive multiple sclerosis; yr = year
p values show significant reduction of atrophy if not indicated otherwise (* placebo-controlled, **9 mths placebo-controlled, 9 mths open-label)
n.s. = no significant treatment effect on brain volume |
Conclusions
The continuing evolution of MS therapy from a focus on inflammation alone to addressing both the inflammatory and neurodegenerative aspects of the condition has produced the need for measuring neurodegenative outcomes in clinical trials and clinical practice. There is now strong evidence that measurements of brain atrophy meet the emerging need for new outcome measures in MS trials. Substantial data show that grey matter atrophy occurs early in the course of MS and progresses faster than in healthy individuals, and that brain atrophy is the best MRI predictor of subsequent disability. Furthermore, it is becoming clear that currently available DMTs differ in their effects on brain atrophy, and this may have important implications for the management of MS. In addition, studies of atrophy in different brain regions, and in patients with different MS phenotypes, are providing important new insights into the pathophysiology of the degenerative processes occurring in MS. In parallel to this growing interest in brain atrophy in MS, new MRI techniques and advances in software development are offering improved image quality with acceptable processing times, providing an opportunity to extend brain atrophy measurements beyond research studies to the routine management of MS patients.
In the light of such developments, it seems reasonable to assume that measurement of brain atrophy will play increasing roles in MS research, in the diagnosis and staging of the disease, and in the monitoring of new therapies that target neurodegeneration.
Acknowledgement:We thank Dr Michael Shaw (MScript Ltd, Hove, UK) for medical writing assistance in the preparation of this paper.
References
1 Murray TJ. The history of multiple sclerosis: the changing frame of the disease over the centuries. J Neurol Sci. 2009;277(Suppl 1):S3–8.
2 Trapp BD, Nave KA. Multiple sclerosis: an immune or neurodegenerative disorder? Annu Rev Neurosci. 2008;31:247–69.
3 Barkhof F, Calabresi PA, Miller DH, Reingold SC. Imaging outcomes for neuroprotection and repair in multiple sclerosis trials. Nat Rev Neurol. 2009;5(5):256–66.
4 Compston A, Coles A. Multiple sclerosis. Lancet. 2002;359(9313):1221–31.
5 Tourdias T, Dousset V. Neuroinflammatory Imaging Biomarkers: Relevance to Multiple Sclerosis and its Therapy. Neurotherapeutics: the journal of the American Society for Experimental NeuroTherapeutics. 2012.
6 Inglese M, Petracca M. Imaging multiple sclerosis and other neurodegenerative diseases. Prion. 2012;7(1).
7 Barkhof F. The clinico-radiological paradox in multiple sclerosis revisited. Curr Opin Neurol. 2002;15(3):239–45.
8 Horakova D, Dwyer MG, Havrdova E, Cox JL, Dolezal O, Bergsland N, et al. Gray matter atrophy and disability progression in patients with early relapsing-remitting multiple sclerosis: a 5-year longitudinal study. Journal of the neurological sciences. 2009;282(1-2):112–9.
9 Kolasinski J, Stagg CJ, Chance SA, Deluca GC, Esiri MM, Chang EH, et al. A combined post-mortem magnetic resonance imaging and quantitative histological study of multiple sclerosis pathology. Brain. 2012;135(Pt 10):2938–51.
10 Zivadinov R, Bakshi R. Central nervous system atrophy and clinical status in multiple sclerosis. J Neuroimaging. 2004;14(3 Suppl):27S–35S.
11 van den Elskamp I, Boden B, Dattola V, Knol D, Filippi M, Kappos L, et al. Cerebral atrophy as outcome measure in short-term phase 2 clinical trials in multiple sclerosis. Neuroradiology. 2010;52(10):875–81.
12 Kappos L, Radue EW, O'Connor P, Polman C, Hohlfeld R, Calabresi P, et al. A placebo-controlled trial of oral fingolimod in relapsing multiple sclerosis. N Engl J Med. 2010;362(5):387–401.
13 Cohen JA, Barkhof F, Comi G, Hartung HP, Khatri BO, Montalban X, et al. Oral fingolimod or intramuscular interferon for relapsing multiple sclerosis. N Engl J Med. 2010;362(5):402–15.
14 Vrenken H, Jenkinson M, Horsfield MA, Battaglini M, Schijndel RA, Rostrup E, et al. Recommendations to improve imaging and analysis of brain lesion load and atrophy in longitudinal studies of multiple sclerosis. J Neurol. 2012:1–14.
15 Bermel RA, Bakshi R. The measurement and clinical relevance of brain atrophy in multiple sclerosis. Lancet Neurol. 2006;5(2):158–70.
16 Dorr J, Wernecke KD, Bock M, Gaede G, Wuerfel JT, Pfueller CF, et al. Association of retinal and macular damage with brain atrophy in multiple sclerosis. PLoS One. 2011;6(4):e18132.
17 Rocca MA, Valsasina P, Damjanovic D, Horsfield MA, Mesaros S, Stosic-Opincal T, et al. Voxel-wise mapping of cervical cord damage in multiple sclerosis patients with different clinical phenotypes. J Neurol Neurosurg Psychiatry. 2013;84(1):35–41.
18 Derakhshan M, Caramanos Z, Giacomini PS, Narayanan S, Maranzano J, Francis SJ, et al. Evaluation of automated techniques for the quantification of grey matter atrophy in patients with multiple sclerosis. NeuroImage. 2010;52(4):1261–7.
19 Simon JH, Jacobs LD, Campion MK, Rudick RA, Cookfair DL, Herndon RM, et al. A longitudinal study of brain atrophy in relapsing multiple sclerosis. The Multiple Sclerosis Collaborative Research Group (MSCRG). Neurology. 1999;53(1):139–48.
20 Vrenken H, Vos EK, van der Flier WM, Sluimer IC, Cover KS, Knol DL, et al. Validation of the automated method VIENA: An accurate, precise, and robust measure of ventricular enlargement. Human Brain Mapping. 2013.
21 Rudick RA, Fisher E, Lee JC, Simon J, Jacobs L. Use of the brain parenchymal fraction to measure whole brain atrophy in relapsing-remitting MS. Neurology. 1999;53(8):1698–704.
22 Smith SM, Zhang Y, Jenkinson M, Chen J, Matthews PM, Federico A, et al. Accurate, Robust, and Automated Longitudinal and Cross-Sectional Brain Change Analysis. NeuroImage. 2002;17(1):479–89.
23 Simon JH. Brain atrophy in multiple sclerosis: what we know and would like to know. Multiple Sclerosis. 2006;12(6):679–87.
24 Ziehn MO, Avedisian AA, Dervin SM, Umeda EA, O’Dell TJ, Voskuhl RR. Therapeutic testosterone administration preserves excitatory synaptic transmission in the hippocampus during autoimmune demyelinating disease. J Neurosci. 2012;32(36):12312–24.
25 Zimmermann H, Freing A, Kaufhold F, Gaede G, Bohn E, Bock M, et al. Optic neuritis interferes with optical coherence tomography and magnetic resonance imaging correlations. Multiple Sclerosis. 2013;19(4):443–50.
26 Sun SW, Thiel T, Liang HF. Impact of repeated topical-loaded manganese-enhanced MRI on the mouse visual system. Invest Ophthalmol Vis Sci. 2012;53(8):4699–709.
27 Henry RG, Shieh M, Okuda DT, Evangelista A, Gorno-Tempini ML, Pelletier D. Regional grey matter atrophy in clinically isolated syndromes at presentation. Journal of Neurology, Neurosurgery & Psychiatry. 2008;79(11):1236–44.
28 Chard DT, Griffin CM, Parker GJ, Kapoor R, Thompson AJ, Miller DH. Brain atrophy in clinically early relapsing-remitting multiple sclerosis. Brain: a journal of neurology. 2002;125(Pt 2):327–37.
29 Raz E, Cercignani M, Sbardella E, Totaro P, Pozzilli C, Bozzali M, et al. Gray- and White-Matter Changes 1 Year after First Clinical Episode of Multiple Sclerosis: MR Imaging. Radiology. 2010;257(2):448–54.
30 Audoin B, Davies G, Rashid W, Fisniku L, Thompson AJ, Miller DH. Voxel-based analysis of grey matter magnetization transfer ratio maps in early relapsing remitting multiple sclerosis. Multiple sclerosis. 2007;13(4):483–9.
31 Chard D, Miller D. Grey matter pathology in clinically early multiple sclerosis: evidence from magnetic resonance imaging. J Neurol Sci. 2009;282(1-2):5–11.
32 Dalton CM, Chard DT, Davies GR, Miszkiel KA, Altmann DR, Fernando K, et al. Early development of multiple sclerosis is associated with progressive grey matter atrophy in patients presenting with clinically isolated syndromes. Brain. 2004;127(5):1101–7.
33 Tedeschi G, Lavorgna L, Russo P, Prinster A, Dinacci D, Savettieri G, et al. Brain atrophy and lesion load in a large population of patients with multiple sclerosis. Neurology. 2005;65(2):280–5.
34 De Stefano N, Giorgio A, Battaglini M, Rovaris M, Sormani MP, Barkhof F, et al. Assessing brain atrophy rates in a large population of untreated multiple sclerosis subtypes. Neurology. 2010;74(23):1868–76.
35 Ge Y, Grossman RI, Udupa JK, Wei L, Mannon LJ, Polansky M, et al. Brain atrophy in relapsing-remitting multiple sclerosis and secondary progressive multiple sclerosis: longitudinal quantitative analysis. Radiology. 2000;214(3):665–70.
36 Furby J, Hayton T, Altmann D, Brenner R, Chataway J, Smith K, et al. A longitudinal study of MRI-detected atrophy in secondary progressive multiple sclerosis. J Neurol. 2010;257(9):1508–16.
37 Calabrese M, Agosta F, Rinaldi F, Mattisi I, Grossi P, Favaretto A, et al. Cortical lesions and atrophy associated with cognitive impairment in relapsing-remitting multiple sclerosis. Arch Neurol. 2009;66(9):1144–50.
38 Ceccarelli A, Rocca M, Valsasina P, Rodegher M, Pagani E, Falini A, et al. A multiparametric evaluation of regional brain damage in patients with primary progressive multiple sclerosis. Human Brain Mapp. 2009;30(9):3009–19.
39 Sepulcre J, Sastre-Garriga J, Cercignani M, Ingle GT, Miller DH, Thompson AJ. Regional gray matter atrophy in early primary progressive multiple sclerosis: a voxel-based morphometry study. Archives of neurology. 2006;63(8):1175–80.
40 Fisher E, Lee JC, Nakamura K, Rudick RA. Gray matter atrophy in multiple sclerosis: a longitudinal study. Ann Neurol. 2008;64(3):255–65.
41 Fotenos AF, Mintun MA, Snyder AZ, Morris JC, Buckner RL. Brain volume decline in aging: evidence for a relation between socioeconomic status, preclinical Alzheimer disease, and reserve. Arch Neurol. 2008;65(1):113–20.
42 Vigeveno RM, Wiebenga OT, Wattjes MP, Geurts JJ, Barkhof F. Shifting imaging targets in multiple sclerosis: from inflammation to neurodegeneration. J Magn Reson Imaging. 2012;36(1):1–19.
43 Fernandez O, Alvarez-Cermeno JC, Arroyo-Gonzalez R, Brieva L, Calles-Hernandez MC, Casanova-Estruch B, et al. Review of the novelties presented at the 27th Congress of the European Committee for Treatment and Research in Multiple Sclerosis (ECTRIMS) (I). Revista de neurologia. 2012;54(11):677–91.
44 Zivadinov R, Weinstock-Guttman B, Hashmi K, Abdelrahman N, Stosic M, Dwyer M, et al. Smoking is associated with increased lesion volumes and brain atrophy in multiple sclerosis. Neurology. 2009;73(7):504–10.
45 Simon JH, Jacobs LD, Campion MK, Rudick RA, Cookfair DL, Herndon RM, et al. A longitudinal study of brain atrophy in relapsing multiple sclerosis. Neurology. 1999;53(1):139–48.
46 McNeill A. PLA2G6 mutations and other rare causes of neurodegeneration with brain iron accumulation. Curr Drug Targets. 2012;13(9):1204–6.
47 Simon JH. From enhancing lesions to brain atrophy in relapsing MS. J Neuroimmunol. 1999;98(1):7–15.
48 Chard DT, Griffin CM, Parker GJM, Kapoor R, Thompson AJ, Miller DH. Brain atrophy in clinically early relapsing-remitting multiple sclerosis. Brain. 2002;125(2):327–37.
49 Chard DT, Griffin CM, Rashid W, Davies GR, Altmann DR, Kapoor R, et al. Progressive grey matter atrophy in clinically early relapsing-remitting multiple sclerosis. Multiple Sclerosis. 2004;10(4):387–91.
50 Calabrese M, Rinaldi F, Mattisi I, Bernardi V, Favaretto A, Perini P, et al. The predictive value of gray matter atrophy in clinically isolated syndromes. Neurology. 2011;77(3):257–63.
51 Jenkins TM, Ciccarelli O, Atzori M, Wheeler-Kingshott CAM, Miller DH, Thompson AJ, et al. Early pericalcarine atrophy in acute optic neuritis is associated with conversion to multiple sclerosis. Journal of Neurology, Neurosurgery & Psychiatry. 2011;82(9):1017–21.
52 Amato MP, Bartolozzi ML, Zipoli V, Portaccio E, Mortilla M, Guidi L, et al. Neocortical volume decrease in relapsing-remitting MS patients with mild cognitive impairment. Neurology. 2004;63(1):89–93.
53 De Stefano N, Matthews PM, Filippi M, Agosta F, De Luca M, Bartolozzi ML, et al. Evidence of early cortical atrophy in MS: Relevance to white matter changes and disability. Neurology. 2003;60(7):1157–62.
54 Ge Y, Grossman RI, Udupa JK, Babb JS, Nyul LG, Kolson DL. Brain Atrophy in Relapsing-Remitting Multiple Sclerosis: Fractional Volumetric Analysis of Gray Matter and White Matter. Radiology. 2001;220(3):606–10.
55 Quarantelli M, Ciarmiello A, Morra VB, Orefice G, Larobina M, Lanzillo R, et al. Brain tissue volume changes in relapsing-remitting multiple sclerosis: correlation with lesion load. NeuroImage. 2003;18(2):360–6.
56 Sailer M, Fischl B, Salat D, Tempelmann C, Schonfeld MA, Busa E, et al. Focal thinning of the cerebral cortex in multiple sclerosis. Brain. 2003;126(8):1734–44.
57 Sanfilipo MP, Benedict RHB, Sharma J, Weinstock-Guttman B, Bakshi R. The relationship between whole brain volume and disability in multiple sclerosis: A comparison of normalized gray vs. white matter with misclassification correction. NeuroImage. 2005;26(4):1068–77.
58 Sanfilipo MP, Benedict RHB, Weinstock-Guttman B, Bakshi R. Gray and white matter brain atrophy and neuropsychological impairment in multiple sclerosis. Neurology. 2006;66(5):685–92.
59 Tiberio M, Chard DT, Altmann DR, Davies G, Griffin CM, Rashid W, et al. Gray and white matter volume changes in early RRMS: A 2-year longitudinal study. Neurology. 2005;64(6):1001–7.
60 Audoin B, Davies GR, Finisku L, Chard DT, Thompson AJ, Miller DH. Localization of grey matter atrophy in early RRMS. J Neurol. 2006;253(11):1495–501.
61 Horakova D, Dwyer MG, Havrdova E, Cox JL, Dolezal O, Bergsland N, et al. Gray matter atrophy and disability progression in patients with early relapsing-remitting multiple sclerosis: A 5-year longitudinal study. J Neurol Sci. 2009;282(1-2):112–9.
62 Calabrese M, Atzori M, Bernardi V, Morra A, Romualdi C, Rinaldi L, et al. Cortical atrophy is relevant in multiple sclerosis at clinical onset. J Neurol. 2007;254(9):1212–20.
63 Bodini B, Khaleeli Z, Cercignani M, H. Miller D, Thompson AJ, Ciccarelli O. Exploring the relationship between white matter and gray matter damage in early primary progressive multiple sclerosis: An in vivo study with TBSS and VBM. Human Brain Mapp. 2009;30(9):2852–61.
64 Ceccarelli A, Rocca MA, Pagani E, Colombo B, Martinelli V, Comi G, et al. A voxel-based morphometry study of grey matter loss in MS patients with different clinical phenotypes. NeuroImage. 2008;42(1):315–22.
65 Peterson JW, Bö L, Mörk S, Chang A, Trapp BD. Transected neurites, apoptotic neurons, and reduced inflammation in cortical multiple sclerosis lesions. Ann Neurol. 2001;50(3):389–400.
66 Brück W. Inflammatory demyelination is not central to the pathogenesis of multiple sclerosis. J Neurol. 2005;252(0):v10–v5.
67 Oreja-Guevara C, Noval S, Alvarez-Linera J, Gabaldon L, Manzano B, Chamorro B, et al. Clinically isolated syndromes suggestive of multiple sclerosis: an optical coherence tomography study. PLoS One. 2012;7(3):e33907.
68 Lucchinetti CF, Popescu BF, Bunyan RF, Moll NM, Roemer SF, Lassmann H, et al. Inflammatory cortical demyelination in early multiple sclerosis. N Engl J Med. 2011;365(23):2188–97.
69 Charil A, Dagher A, Lerch JP, Zijdenbos AP, Worsley KJ, Evans AC. Focal cortical atrophy in multiple sclerosis: relation to lesion load and disability. NeuroImage. 2007;34(2):509–17.
70 Salat DH, Buckner RL, Snyder AZ, Greve DN, Desikan RS, Busa E, et al. Thinning of the cerebral cortex in aging. Cerebral Cortex. 2004;14(7):721–30.
71 Prinster A, Quarantelli M, Orefice G, Lanzillo R, Brunetti A, Mollica C, et al. Grey matter loss in relapsing-remitting multiple sclerosis: a voxel-based morphometry study. NeuroImage. 2006;29(3):859–67.
72 Audoin B, Davies GR, Finisku L, Chard DT, Thompson AJ, Miller DH. Localization of grey matter atrophy in early RRMS : A longitudinal study. J Neurol. 2006;253(11):1495–501.
73 Cifelli A, Arridge M, Jezzard P, Esiri MM, Palace J, Matthews PM. Thalamic neurodegeneration in multiple sclerosis. Ann Neurol. 2002;52(5):650–3.
74 Wylezinska M, Cifelli A, Jezzard P, Palace J, Alecci M, Matthews PM. Thalamic neurodegeneration in relapsing-remitting multiple sclerosis. Neurology. 2003;60(12):1949–54.
75 Henry RG, Shieh M, Amirbekian B, Chung S, Okuda DT, Pelletier D. Connecting white matter injury and thalamic atrophy in clinically isolated syndromes. J Neurol Sci. 2009;282(1-2):61–6.
76 Simon JH, Kinkel RP, Jacobs L, Bub L, Simonian N. A Wallerian degeneration pattern in patients at risk for MS. Neurology. 2000;54(5):1155–60.
77 Pagani E, Rocca MA, Gallo A, Rovaris M, Martinelli V, Comi G, et al. Regional brain atrophy evolves differently in patients with multiple sclerosis according to clinical phenotype. AJNR Am J Neuroradiol. 2005;26(2):341–6.
78 Ceccarelli A, Rocca MA, Pagani E, Colombo B, Martinelli V, Comi G, et al. A voxel-based morphometry study of grey matter loss in MS patients with different clinical phenotypes. Neuroimage. 2008;42(1):315–22.
79 Morgen K, Sammer G, Courtney SM, Wolters T, Melchior H, Blecker CR, et al. Evidence for a direct association between cortical atrophy and cognitive impairment in relapsing-remitting MS. NeuroImage. 2006;30(3):891–8.
80 Prinster A, Quarantelli M, Orefice G, Lanzillo R, Brunetti A, Mollica C, et al. Grey matter loss in relapsing-remitting multiple sclerosis: A voxel-based morphometry study. NeuroImage. 2006;29(3):859–67.
81 Charil A, Dagher A, Lerch JP, Zijdenbos AP, Worsley KJ, Evans AC. Focal cortical atrophy in multiple sclerosis: Relation to lesion load and disability. NeuroImage. 2007;34(2):509–17.
82 Sepulcre J, Goni J, Masdeu JC, Bejarano B, Velez de Mendizabal N, Toledo JB, et al. Contribution of white matter lesions to gray matter atrophy in multiple sclerosis: evidence from voxel-based analysis of T1 lesions in the visual pathway. Arch Neurol. 2009;66(2):173–9.
83 Bodini B, Khaleeli Z, Cercignani M, Miller DH, Thompson AJ, Ciccarelli O. Exploring the relationship between white matter and gray matter damage in early primary progressive multiple sclerosis: an in vivo study with TBSS and VBM. Human Brain Mapp. 2009;30(9):2852–61.
84 Sepulcre J, Sastre-Garriga J, Cercignani M, Ingle GT, Miller DH, Thompson AJ. Regional Gray Matter Atrophy in Early Primary Progressive Multiple Sclerosis: A Voxel-Based Morphometry Study. Arch Neurol. 2006;63(8):1175–80.
85 Pagani E, Rocca MA, Gallo A, Rovaris M, Martinelli V, Comi G, et al. Regional Brain Atrophy Evolves Differently in Patients with Multiple Sclerosis According to Clinical Phenotype. AJNR Am J Neuroradiol. 2005;26(2):341–6.
86 Battaglini M, Giorgio A, Stromillo ML, Bartolozzi ML, Guidi L, Federico A, et al. Voxel-wise assessment of progression of regional brain atrophy in relapsing-remitting multiple sclerosis. J Neurol Sci. 2009;282(1-2):55–60.
87 Bendfeldt K, Kuster P, Traud S, Egger H, Winklhofer S, Mueller-Lenke N, et al. Association of regional gray matter volume loss and progression of white matter lesions in multiple sclerosis – A longitudinal voxel-based morphometry study. NeuroImage. 2009;45(1):60–7.
88 Bendfeldt K, Blumhagen JO, Egger H, Loetscher P, Denier N, Kuster P, et al. Spatiotemporal distribution pattern of white matter lesion volumes and their association with regional grey matter volume reductions in relapsing-remitting multiple sclerosis. Human brain mapping. 2010;31(10):1542–55.
89 Evangelou N, Konz D, Esiri MM, Smith S, Palace J, Matthews PM. Regional axonal loss in the corpus callosum correlates with cerebral white matter lesion volume and distribution in multiple sclerosis. Brain. 2000;123(9):1845–9.
90 Ramasamy DP, Benedict RH, Cox JL, Fritz D, Abdelrahman N, Hussein S, et al. Extent of cerebellum, subcortical and cortical atrophy in patients with MS: a case-control study. J Neurol Sci. 2009;282(1-2):47–54.
91 Rudick RA, Lee J-C, Nakamura K, Fisher E. Gray matter atrophy correlates with MS disability progression measured with MSFC but not EDSS. J Neurol Sci. 2009;282(1-2):106–11.
92 Yaldizli O, Atefy R, Gass A, Sturm D, Glassl S, Tettenborn B, et al. Corpus callosum index and long-term disability in multiple sclerosis patients. J Neurol. 2010;257(8):1256–64.
93 Di Filippo M, Anderson VM, Altmann DR, Swanton JK, Plant GT, Thompson AJ, et al. Brain atrophy and lesion load measures over 1 year relate to clinical status after 6 years in patients with clinically isolated syndromes. J Neurol Neurosurg Psychiatry. 2010;81(2):204–8.
94 Tedeschi G, Dinacci D, Lavorgna L, Prinster A, Savettieri G, Quattrone A, et al. Correlation between fatigue and brain atrophy and lesion load in multiple sclerosis patients independent of disability. J Neurol Sci. 2007;263(1-2):15–9.
95 Penner I, Calabrese P. Managing fatigue: clinical correlates, assessment procedures and therapeutic strategies. Int MS J. 2010;17(1):28–34.
96 Andreasen AK, Jakobsen J, Soerensen L, Andersen H, Petersen T, Bjarkam CR, et al. Regional brain atrophy in primary fatigued patients with multiple sclerosis. NeuroImage. 2010;50(2):608–15.
97 Rao SM, Leo GJ, Bernardin L, Unverzagt F. Cognitive dysfunction in multiple sclerosis. I. Frequency, patterns, and prediction. Neurology. 1991;41(5):685–91.
98 Amato MP, Ponziani G, Siracusa G, Sorbi S. Cognitive dysfunction in early-onset multiple sclerosis: a reappraisal after 10 years. Arch Neurol. 2001;58(10):1602–6.
99 Glanz BI, Holland CM, Gauthier SA, Amunwa EL, Liptak Z, Houtchens MK, et al. Cognitive dysfunction in patients with clinically isolated syndromes or newly diagnosed multiple sclerosis. Mult Scler. 2007;13(8):1004–10.
100 Calabrese M, Rinaldi F, Mattisi I, Grossi P, Favaretto A, Atzori M, et al. Widespread cortical thinning characterizes patients with MS with mild cognitive impairment. Neurology. 2010;74(4):321–8.
101 Houtchens MK, Benedict RH, Killiany R, Sharma J, Jaisani Z, Singh B, et al. Thalamic atrophy and cognition in multiple sclerosis. Neurology. 2007;69(12):1213–23.
102 Riccitelli G, Rocca MA, Pagani E, Rodegher ME, Rossi P, Falini A, et al. Cognitive impairment in multiple sclerosis is associated to different patterns of gray matter atrophy according to clinical phenotype. Human Brain Mapping. 2011;32(10):1535–43.
103 Sumowski JF, Chiaravalloti N, Wylie G, Deluca J. Cognitive reserve moderates the negative effect of brain atrophy on cognitive efficiency in multiple sclerosis. Journal of the International Neuropsychological Society: JINS. 2009;15(4):606–12.
104 Kappos L, Radue EW, O’Connor P, Polman C, Hohlfeld R, Calabresi P, et al. A placebo-controlled trial of oral fingolimod in relapsing multiple sclerosis. N Engl J Med. 2010;362(5):387–401.
105 Cohen JA, Barkhof F, Comi G, Hartung HP, Khatri BO, Montalban X, et al. Oral fingolimod or intramuscular interferon for relapsing multiple sclerosis. N Engl J Med. 2010;362(5):402–15.
106 Comi G, Pulizzi A, Rovaris M, Abramsky O, Arbizu T, Boiko A, et al. Effect of laquinimod on MRI-monitored disease activity in patients with relapsing-remitting multiple sclerosis: a multicentre, randomised, double-blind, placebo-controlled phase IIb study. Lancet. 2008;371(9630):2085–92.
107 Comi G, Jeffery D, Kappos L, Montalban X, Boyko A, Rocca MA, et al. Placebo-controlled trial of oral laquinimod for multiple sclerosis. N Engl J Med. 2012;366(11):1000–9.
108 Leary SM, Miller DH, Stevenson VL, Brex PA, Chard DT, Thompson AJ. Neurology. 2003;60(1):44–51.
109 Filippi M, Rovaris M, Inglese M, Barkhof F, De Stefano N, Smith S, et al. Interferon beta-1a for brain tissue loss in patients at presentation with syndromes suggestive of multiple sclerosis: a randomised, double-blind, placebo-controlled trial. Lancet. 2004;364(9444):1489–96.
110 Kappos L, Freedman MS, Polman CH, Edan G, Hartung HP, Miller DH, et al. Long-term effect of early treatment with interferon beta-1b after a first clinical event suggestive of multiple sclerosis: 5-year active treatment extension of the phase 3 BENEFIT trial. Lancet Neurol. 2009;8(11):987–97.
111 Molyneux PD, Kappos L, Polman C, Pozzilli C, Barkhof F, Filippi M, et al. The effect of interferon beta-1b treatment on MRI measures of cerebral atrophy in secondary progressive multiple sclerosis. Brain. 2000;123(11):2256–63.
112 Miller DH, Soon D, Fernando KT, MacManus DG, Barker GJ, Yousry TA, et al. MRI outcomes in a placebo-controlled trial of natalizumab in relapsing MS. Neurology. 2007;68(17):1390–401.
113 Rovaris M, Comi G, Rocca MA, Wolinsky JS, Filippi M. Short-term brain volume change in relapsing-remitting multiple sclerosis: Effect of glatiramer acetate and implications. Brain. 2001;124(9):1803–12.
114 Filippi M, Rovaris M, Iannucci G, Mennea S, Sormani MP, Comi G. Whole brain volume changes in patients with progressive MS treated with cladribine. Neurology. 2000;55(11):1714–8.
115 Paolillo A, Coles AJ, Molyneux PD, Gawne-Cain M, MacManus D, Barker GJ, et al. Quantitative MRI in patients with secondary progressive MS treated with monoclonal antibody Campath 1H. Neurology. 1999;53(4):751–7.
116 Barkhof F, Hulst HE, Drulovic J, Uitdehaag BM, Matsuda K, Landin R. Ibudilast in relapsing-remitting multiple sclerosis: a neuroprotectant? Neurology. 2010;74(13):1033–40.
117 Ashburner J, Friston KJ. Voxel-Based Morphometry – The Methods. NeuroImage. 2000;11(6):805–21.
118 Good CD, Johnsrude IS, Ashburner J, Henson RNA, Friston KJ, Frackowiak RSJ. A Voxel-Based Morphometric Study of Ageing in 465 Normal Adult Human Brains. NeuroImage. 2001;14(1):21–36.
119 Fischl B, Dale AM. Measuring the thickness of the human cerebral cortex from magnetic resonance images. Proc Natl Acad Sci U S A. 2000;97(20):11050–5.
120 Portaccio E, Stromillo ML, Goretti B, Hakiki B, Giorgio A, Rossi F, et al. Natalizumab may reduce cognitive changes and brain atrophy rate in relapsing-remitting multiple sclerosis: a prospective, non-randomized pilot study. Eur J Neuro. 2013;20(6):986–90.
121 Jones CK, Riddehough A, Li DKB, Zhao G, Paty DW.MRI cerebral atrophy in relapsing-remitting MS: Results from the PRISMS Trial. Neurology 2001;56(suppl 3):A379.