Medical care of type 2 diabetes mellitus in light of international and national recommendations: a retrospective analysis
DOI: https://doi.org/10.4414/smw.2013.13871
Konstantin
Burgmann, Sandra A.
Fatio, Beat
Jordi, Jonas
Rutishauser
Abstract
QUESTION UNDER STUDY: Type 2 diabetes mellitus (T2Dm) is a chronic disease with great economic impact. In 2009, the Swiss Society for Endocrinology and Diabetes (SSED) published recommendations for treatment of T2Dm. In Switzerland, few data are currently available on metabolic control and physician compliance with treatment guidelines. We aimed to investigate clinical care in T2Dm in the year after the publication of SSED recommendations.
METHODS: We retrospectively studied the charts of all patients with T2Dm admitted to our general internal medicine clinic during 2009. Metabolic control was judged from glycated haemoglobin A1c (HbA1c) levels. Antidiabetic therapy was analysed, and frequencies of screening for end-organ damage were investigated. A group with newly diagnosed T2Dm was analysed separately from patients with known T2Dm upon admission.
RESULTS: In patients with known T2Dm, the mean (± standard deviation) HbA1c level was 7.66% ± 1.73%. Only 44% of patients showed HbA1c levels at the target of ≤7%. Prior to admission and at discharge, 56% and 55% of patients, respectively, were treated with metformin. Among patients with HbA1c >8.5%, the proportion of those treated with insulin increased from 49% upon admission to 76% at discharge. Only half the patients received a lifestyle intervention in the year prior to admission or during hospital stay. Screening for diabetic retinopathy and nephropathy was performed in approximately one-third and two-thirds of patients, respectively.
CONCLUSIONS: In the majority of unselected T2Dm patients admitted to our hospital, metabolic control was suboptimal. Implementation of treatment recommendations by both general practitioners and hospitals should be improved.
Introduction
The prevalence of type 2 diabetes mellitus (T2Dm) is increasing worldwide, mainly because of life-style factors and population ageing in many societies. Patients with T2Dm are at high risk for macro- and micro-vascular complications, which can be reduced by good metabolic control and reduction of other cardiovascular risk factors [1, 2].
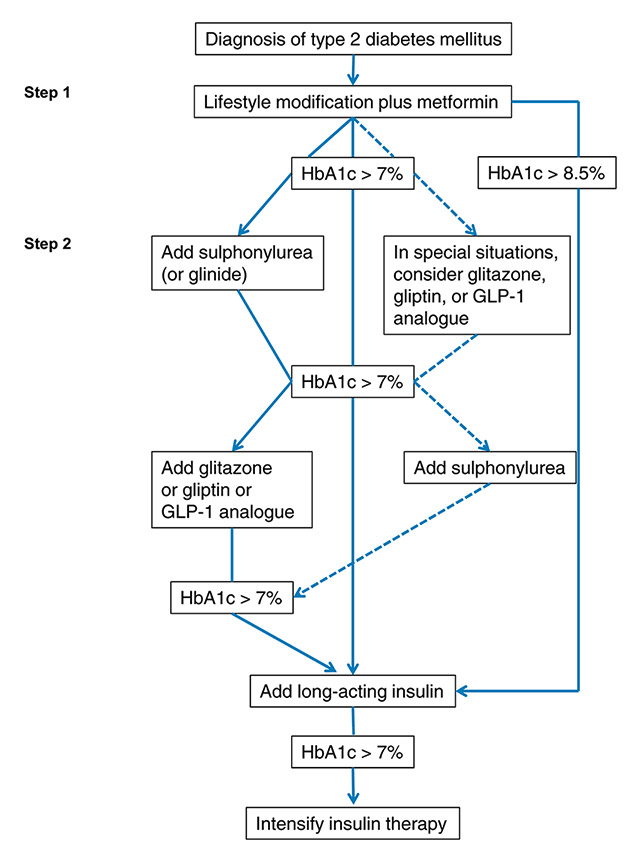
Figure 1
SSED 2009 treatment recommendations for type 2 diabetes. Adapted, with permission, from reference 6 (Swiss Med Forum. 2009;9(3):50-5 http://www.medicalforum.ch/docs/smf/archiv/de/2009/2009-03/2009-03-280.PDF .
GLP-1 = glucagon-like peptide-1; HbA1c = glycated haemoglobin A1c
In 2006 and 2009, the American Diabetes Association (ADA) and the European Association for the Study of Diabetes (EASD) published consensus algorithms for treatment of T2Dm. [3, 4]. These guidelines advocated lifestyle intervention and metformin therapy upon the diagnosis of diabetes. In order to achieve metabolic control (glycated haemoglobin A1c [HbA1c] generally <7%), rapid adjustment of medication and early initiation of insulin therapy was recommended if initial therapeutic measures failed to achieve target glycaemic goals.
Standards of medical care, as published by the ADA, include (among others) strict blood pressure control (<130 mm Hg systolic, <80 mm Hg diastolic), monitoring for and treatment of dyslipidaemia (low density lipoprotein [LDL] cholesterol <2.6 mmol/l [target levels may be <1.8 mmol/l in high-risk individuals]), as well as screening for nephropathy, retinopathy and distal polyneuropathy at diagnosis and annually thereafter [5]. Based on the ADA/EASD consensus statement, an expert panel of hospital-based and practising diabetologists published in January 2009, on behalf of the Swiss Society for Endocrinology and Diabetes (SSED), recommendations for the clinical care of T2Dm [6]. These include a treatment algorithm aiming at a target HbA1c level of ≤7% (fig. 1).
Quality of metabolic control, efficacy of therapeutic measures and efforts to prevent late complications in T2Dm patients often do not meet the goals set by treatment recommendations and guidelines. Swiss data on these outcome measures are lacking.
We aimed to investigate, using a retrospective chart review, metabolic control and compliance of general practitioners and hospital-based internists with SSED recommendations in a cohort of unselected hospital-admitted patients.
|
Table 1:Baseline characteristics and HbA1c levels. |
|
|
Group A (n = 275)
|
Group B (n = 23)
|
|
n (%)1
|
|
n (%)1
|
|
| Age [yr] |
275 (100) |
74.2 ± 10.8 |
23 (100) |
67.7 ± 12.4 |
| Sex [m/w] |
275 (100) |
137/138 |
23 (100) |
12/11 |
| Weight [kg] |
266 (96.7) |
79.3 ± 18.9 |
22 (95.7) |
78.8 ± 17.8 |
| Duration of diabetes [yr] |
171 (62.2) |
13.5 ± 8.5 |
n.a. |
n.a. |
| Smokers [%] |
67 (24.4) |
11.6 |
11 (47.8) |
39.1 |
| eGFR [ml/min] |
265 (96.4) |
76.1 ± 39.8 |
22 (95.7) |
81.79 ± 37.65 |
| HbA1c [%] |
257 (93.5) |
7.66 ± 1.73 |
22 (95.7) |
8.42 ± 2.47 |
| Numbers are given as mean ± standard deviation.
1 denotes number (percent of group total) of patients for which the information is available.
n.a., not applicable. |
Methods
All in-patients admitted to the medical clinic and medical intensive care unit at the Hospital Centre Biel/Bienne between 15 January 2009 (date of publication of the SSED consensus statement) and 31 December 2009, were assessed for eligibility. When patients were readmitted to hospital during the study period, only the first hospitalisation was taken into account. We excluded patients with coexisting disease making survival of >6 months unlikely, and those depending on professional help for everyday life.

Figure 2
A. Distribution of glycated haemoglobin A1c (HbA1c) values in patients from group A (panel A) and group B (panel B). Figures indicate absolute numbers of patients in each HbA1c subgroup.
Patients with T2Dm were identified by searching for the diagnosis in their discharge note. The presence of T2Dm was confirmed by past medical history and/or diagnostic laboratory values during hospitalisation (fasting plasma glucose [FPG] >7.0 mmol/l, a random plasma glucose [RPG] >11.1 mmol/l or an HbA1c value ≥6.5%). HbA1c was measured with an immune-turbidimetric assay. Renal function was quantified using the MDRD formula [7].
We considered patients with known T2Dm upon hospital admission (group A) separately from those with a first-time diagnosis made during the index hospitalisation (group B). We evaluated compliance with SSED treatment recommendations upon admission (group A) and at discharge (both groups). We assessed HbA1c, presence or absence of metformin and insulin treatment, as well as other diabetes-specific medication. We defined lifestyle intervention (LSI) as specific counselling on smoking cessation, physical activity and eating habits by a physician and/or a dietician. We evaluated assessment of diabetic end-organ damage, as evidenced by documented pulse state in the medical chart (macroangiopathy), measuring urinary 24-hour protein excretion or albumin/creatinine ratio (nephropathy), microfilament, vibration testing, or electroneurographic tests (neuropathy), and fundoscopy by an ophthalmologist (retinopathy). An end-organ screening or treatment recommendation made by hospital-based internists to the general practitioner was considered as compliant care. Figures are given as absolute numbers, percent of group total, or mean ± standard deviation (SD), as appropriate.
Coprimary outcome measures were (i.) quality of metabolic control as assessed by HbA1c levels and (ii.) compliance of therapy with 2009 SSED treatment recommendations.
Secondary outcome measures were: (i.) diabetes-specific medications, (ii.) presence or absence of screening for organ complications, (iii.) presence or absence of medication for arterial vascular disease, arterial hypertension, and lowering of LDL-cholesterol, (iv.) presence or absence of target blood pressure levels, and (v.) presence or absence of target LDL cholesterol levels. Adequacy of care was judged according to the 2009 ADA Standards of Medical Care [8]. In most patients, HbA1c was measured during their hospital stay. If no HbA1c value was available from the record, we asked general physicians for available information on readings performed no later than three months prior to admission. Ethical approval for the study was given by the institutional review board.
|
Table 2: Metformin and insulin therapy according to HbA1c values. |
|
|
|
Group A
(n = 275)
|
|
|
|
Group B
(n = 23)
|
|
|
|
| HbA1c |
|
any |
≤7% |
7.1–8.5% |
>8.5% |
any |
≤7% |
7.1–8.5% |
>8.5% |
| Metformin
use |
admission |
155/275 (56%) |
61/114 (54%) |
61/92 (66%) |
24/51 (47%) |
– |
– |
– |
– |
| |
discharge |
150/275 (55%) |
53/114 (46%) |
57/92 (62%) |
33/52 (63%) |
11/23 (48%) |
5/11 (45%) |
2/2 (100%) |
3/9
(33%) |
| |
+/-1
|
+27 / -32 |
+2 / -10 |
+9 / -13 |
+15 / -6 |
– |
– |
– |
– |
| Insulin
use |
admission |
99/275 (36%) |
30/114 (26%) |
40/92 (43%) |
25/51 (49%) |
– |
– |
– |
– |
| |
discharge |
118/275 (43%) |
32/114 (28%) |
40/92 (43%) |
39/51 (76%) |
9/23 (39%) |
2/11 (18%) |
0/2
(0%) |
7/9
(78%) |
| |
+/-1
|
+37 / -18 |
+9 / -7 |
+12 / -9 |
+16 / -2 |
– |
– |
– |
– |
|
1 denotes number of patients in which specific treatment was initiated (+) or discontinued (-) during hospitalisation. |
Results
We identified 381 patients with T2Dm; 83 patients (21.8%) fulfilled exclusion criteria. Of the remaining 298 patients, 275 (92.3%) had been diagnosed with T2Dm prior to admission (group A), and 23 (7.7%) were newly diagnosed during the index hospitalisation (group B). Of the latter, four patients (17.4%) were hospitalised because of hyperglycaemia or its direct sequelae. Information on HbA1c was available for 93.5% of patients from group A and 96% from group B, respectively.
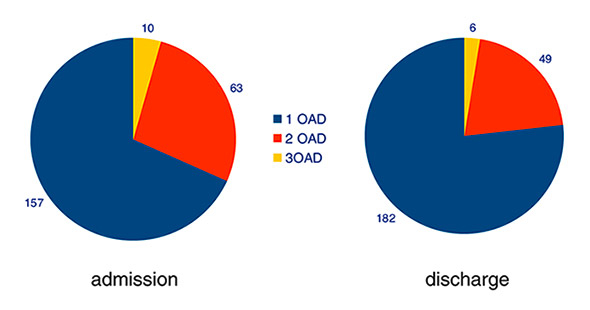
Figure 3
Therapy with oral antidiabetic drugs (OADs) in patients from group A. Figures indicate absolute numbers of patients treated with one, two or three OADs.

Figure 4
Classes of oral antidiabetic drugs prescribed for patients from group A. Figures indicate absolute numbers of patients treated with each class of drugs.
DPP4 = dipeptidyl peptidase 4
Baseline characteristics of both groups are shown in table 1.
Primary outcome measures
Metabolic control
In group A, mean (± standard deviation [SD]) HbA1c was 7.66% ± 1.73%. Of the 257 patients (93.5%) for whom information on HbA1c was available, 114 (44%) showed HbA1c values at target levels (≤7%). In 92 patients (36%), HbA1c was >7% but ≤8.5%, and in 51 (20%), HbA1c was >8.5% (fig. 2A). In group B, HbA1c levels were available in 22 of 23 (96%) patients, with a mean (± SD) value of 8.42% ± 2.47%. HbA1c was <7% in 11 patients (50%), >7% but ≤8.5% in two (9%), and > 8.5% in nine patients (41%) (fig. 2B).
Compliance of treatment with SSED recommendations
In group A, 133 patients (48.4%) had received a lifestyle intervention (LSI) in the year prior to admission; in 107 patients (38.9%), a dietary intervention was performed during hospitalisation. In the 143 patients with insufficient metabolic control as evidenced by HbA1c >7%, rates of LSI were slightly higher, at 52% and 53% prior to admission and during hospital stay, respectively. Among the 143 patients with HbA1c level >7%, 85 (59%) were treated with metformin; the proportion increased to 63% (90 of 143) at hospital discharge.
In group B, LSI was performed in the hospital or prescribed at discharge in 15 patients (65%). Only 11 of 23 patients (48%) were started on metformin while hospitalised. Of all patients with newly diagnosed T2Dm, merely 8 (35%) were discharged with both installed metformin therapy and performed or scheduled LSI, as recommended by the SSED. However, >90% of patients showing A1c-levels >7% received LSI during their hospitalisation.
Treatment with metformin and insulin in both groups according to Hb1Ac values is summarised in table 2. In group A, overall metformin prescription rate did not change during hospitalisation; it decreased by 8% and 4% in the subgroups with HbA1c ≤7% and 7.1%–8.5%, respectively, but increased by 16% in those with HbA1c >8.5%. Thus, 63% of patients with poor metabolic control were discharged on metformin. We observed an effect of renal function on metformin prescription practice. The proportion of patients receiving metformin in the presence of an estimated glomerular filtration rate (eGFR) <60 ml/min decreased from 45% upon admission to 27% at discharge, whereas the proportion of patients not receiving metformin despite an eGFR ≥60 ml/min decreased from 39% to 33%.
In general, more patients in group A were treated with insulin at hospital discharge than upon admission. In the subgroups with HbA1c levels ≤7%, 7.1%–8.5%, and >8.5%, the proportion of patients discharged on insulin was 28% (admission: 26%), 43% (admission: 43%), and 76% (admission: 49%), respectively.
In group B, metformin therapy was initiated in 11 of 23 patients (48%). Six of the 12 patients who did not receive metformin had an eGFR <60 ml/min. The remaining six patients were not treated with metformin even though eGFR was ≥60 ml/min. The overall proportion of patients who were discharged on insulin was 39%. Of the nine individuals with poor metabolic control (HbA1c >8.5%), seven (78%) left hospital on insulin treatment.
Secondary outcome measures
Diabetes-specific medication
On admission, 230 of the 275 patients in group A (84%) were on treatment with one or more oral antidiabetic drugs (OADs) (fig. 3); 157 patients (68%) received monotherapy, 63 (27%) had two OADs, and 10 patients (4%) were treated with three drugs. During hospitalisation, combination therapy was reduced, mainly due to the introduction of insulin therapy. Figure 4 depicts the numbers of patients treated with various OADs alone or in combination. Metformin was used most frequently, followed by sulphonylureas. GLP-1 analogues were not used in our cohort. In group B, 11 patients (48%) were started on metformin therapy; two patients with eGFR <60 ml/min received sulphonylurea instead (not shown). No other OADs were prescribed in this group.
Screening for organ complications
Data on screening for and presence of end-organ damage are shown in table 3. In group A, screening for macroangiopathy, nephropathy, and peripheral neuropathy was performed in 78%, 66%, and 67% of patients, respectively, whereas retinopathy was evaluated in only 31%. In those screened, macroangiopathy, nephropathy, and neuropathy were found in 71%, 58%, and 66%, respectively, whereas retinopathy was present in 29% of patients. In group B, screening rates ranged between 22% (neuropathy) and 56% (nephropathy and macroangiopathy); macroangiopathy, nephropathy, and neuropathy were found in 85%, 69%, and 20% of screened patients, respectively. Retinopathy was screened for in 35% of patients; no diagnoses were made.
Medication for arterial vascular disease, arterial hypertension, and lowering of LDL cholesterol
As shown in table 4, the majority of patients in group A (70%) were treated with an antiplatelet agent upon admission. The proportion increased further during hospital stay, reaching 94% at discharge in patients with macroangiopathy. Conversely, in group B only 61% of all patients and 77% of those with macroangiopathy were discharged on an antiplatelet drug, despite qualifying for therapy according to ADA standards of medical care since all patients were over 40 years of age [8]. In group A overall, 68% of patients on admission and 77% at discharge were treated with an ACE inhibitor (ACE-I) or angiotensin receptor blocker (ARB); the overall proportion of patients treated with one or more additional antihypertensive was 56% on admission and 66% at discharge. Discharge treatment rates for ACE-I or ARB increased to 80% if arterial hypertension and to 87% if diabetic nephropathy were present. Notably, 18 patients on admission (7%) and 10 patients at discharge (4%) were treated with an antihypertensive agent other than ACE-I or ARB despite the presence of diabetic nephropathy (not shown). The overall rate of statin-treated patients rose from 45% on admission to 56% at discharge; treatment rates at discharge were higher in those with LDL levels ≥ 2.6 mM (65% treated) as well as those with LD L ≥1.8 mM in the presence of macroangiopathy (81% treated). Prescription rates for ACE-I/ARB and statins in discharged patients of group B were similar to those in group A, reaching 89% and 80% in high-risk individuals.
Target blood pressure levels
We assessed blood pressure readings during hospitalisation. In group A, 220 patients (80%) showed systolic values >130 mm Hg on at least two different occasions, thus qualifying as hypertensive. In group B, 17 patients (74%) showed arterial hypertension.
Target LDL cholesterol levels
Among patients in group A, LDL cholesterol levels were known in 60% of patients with a mean (± SD) concentration of 2.63 ± 1.06 mmol/l. In group B, information on LDL was available in 57%, mean LDL cholesterol was 3.11 ± 1.5 mmol/l. Of the patients with known LDL values, 57% in group A and 46% in group B reached the target level of <2.6 mmol/l.
|
Table 3: Screening for and presence of end-organ damage. |
|
Type of end-organ damage
|
Group A(n = 275)
|
Group B(n = 23)
|
|
Screened,
n (% of group total)
|
Present,
n (% of screened patients)
|
Screened,
n (% of group total)
|
Present
n (% of screened patients)
|
| Macroangiopathy |
214 (78%) |
152 (71%) |
13 (56%) |
11 (85%) |
| Nephropathy |
182 (66%) |
106 (58%) |
13 (56%) |
9 (69%) |
| Peripheral neuropathy |
184 (67%) |
122 (66%) |
5 (22%) |
1 (20%) |
| Retinopathy |
86 (31%) |
25 (29%) |
8 (35%) |
– |
|
Table 4: Medication for diabetes-associated disease. |
|
|
Group A
|
Group B
|
|
Total
|
Age >40 y
|
With MAP
|
Total
|
Age >40 y
|
With MAP
|
| ASA |
Admission |
192/275 (70%) |
191/274 (70%) |
125/152 (82%) |
– |
– |
– |
| ASA |
Discharge |
220/275 (80%) |
219/274 (80%) |
143/152 (94%) |
14/23 (61%) |
14/23 (61%) |
10/13 (77%) |
| |
|
Total
|
With aHTN
|
With DNP
|
Total
|
With aHTN
|
With DNP
|
| ACE-I/ARB |
Admission |
186/275 (68%) |
151/220 (69%) |
79/106 (75%) |
– |
– |
– |
| ACE-I/ARB |
Discharge |
211/275 (77%) |
175/220 (80%) |
92/106 (87%) |
13/23 (57%) |
11/17 (65%) |
8/9
(89%) |
| |
|
Total
|
LDL ≥2.6 mmol/l
|
LDL ≥1.8 mmol/l and MAP
|
Total
|
LDL ≥2.6 mmol/l
|
LDL ≥1.8 mmol/l and MAP
|
| Statin |
Admission |
123/275 (45%) |
23/71 (32%) |
42/79 (53%) |
– |
– |
– |
| Statin |
Discharge |
155/275 (56%) |
46/71 (65%) |
64/79 (81%) |
11/23 (48%) |
5/7 (71%) |
4/5
(80%) |
| ASA = aminosalicylic acid; ACE-I = angiotensin converting enzyme inhibitor; ARB = angiotensin receptor blocker; MAP = macroangiopathy; aHTN = arterial hypertension; DNP = diabetic nephropathy; LDL = low density lipoprotein cholesterol |
Discussion
The aim of our study was to analyse retrospectively the quality of glycaemic control in unselected patients with T2Dm admitted to a secondary care general internal medicine clinic, and to evaluate compliance of family physicians and hospital based internists with treatment recommendations issued in January 2009 by the Swiss Society for Endocrinology and Diabetes. Data on metabolic control in Swiss adult diabetics are relatively scarce. Thomann et al., in patients admitted to a university hospital, observed an increase in HbA1c levels from 7.5% in 2002 to 8.5% in 2005 [9]. Recently, Gerber et al. have looked at regional differences of glycaemic control among Swiss patients with T2Dm [10]. Interestingly, HbA1c in treated diabetics differed according to the cultural region, with mean values varying between as low as 6.89% in the German-speaking area and 7.72% in the Italian-speaking region. Our hospital serves a linguistically heterogeneous population, of which approximately 30% is French- and 70% German-speaking. We analysed the records of all patients admitted to our institution in 2009, excluding patients in whom strict application of SSED treatment recommendation would a priori seem inappropriate. This strategy enabled us to evaluate a largely unselected sample of medical inpatients.
As one of the main findings, we observed a mean HbA1c level of 7.66% in our patients with known T2Dm (group A). Direct comparison of reported cross-sectional HbA1c values is difficult owing to differences in study populations (e.g., nationality, age, duration of disease and treatment, comorbidities), general settings (e.g., in- vs out-patients) and other potential biases (e.g., selection, detection). As compared with the HbA1c value of 6.89% reported by Gerber et al. or that of 7.2% in a European cross-sectional study [11], mean HbA1c in our patients with known diabetes was relatively high. A recent Austrian study observed nonsignificant differences in mean HbA1c levels in outpatients 70–79 years of age (7.1%) and those of ≥80 years old (7.6%) [12]. In our newly diagnosed patients (group B), the mean HbA1c value of 8.42% corresponds well with the figure reported by Gerber et al. in their national survey.
In light of recent data from randomised controlled trials, the 2012 and 2013 ADA guidelines advocate individualised HbA1c goals in type 2 diabetics [13, 14]. This patient-centred approach has been highlighted in a new joint ADA/EASD position statement [15]. While target values around or below 7% are still considered adequate for many patients, more or less stringent goals may be envisaged, depending on individual factors such as comorbidity, advanced complications or proneness to hypoglycaemia.
Compliance with SSED treatment recommendations varied. In group A, the proportion of patients on metformin did not change between hospital admission and discharge (56% and 55%, respectively). In patients with newly diagnosed diabetes, this proportion was only 48% overall. These relatively low figures could not be explained by impaired renal function only. Thus, SSED recommendations were not sufficiently implemented, despite the proven benefit of metformin on clinical outcomes in overweight type 2 diabetics [16]. On the other hand, insulin therapy in patients with HbA1c >8.5% was established frequently, as recommended. In this subgroup, hospital-based internists increased the proportion of adequately treated patients substantially to 76% in group A and established immunothreapy in 78% of patients in group B.
In type 2 diabetes, lifestyle modification, along with pharmacological therapy, represents the cornerstone of intensive treatment achieving substantial risk reduction for macro- and micro-vascular events [17]. Despite the highest priority of lifestyle modification in SSED recommendations, professional interventions in the year prior to hospitalisation were documented in less than 50% of patients in group A. Similarly, in group B only 65% of patients were offered or scheduled for a lifestyle intervention. Although successful implementation of lifestyle changes does not necessarily depend on professionally administered programmes, participation in the Swiss DIAfit programme is advocated by experts [18], and costs are defrayed by health insurance. In Switzerland, the transition to a healthcare funding policy based on diagnosis-related groups (Swiss DRG, executed in January 2012) resulted in substantial pressure to move medical services to the outpatient setting. Concomitantly, length of hospital stay is reduced, pressuring the resources needed to plan carefully medical activities after the hospitalisation phase. Thus, opportunities to improve outpatient diabetes care may be missed.
As shown by the United Kingdom Prospective Diabetes Study (UKPDS), intensive blood glucose control in newly diagnosed type 2 diabetics results in decreased risk of microvascular complications [1]. Moreover, beneficial “legacy” effects on micro- and macro-vascular disease were observed as long as ten years after completion of the study [2]. Conversely, in the Veterans Affairs Diabetes Trial (VADT), intensive glucose control in patients with longstanding, inadequately controlled T2Dm did not reduce risk for microvascular complications and major cardiovascular events despite significant reduction in HbA1c [19]; 40% of the VADT patients had a history of cardiovascular disease. Thus, efforts to optimise metabolic control and screening for end-organ damage must begin at diagnosis and be maintained throughout. In our cohort, rates of documented screening were insufficient. In particular, only around one-third of patients in both groups were screened for diabetic retinopathy despite the option to refer patients to ophthalmologists in our hospital or in private practice.
Our study has several limitations, mainly due to its single-centre, retrospective and cross-sectional design. Sample size of group B was small; therefore, our findings in newly diagnosed T2Dm cannot readily be generalised. The patient sample is not completely unselected, since we excluded patients with advanced comorbidities and those depending on nursing help on a daily basis. We did not have data on hypoglycaemia proneness or frequency, as well as other factors directing individual HbA1c goals. This hampers appraisal of the average HbA1c value of our patient sample with regard to the 2012 ADA/EASD position statement favouring individualised target levels. Also, although data on HbA1c levels were available for >90% of patients in both groups, we cannot exclude detection bias for other parameters as a result of underreporting or incomplete information in the medical charts. We could not analyse body mass index in our cohort, since reliable data on height was not available. Also, the relative rates of oral antidiabetic drugs prescribed during the analysed period may not represent today’s situation, since incretin-based treatment was relatively novel when the SSED treatment recommendations were published.
In summary, our data show that metabolic control in an unselected cohort of type 2 diabetics may be less than optimal. Recommendations for treatment and screening for end organ damage should be adhered more closely, both by physicians in private practice and by hospital-based internists.
References
1 UK Prospective Diabetes Study (UKPDS) Group. Intensive blood-glucose control with sulphonylureas or insulin compared with conventional treatment and risk of complications in patients with type 2 diabetes (UKPDS 33). Lancet. 1998;352(9131):837–53.
2 Holman RR, Paul SK, Bethel MA, Matthews DR, Neil HA. 10-year follow-up of intensive glucose control in type 2 diabetes. N Engl J Med. 2008;359(15):1577–89.
3 Nathan DM, Buse JB, Davidson MB, Heine RJ, Holman RR, Sherwin R, et al. Management of hyperglycemia in type 2 diabetes: A consensus algorithm for the initiation and adjustment of therapy: a consensus statement from the American Diabetes Association and the European Association for the Study of Diabetes. Diabetes Care. 2006;29(8):1963–72.
4 Nathan DM, Buse JB, Davidson MB, Ferrannini E, Holman RR, Sherwin R, et al. Medical management of hyperglycemia in type 2 diabetes: a consensus algorithm for the initiation and adjustment of therapy: a consensus statement of the American Diabetes Association and the European Association for the Study of Diabetes. Diabetes Care. 2009;32(1):193–203.
5 American Diabetes Association. Executive summary: Standards of medical care in diabetes – 2012. Diabetes Care. 2012;35(Suppl 1):S4–S10.
6 Philippe J, Brändle M, Carrel J, Diem P, Keller U, Kuntschen F, et al. Massnahmen zur Blutzuckerkontrolle bei Patienten mit Typ-2 Diabetes mellitus. Consensus statement der Schweizerischen Gesellschaft für Endokrinologie und Diabetologie (SGED). Schweiz Med Forum. 2009;9(3):50–5.
7 Levey AS, Bosch JP, Breyer Lewis J, Greene T, Rogers N, Roth D. A more accurate method to estimate glomerular filtration rate from serum creatinine: a new prediction equation. Ann Int Med. 1999;130(6):461–70.
8 American Diabetes Association. Standards of Medical Care in Diabetes – 2009. Diabetes Care. 2009;32(Supplement_1):S13–S61.
9 Thomann R, Lenherr C, Keller U. Glycaemic control in hospitalised diabetic patients at the University Hospital Basel in 2002 and in 2005. Swiss Med Wkly. 2009;139(37-38):547–52.
10 Gerber PA, Spirk D, Brändle M, Thoenes M, Lehmann R, Keller U. Regional differences of glycaemic control in patients with type 2 diabetes mellitus in Switzerland: a national cross-sectional survey. Swiss Med Wkly. 2011;141w13218.
11 Guisasola FÁ, Mavros P, Nocea G, Alemao E, Alexander CM, Yin D. Glycaemic control among patients with type 2 diabetes mellitus in seven European countries: findings from the Real-Life Effectiveness and Care Patterns of Diabetes Management (RECAP-DM) study. Diabetes, Obesity & Metab 2008;10(Supplement 1):8–15.
12 Mann E, Vonbank A, Drexel H, Saely C. Diabetes care among older adults in primary care in Austria – a cross-sectional study. Swiss Med Wkly. 2012;142w13646.
13 American Diabetes Association. Standards of medical care in diabetes – 2012. Diabetes Care. 2012;35(Supplement 1):S11–63.
14 American Diabetes Association. Standards of Medical Care in Diabetes--2013. Diabetes Care 2013;36(Supplement 1):S11–S66.
15 Inzucchi SE, Bergenstal RM, Buse JB, Diamant M, Ferrannini E, Nauck M, et al. Management of hyperglycemia in type 2 diabetes: a patient-centered approach: position statement of the American Diabetes Association (ADA) and the European Association for the Study of Diabetes (EASD). Diabetes Care. 2012;35(6):1364–79.
16 UK Prospective Diabetes Study (UKPDS) Group. Effect of intensive blood-glucose control with metformin on complications in overweight patients with type 2 diabetes (UKPDS 34). Lancet. 1998;352(9131):854–65.
17 Gaede P, Lund-Andersen H, Parving H-H, Pedersen O. Effect of a multifactorial intervention on mortality in type 2 diabetes. N Engl J Med. 2008;358(6):580–91.
18 Puder J, Grimm J-J, Hagon-Traub I, Ruiz J, Saner H. DIAFit, ein Schweizer Programm zur Förderung der körperlichen Aktivität bei Patienten mit Diabetes Typ 2. Schweiz Med Forum. 2011;11(27):478–80.
19 Duckworth W, Abraira C, Moritz T, Reda D, Emanuele N, Reaven PD, et al. Glucose control and vascular complications in veterans with type 2 diabetes. N Engl J Med. 2009;360(2):129–39.