Diagnosis and treatment of iron deficiency in medical inpatients at a Swiss tertiary university referral hospital: a retrospective observational cohort study of clinical practice
DOI: https://doi.org/10.4414/smw.2013.13847
Balthasar L
Hug, André
Tichelli, Pascal
Benkert, Guido
Stirnimann, Juerg A
Schifferli
Summary
BACKGROUND: Iron deficiency anaemia is a common disease with a prevalence of up to 19.2% in populations at risk. However, the prevalence of iron deficiency (ID) in hospitalised patients is not well known. The aims of this retrospective, observational cohort study were to evaluate the current diagnostic procedures for, and treatment of, ID as well as to estimate the prevalence of undiagnosed ID in hospitalised patients at the division of internal medicine in a Swiss tertiary university referral centre.
METHODS: Within a study period of 6 months, data from all patients hospitalised at the division of internal medicine were analysed for the presence of anaemia (defined as haemoglobin levels for males <130 g/l and for females <120 g/l) and ID (ferritin <15 µg/l or ferritin <50 µg/l and transferrin saturation <20%).
RESULTS: A total of 2,781 hospitalisation cases were analysed (2,251 unique patients, male 55.5%, mean age 66.4 years). In 2,267 cases (81.5%) results of a red blood cell count were available. In 329 cases (14.5%) iron parameters (IP) were determined and 45 (13.7%) cases / unique patients with ID were detected. Among the remaining 1,938 cases without IP determination, statistical estimation predicted 103 (56‒329) undiagnosed ID cases. In ID patients, the most prevalent diagnosis was heart failure (24.4%). Of these patients, 72.7% had haemorrhage-facilitating drugs on hospital admission or discharge.
CONCLUSION: Iron deficiency is common in internal medicine and up to two-thirds of cases may not be diagnosed. Every seventh patient who had iron parameters analysed was iron deficient and two-thirds of patients with ID were treated with intravenous iron.
Abbreviations
CR: creatinine (µmol/l)
CRP: C-reactive protein (mg/l)
EC: erythrocytes (1012/l)
FE: iron (µmol/l)
FER: ferritin (µg/l)
GFR: glomerular filtration rate (mL/min)
HB: haemoglobin (g/l)
HT: haematocrit (l/l)
ID: iron deficiency
IP: iron parameters
MCH: mean corpuscular haemoglobin (pg)
MCHC: mean corpuscular haemoglobin concentration (g/l)
MCV: mean corpuscular volume (fl)
RET: reticulocytes [°/oo]
STFR: soluble transferrin receptor (mg/l)
TIBC: total iron binding capacity (computed) (µmol/l)
Background
Iron deficiency anaemia is common in the general population; a US population study found a prevalence of 2% to 5% affecting above all toddlers, adolescent girls and young women of childbearing age [1]. In the population above the age of 50 years, this US study found a prevalence of iron deficiency (ID) of 2% (50–69 years) to 4% (≥70 years) in males and 5% (50–69 years) to 7% (≥70 years) in females [1]. A European study found a prevalence of iron deficiency of 19.3% in young females at the age of 17 to 38 years (serum ferritin <15 μg/l) [2].
The prevalence of ID in hospitalised patients is not very well known and may be significantly higher among severely ill patients and patients with chronic illnesses, depending on the type of illness, its severity, co-morbidities and treatment modalities. Therefore, we planned a study to estimate the prevalence of ID and to elucidate the current practice in diagnosis and treatment of ID in hospitalised patients at the division of internal medicine of a Swiss tertiary patient referral centre.
Methods
The study was designed as a single centre, retrospective observational cohort study including all inpatients of four wards of the division of internal medicine at a tertiary referral university hospital in north-western Switzerland. Basel University hospital has 660 beds treating about 31,000 patients on an in-patient basis and 176,000 in the ambulatory setting per year. The division of internal medicine consists of 185 beds treating around 8,000 hospitalised patients per year. The predominant medical specialties are gastroenterology, cardiology, pneumology, haematology, infectious disease, nephrology and oncology.
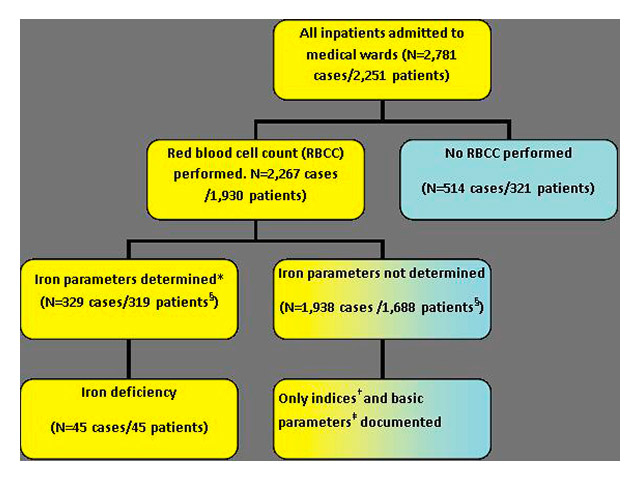
Figure 1
Case inclusion algorithm.
* At least ferritin was determined. †Indices = cellular indices such as haemoglobin, mean corpuscular volume (MCV) or the mean cellular haemoglobin concentration (MCHC) ‡ Basic parameters: age, gender, main diagnosis, results of red blood cell count (RBCC) § Number of patients with and without iron parameters do not add up to 1930, because 74 patients had in some cases iron parameters determined and in others not.
Study participants
All consecutive hospitalisations of patients ≥18 years of age on the four wards in the division of internal medicine with a blood draw between July 1st and December 31st 2011 were screened. Only hospitalisation cases with a red blood cell count (RBCC) within the study period were included in the analysis (see fig. 1). Per patient, more than one hospitalisation was accepted within the given time frame. Hospitalisation cases were assigned either to the group “iron parameters available” or to the group “no iron parameters available”. As a minimal requirement for the group “iron parameters available” at least one ferritin value had to be available.
Outcome parameters
Primary: The number of patient cases with ferritin <15 µg/l or ferritin <50 µg/l and transferrin saturation <20% who were diagnosed or not diagnosed as ID.
Secondary: The number of IP measurements and mean results according to subgroups; the number of diagnoses of ID or iron deficiency anaemia (IDA) that were retained in the patient file as well as the number and modalities of treatment.
Subgroups consisted of the main diagnosis, age, sex, presence of inflammation and the presence of anaemia with its subdivisions according to erythrocyte mean corpuscular volume (MCV) and mean corpuscular haemoglobin concentration (MCHC).
Diagnoses: The primary diagnoses as well as up to 11 secondary diagnoses as coded in ICD-10 according to the World Health Organisation (WHO; http://www.who.int/classifications/icd/icdonlineversions , last accessed April 4th, 2013) were pulled from the administrative data records.
Definitions are depicted in table 1.
Data collection
Data was extracted from the laboratory information system (LIS; Dorner Health IT Solutions, Müllheim, Germany) in patients with documented RBCC and, subsequently, with documented iron parameters (see fig. 1).
Data collected for patients with only RBCC included: age, gender, main and side diagnoses, results of RBCC with RBC indices (mean corpuscular volume, mean corpuscular haemoglobin, mean corpuscular haemoglobin concentration, haematocrit and reticulocytes).
If several blood samples were drawn during a hospitalisation, the results of the first blood sample taken were extracted for study purpose.
Data collection for patients with known ID parameters included, wherever possible, iron, ferritin, total iron binding capacity, transferrin and transferrin saturation and the soluble transferring receptor as well as the C-reactive protein (CRP). Treatment of ID included oral or intravenous iron preparations, concomitant erythropoietin and/or application of packed erythrocyte concentrates (ECs).
Statistical analysis
Continuous variables are reported as number of cases, mean, standard deviation, median, minimum and maximum. Frequencies and percentages are reported for categorical variables. Differences between subgroups were tested using the t-test for continuous and Fisher’s exact test for categorical variables, respectively. When appropriate, percentages are reported together with a 95% confidence interval (95%CI) according to Blaker (2000) [3].
An approximate estimate of the number of undiagnosed iron deficiency cases in the subset of cases with unknown iron parameters was calculated as follows: Since in the study cohort iron deficiency was almost exclusively accompanied by anaemia, we restricted the estimation of the number of undiagnosed cases on anaemic patients (a conservative assumption). Fishers’ exact test was used to compare ID frequencies in different subgroups (sex, age, anaemia, cell types, inflammation, renal failure) and to compare whether cases with and without iron parameters differed concerning these subgroups. The probability of ID (including 95% CI) given the patient is anaemic was calculated for all cell types (combinations of MCV and MCHC) using the subset of patients with known iron parameters. Then, these probabilities were multiplied by the number of cases with anaemia per cell type in the subset with unknown iron parameters, yielding the corresponding expected numbers of ID cases. Lower and upper bounds for the estimated number of cases were calculated based on the 95% confidence intervals. The expected total number of undiagnosed cases is the sum over all cases per cell type (again a point estimate with lower and upper bounds). All analyses were conducted using the statistical software R, version 2.15.1 [4].
Ethics committee
The local independent ethics committee (Ethics committee Basel) approved of the study to ensure data safety in the context of quality measurement; written patient consent was waived.
|
Table 1: Definitions. |
|
Parameter
|
Definition
|
| Iron deficiency |
Ferritin <50 µg/l and transferrin saturation <20% or ferritin <15 µg/l [18, 19] |
| Anaemia |
Males: HB <130 g/l, females: <120 g/l (<110 g/l if pregnant) [20] |
| Signs for inflammation |
C-reactive protein >5 mg/l [11] |
| Renal failure |
Glomerular filtration rate (GFR)* <30 ml/min |
| Hypochromic-normochromic-hyperchromic |
MCHC cut-offs at 320 g/l and 360 g/l ** |
| Microcytic-normocytic-macrocytic |
MCV cut-offs at 75 fl and 95 fl ** |
| Soluble transferrin receptor |
Normal range at this medical centre 2.2–5.0 mg/L *** |
| * Glomerular filtration rate (GFR) was computed using the Modification of Diet in Renal Disease (MDRD) equation: GFR (mL/min per 1.73 m2) =186x (Serum Creatinine/88.4)–1.154x(Age)–0.203 x (0.742 if female) x (1.210 if African-American) [21, 22].
** All definitions mentioned here are as used in this centre; these values may differ slightly in other medical laboratories such as mentioned by Thompson et al. (1988) [10]. *** measurement by immunoturbidimetric test with latex particle enhancement; for further discussion of utility see Mast et al. (1998) [11]
Serum creatinine was converted from µmol/L to mg/dl using (Scr/88.4)–1.154 instead of (Scr)–1.154 in order to comply with the calculation in the original papers by Levey et al. (1999, 2003). |
|
Table 2: Patient characteristics and range of diagnosis. |
|
|
n = 1,930 patients
|
n = 2,267 cases
|
| Fraction male |
1071 (55.5%) |
|
| Age (mean) |
66.4 (±16.5) years |
|
|
Number of visits in study period
|
|
|
| 1 |
1690 (87.6%) |
|
| 2 |
177 (9.2%) |
|
| >2 |
63 (3.2%) |
|
|
Main diagnosis (ICD-10)
|
|
|
| I00-I99: Diseases of the circulatory system |
|
545 (24.0%) |
| C00-D49: Neoplasms |
|
357 (15.7%) |
| J00-J99: Diseases of the respiratory system |
|
277 (12.2%) |
| A00-B99: Certain infectious and parasitic diseases |
|
261 (11.5%) |
| K00-K95: Diseases of the digestive system |
|
193 (8.5%) |
| N00-N99: Diseases of the genitourinary system |
|
120 (5.3%) |
| G00-G99: Diseases of the nervous system |
|
77 (3.4%) |
| E00-E89: Endocrine, nutritional and metabolic diseases |
|
62 (2.7%) |
| M00-M99: Diseases of the musculoskeletal system and connective tissue |
|
62 (2.7%) |
| S00-T88: Injury, poisoning and certain other consequences of external causes |
|
59 (2.6%) |
| R00-R99: Symptoms, signs and abnormal clinical and laboratory findings, not elsewhere classified |
|
56 (2.5%) |
| Others |
|
168 (7.4%) |
| No ICD coding information available |
|
86 (3.8%) |
Results
Population data
Within the observation period of six months, 2,781 hospitalisation cases were identified resulting from 2,251 unique patients. In 2,267 cases from 1,930 unique patients (85.7% of total patients, 81.5 % of total cases) results from at least a red blood cell count were available (RBCC; fig. 1). Iron parameters were analysed in 329 cases (14.5%; 319 unique patients).
Patient and case characteristics and range of diagnosis of the study population are summarised in table 2. Of 1,930 unique patients most were hospitalised once (n = 1,690, 87.6%). Diagnoses were retrieved for all cases; in 86 of 2,267 cases (3.8%) diagnoses were missing. On the base levels of ICD-coding the most common main diagnoses were diseases of the circulatory system (codes I00-I99; 24.0%), second neoplasms (codes C00-D49; 15.7%) and third, diseases of the respiratory system (codes J00-J99; 12.2%).
Laboratory values
An overview over the basic laboratory parameters is depicted in table 3.
Prevalence of anaemia with and without iron deficiency
Of 2,267 cases with a RBCC, 1400 (61.8%, 95%CI: 59.7%–63.7%) showed anaemia defined as <130 g/l in males and <120 g/l in females (<110 g/l if pregnant) according to WHO standards. Based on these definitions, in our cohort females were less often anaemic (n = 591, 58.3%, 95%CI: 55.2%–61.3%]) than males (n = 809, 64.6%, 95%CI: 61.9%–67.2%). None of the pregnant patients (n = 10) in our cohort was anaemic as defined. There were <1% of measurements with a haematocrit <20% (22/2267 cases), where we suspect dilution (e.g. blood drawn from the infusion arm).
Of 329 cases (319 unique patients) with iron parameters determined, 45 (13.7%, 95%CI: [10.2%–17,8%]) cases/unique patients with iron deficiency (ID) were detected. In 284 cases (86.3%) ID could be ruled out (either ferritin ≥50 µg/l or ferritin ≥15 µg/l together with transferrin saturation ≥20%). A total of 16 out of 45 patients (36.5%) with ID were identified based on the definition ferritin <15 µg/l and 44 patients (97.8%) based on the definition ferritin <50 µg/l and transferrin saturation <20%. All patients with ferritin <15 µg/l also showed a transferrin saturation <20% such that the latter definition would include all ID cases (in one patient transferrin saturation was not measured).
The soluble transferrin receptor (STFR) showed considerable overlap between patients with and without ID: in 35 of 45 cases with ID (STFR was not determined for one ID case) the marker was elevated (i.e. STFR >5 mg/l; 78.4%, 95%CI: 65.1%–89.2%). In 250 cases with no ID (STFR was not determined for 34 cases) the marker was low in 194 cases (77.6%, 95%CI: 72.1%–82.5%).
Prevalence of renal failure
Renal failure (RF) is usually associated with anaemia and a high iron demand. In this study, creatinine was available in 2,260 hospitalisation cases (99.7%), whereof 220 cases (9.7%, 95%CI: 8.6%–11.0%) showed a glomerular filtration rate (GFR) <30 ml/min meeting the definition of RF as suggested by Guralnik et al. (2004) [5]. The prevalence of RF did not differ between male (122/1250, 9.7%) and female patients (98/1010, 9.7%).
Prevalence of inflammation
C-reactive protein (CRP) was available in 2245 cases (99.0%; 22 measurements missing), whereof 1786 cases (79.5%, 95%CI: 77.8%–81.2%) showed signs of inflammation (CRP >5 mg/l).
In cases of inflammation, significantly less ID was detected. In cases with signs of inflammation, only 9.9% (25/252 cases) showed ID as compared to 27.0% (20/74 cases) of cases without inflammation (p <0.001).
Iron deficiency in combination with anaemia, renal failure and inflammation
ID was almost always accompanied by anaemia; only one patient (equalling one case) out of 45 with iron deficiency (2.2%) did not show any signs of anaemia in the RBCC. Overall, 8.9% of cases/patients with ID showed renal failure defined as GRF <30 ml/min and 25 cases/patients (55.6%) signs of inflammation. Of 266 cases with anaemia, 44 (16.5%) were iron deficient (see table 4).
Cellular indices: Mean corpuscular volume (MCV) and mean corpuscular haemoglobin concentration (MCHC) depending on ID status
Overall, cell types as described by the two cellular indices MCV and MCHC differed significantly between patients with ID and without (p <0.001). Compared with patients without iron deficiency, ID patients had microcytic hypochromic cells more often (26.7% vs 1.8%) and rarely had macrocytic (4.4% vs 22.9%) or hyperchromic cells (4.4% vs 22.2%). However, normocytic normochromic RBC was the most common cell type in both groups (44.4% in patients with ID vs 53.2%), which renders the prediction of ID based solely on cell indices difficult.
Approximate estimation of the number of undiagnosed ID cases
The information on the presence or absence of anaemia as well as on cell indices (MCV and MCHC) may be used to estimate the probability of ID for a patient. Table 4 summarises the number of cases with and without ID. We estimated the probability of ID for each cell type given that the patient is anaemic. Although these estimates are based on a limited number of 329 cases with known iron parameters and are not directly transferable to another population with different prevalence, they allow some general conclusions to be drawn: In our study population, the absence of anaemia allows one to basically rule out ID since 62 out of 63 patients/cases without anaemia also did not have ID (98.4%, 95%CI: 91.8%–99.9%). Also, rarely associated with ID were macrocytic and hyperchromic cells with 65 out of 67 (97.5%, 95%CI: 90.1%–99.5%) and 56 out 58 (96.5, 95%CI: [88.5%–99.45) cases, respectively, not having iron deficiency. Conversely, 12 out of 17 patients with microcytic hypochromic cell had iron deficiency (70.6%, 95%CI: 45.6%–87.6%).
Consequently, we calculated an approximate estimate of the number of undiagnosed ID cases in the remaining 1,938 cases without determination of iron parameters (IP; table 5). Cases with and without measured IP did not differ significantly concerning gender, age and inflammation markers. However, patients with IP suffered more often from renal failure (14.6% vs 8.9%, p = 0.002), were more commonly anaemic (80.8% vs 58.5%, p <0.001) and showed a significant difference in the distribution of cell indices (p <0.001 for both MCV and MCHC). As opposed to the cell indices and anaemia, renal failure was not significantly linked to ID and was therefore not included in the prediction rule.
Restricting to anaemic patients reduced the set of candidate cases from 1,938 to 1,134. Among those, 7 cases with microcytic hypochromic cells were identified which gave rise to an expected number of 5 missed ID cases. The estimated number of missed ID cases with normocytic normochromic cells is 75. Overall, the expected number of undiagnosed ID cases was 103 (lower bound 56 and upper bound 329). This corresponds to 5.3% of the cases without iron parameters determined as compared to 13.7% laboratory-proven ID cases.
Classification of diseases and quality of iron deficiency coding
Looking at the detailed diagnostic codes in patients with ID, the most prevalent diagnoses were heart failure (I50.01; 24.4%), iron deficiency with secondary anaemia due to blood loss (D50.0; 24.4 %) and iron deficiency anaemia without further specification (D50.9; 24.4%, table 6). Complications from drugs (Y57.9) figured next with 15.6% of patients, and therefore adverse drug events account for a substantial percentage of patients with laboratory proven and correctly diagnosed iron deficiency anaemia.
On the base levels of ICD-coding the most common main diagnoses in patients with ID were diseases of the circulatory system (codes I00-I99), with 35.6% of the cases compared with 24.0% in the entire study population (see table 2). Second and third most common disease groups were diseases of the digestive system (code K00-K95; patients with ID: 13.3%; study population: 8.5%) and diseases of the blood and blood-forming organs and certain disorders involving the immune mechanism (codes D50-D89; patients without ID: 11.1%, study population: 2.2%).
For iron deficiency, the following ICD-10 codes were used: D50.0, D50.8, D50.9 and E61.1. Of cases with laboratory proven ID, iron deficiency was coded in 27/45 cases (60%).
From 11 patients diagnosed with heart failure, 8 (72.7%) had aspirin, oral anticoagulants (phenprocoumon) or heparins on hospital admission or discharge.
Iron supplementation
Exactly two thirds of patients with laboratory proven iron deficiency received iron supplementation (IS) of some kind (30/45 patients, 66.6%). However, two of the 15 patients without IS received packed ECs (one received one, the other two units, respectively).
Of the 30 patients receiving IS, 80% (24/30 patients) received it by intravenous route, 16.6% (5/30 patients) orally and one patient by combined intravenous and oral administration. All patients with intravenous IS received ferric carboxymaltose. In one patient no information on the type of ingredient applied was available. More than half of intravenously supplemented patients (13/24, 54.2%) received packed ECs (range 1–4.5 units) additionally.
|
Table 3: Basic laboratory parameters (excluding iron parameters). |
|
Variable (units) |
Levels
|
N
|
Mean
|
SD
|
Median
|
Min
|
Max
|
|
Red blood cell count
|
| HB [g/l] |
female |
1014 |
114.31 |
19.81 |
115.00 |
57.00 |
179.00 |
| |
male |
1253 |
118.47 |
23.95 |
121.00 |
19.00* |
206.00 |
|
|
all
|
2267
|
116.61
|
22.28
|
118.00
|
19.00*
|
206.00
|
| HT [%] |
female |
1014 |
0.33 |
0.06 |
0.33 |
0.17 |
0.52 |
| |
male |
1253 |
0.34 |
0.07 |
0.34 |
0.06* |
0.58 |
|
|
all
|
2267
|
0.33
|
0.06
|
0.34
|
0.06*
|
0.58
|
| EC [x1012/l] |
female |
1014 |
3.72 |
0.68 |
3.76 |
1.85 |
6.22 |
| |
male |
1252 |
3.78 |
0.78 |
3.84 |
0.68 |
6.99 |
|
|
all
|
2266
|
3.75
|
0.74
|
3.80
|
0.68
|
6.99
|
| MCV [fl] |
female |
1014 |
88.59 |
7.01 |
88.40 |
58.70 |
121.00 |
| |
male |
1253 |
89.86 |
7.28 |
89.80 |
57.90 |
120.60 |
|
|
all
|
2267
|
89.29
|
7.19
|
89.20
|
57.90
|
121.00
|
| MCH [pg] |
female |
1014 |
30.89 |
2.73 |
31.10 |
18.00 |
44.10 |
| |
male |
1253 |
31.49 |
2.84 |
31.60 |
17.00 |
41.30 |
|
|
all
|
2267
|
31.22
|
2.81
|
31.40
|
17.00
|
44.10
|
| MCHC [g/l] |
female |
1014 |
348.65 |
14.61 |
350.00 |
268.00 |
402.00 |
| |
male |
1253 |
350.38 |
15.12 |
352.00 |
280.00 |
406.00 |
|
|
all
|
2267
|
349.61
|
14.91
|
351.00
|
268.00
|
406.00
|
| RET [‰] |
female |
217 |
23.79 |
18.44 |
20.00 |
1.00 |
126.00 |
| |
male |
301 |
25.95 |
23.76 |
20.00 |
1.00 |
188.00 |
|
|
all
|
518
|
25.04
|
21.70
|
20.00
|
1.00
|
188.00
|
|
Renal function
|
| CR [µmol/l] |
female |
1010 |
96.1 |
95.9 |
69.0 |
18.0 |
891.0 |
| |
male |
1250 |
121.5 |
124.6 |
85.0 |
21.0 |
1453.0 |
|
|
all
|
2260
|
110.1
|
113.4
|
78.0
|
18.0
|
1453.0
|
| |
|
| GFR [ml/min] |
female |
1010 |
80.6 |
40.3 |
78.3 |
4.2 |
374.7 |
| |
male |
1250 |
85.7 |
44.9 |
83.3 |
4.1 |
472.0 |
|
|
all
|
2260
|
83.4
|
43.0
|
80.8
|
4.1
|
472.0
|
|
Inflammation
|
| CRP [mg/l¨] |
female |
1003 |
52.7 |
71.7 |
21.6 |
0.3 |
381.5 |
| |
male |
1242 |
61.7 |
75.0 |
30.4 |
0.3 |
408.4 |
|
|
all
|
2245
|
57.7
|
73.7
|
25.0
|
0.3
|
408.4
|
| * There are <1% of measurements with a haematocrit <20%, where we suspect dilution (22/2267 cases with known haematocrit).
CRP = C-reactive protein; EC = erythrocytes; GFR = glomerular filtration rate; HB = haemoglobin; HT = haematocrit; CR = creatinine; MCV = mean corpuscular volume; MCH = mean corpuscular haemoglobin; MCHC = mean corpuscular haemoglobin concentration; RET = reticulocytes |
|
Table 4: Cell indices and probability of iron deficiency in cases with known iron parameters, according to anaemia status (n = 329 cases). |
| |
Anaemia
|
No Anaemia
|
|
|
Cell indices (MCV, MCHC)
|
ID n (%)
|
No IDn (%)
|
ID n (%)
|
No IDN (%)
|
p(ID|anaemia) [95% CI]
|
|
Microcytic hypochromic
|
12 (27.3)
|
5 (2.2)
|
|
|
70.6 [45.6–87.6]
|
| Microcytic normochromic |
5 (11.4) |
11 (5.0) |
1 (100) |
2 (3.2) |
26.3 [11.0–50.0] |
| Microcytic hyperchromic |
1 (2.3) |
1 (0.4) |
|
|
50.0 [2.5–97.5] |
| Normocytic hypochromic |
3 (6.8) |
6 (2.7) |
|
1 (1.6) |
30.0 [8.7–61.9] |
|
Normocytic normochromic
|
20 (45.4)
|
122 (55.0)
|
|
29 (46.8)
|
11.7 [7.4–17.4]
|
| Normocytic hyperchromic |
1 (2.3) |
27 (12.2) |
|
15 (24.2) |
2.3 [0.1–12.0] |
| Macrocytic hypochromic |
|
2 (0.9) |
|
|
0.0 [0.0–77.6] |
| Macrocytic normochromic |
2 (4.5) |
38 (17.1) |
|
12 (19.4) |
3.8 [0.7–12.8] |
| Macrocytic hyperchromic |
|
10(4.5) |
|
3(4.8) |
0.0 [0.0–22.5] |
|
Total
|
44 (100)
|
222 (100)
|
1 (100)
|
62 (100)
|
|
| ID = iron deficiency; MCHC = mean corpuscular haemoglobin concentration; MCV = mean corpuscular volume; p(ID|anaemia) [95% CI]: probability of ID given that the person has an anaemia [95% confidence interval] |
|
Table 5: Cell indices and probability of iron deficiency, according to availability of iron parameters (all cases, n = 2,267). |
|
Cell indices (MCV, MCHC)
|
IP n (%)
|
No IP n (%)
|
No IP anaemian (%)
|
p(ID|anaemia) [95% CI]
|
E(ID) [bounds]
|
|
Microcytic hypochromic
|
17 (5.2)
|
8 (0.4)
|
7 (0.6)
|
70.6 [45.6–87.6]
|
5 [3–6]
|
| Microcytic normochromic |
19 (5.8) |
25 (1.3) |
19 (1.7) |
26.3 [11.0–50.0] |
5 [2–9] |
| Microcytic hyperchromic |
2 (0.6) |
0 (0.0) |
0 (0.0) |
50.0 [2.5–97.5] |
0 [0–0] |
| Normocytic hypochromic |
10 (3.0) |
21 (1.1) |
20 (1.8) |
30.0 [8.7–61.9] |
6 [2–12] |
|
Normocytic normochromic
|
171 (52.0)
|
1,069 (55.2)
|
641 (56.5)
|
11.7 [7.4–17.4]
|
75 [47–111]
|
| Normocytic hyperchromic |
43 (13.1) |
470 (24.3) |
224 (19.8) |
2.3 [0.1–12.0] |
5 [0–27] |
| Macrocytic hypochromic |
2 (0.6) |
17 (0.9) |
13 (1.1) |
0.0 [0.0–77.6] |
0 [0–10] |
| Macrocytic normochromic |
52 (15.8) |
273 (14.1) |
174 (15.3) |
3.8 [0.7–12.8] |
7 [1–22] |
| Macrocytic hyperchromic |
13 (4.0) |
55 (2.8) |
36 (3.2) |
0.0 [0.0–22.5] |
0 [0–8] |
|
Total
|
329 (100.0)
|
1,938 (100.0)
|
1,134 (100.0)
|
|
103 [56–329]
|
| E(ID)[bounds]: Estimated number of ID cases among the population with unknown iron parameters [upper and lower bound of the prediction based on the 95% CI], ID = iron deficiency, IP = with known iron parameters, no IP = iron parameters not known, no IP anaemia = patients with anaemia with unknown iron parameters. p(ID|anaemia) [95% CI]: probability of ID given that the person has an anaemia [95% confidence interval] |
|
Table 6: The ten most common diagnoses in patients with iron deficiency (n = 45). |
|
ICD-10 code
|
Definition
|
Iron deficiencyn (%)*
|
| I50.01 |
Congestive heart failure |
11 (24.4) |
| D50.0 |
Iron deficiency anaemia secondary to blood loss (chronic) |
11 (24.4) |
| D50.9 |
Iron deficiency anaemia, unspecified |
11 (24.4) |
| I10.90 |
Essential hypertension |
10 (22.2) |
| Y57.9 |
Complications of drugs or medication, unspecified |
7 (15.6) |
| N18.3 |
Chronic kidney disease, stage 3 (moderate) |
6 (13.3) |
| E11.90 |
Type 2 diabetes mellitus without complications |
6 (13.3) |
| I11.90 |
Hypertensive heart disease without heart failure |
6 (13.3) |
| I25.19 |
Atherosclerotic heart disease, unspecified |
5 (11.1) |
| I08.1 |
Rheumatic disorders of both mitral and tricuspid valves |
5 (11.1) |
| E87.6 |
Hypokaalemia |
5 (11.1) |
| D62 |
Acute post-haemorrhagic anaemia |
5 (11.1) |
| D50.8 |
Other iron deficiency anaemias |
5 (11.1) |
| * There may be more than one of these diagnoses per patient. |
Discussion
Whereas anaemia is a well-recognised medical problem, iron deficiency (ID) – although very common – is often neglected; moreover its management is not well standardised, although guidelines exist for example in nephrology [6]. In this study we elucidate the in-hospital management of ID across different diseases mainly in the fields of gastroenterology, cardiology, nephrology, oncology and haematology.
More than 60% of the patients hospitalised were anaemic in this university hospital; the prevalence was 5–6 times higher than large surveys shown for the general population [5, 7]. Thus, hospitalisation per se represents a selection towards anaemia.
Another selection process seems to take place when physicians receive their patients’ first laboratory analyses: anaemia and renal failure as defined here seem to trigger the request for IPs. Our study supports this clinical reasoning.
The prevalence of measured iron deficiency (ID) in anaemic patients was 16.5% in our cohort; compared to a US population survey by Guralnik et al. it was identical (2004; 16.6%) [5]. This high prevalence is not astonishing given the frequent gastrointestinal blood loss and nutritional issues such as concomitant vitamin B12 and folate deficiencies in these patients [5]. Furthermore, heart failure was the most common diagnosis in our patients with ID; this may on one hand reflect the influence of studies showing the benefit of iron supplementation in these patients, such as the one by Anker et al. (2009) and others [8, 9]. On the other hand, almost three out of four patients with heart failure were treated with aspirin, oral anticoagulants, heparins or a combination of anticoagulants on admission as well as on discharge. It may well be reasoned that drug-induced gastrointestinal blood loss plays a major role in ID of patients with heart failure.
An approximate estimate of undiagnosed ID cases revealed that about two thirds of ID cases may have been missed in our patient sample. The estimate is potentially conservative since it is based on the assumption that ID comes along with anaemia which is not necessarily the case in a different subset of patients. This calls for increased attention to clinical and laboratory signs of ID.
Ferritin is the most reliable indicator of iron status [10, 11]. However, since ferritin rises in inflammatory diseases, the prevalence of ID is expected to be conservative in case of inflammation. Sensitivity and specificity of the soluble transferrin receptor (STFR) were lower in this study compared to the literature; Mast et al. (1998) showed values of 92% and 84%, respectively [12]. However, their cut-off value was set at 2.8 mg/l compared to 5 mg/l in our study. Different study cohorts, cut-off values and test kits may have contributed to this discrepancy. Nevertheless, STFR may be used as an additional marker to discern ID in inflammatory disease as suggested by Mast et al. (1998) [12].
Renal failure (RF) as defined here can be causally linked to anaemia according to literature [5]. In a 2004 survey, almost half (47.7%) of patients with RF were anaemic (haemoglobin <120 g/l in women and <130 g/l in men >18 years). Regarding ID, about every tenth of our patient cases with ID showed renal failure. Seen from the perspective of renal failure (CrCl <30 ml/min.), about every second patient suffers from ID according to a large epidemiological US study by Hsu et al. (2002) [13].
Cell indices (MCV and MCHC) are well known to signal ID. In our cohort, a patient with normal indices would have a one in ten chance of having ID. Conversely, a patient with hypochromic, microcytic cell indices showed a chance of seven in ten to have an ID. Similar results have been found in an English study by Galloway et al. (2006), where 70-80% of patients with an MCV <75 fl were iron deficient [14]. In spite of its low sensitivity, MCV as marker for ID is cheap, easily implemented and therefore propagated by the WHO; on the other hand laboratory values such as mean corpuscular haemoglobin (MCH) have been reappraised lately as significantly more accurate indicators of ID compared with MCV even before anaemia is present [15].
Coding of ID in this study showed a sensitivity of 60% (ICD-10 diagnosis of ID in laboratory proven ID patients). The extent that correct coding might influence hospital revenue has yet to be analysed. When looking at the coding in the sense of quality control, coding of ID was incomplete. On one hand, improvement of coding and documentation certainly must be envisioned, although to our knowledge, literature regarding coding accuracy in ID is rare. On the other hand, looking at a diagnosis such as syncope, a recent study from Denmark with more than 5,200 patients showed a similar prevalence of correct coding for syncope of 62.7% [16], although using different diagnoses as proxy might predispose to confounding. To our knowledge, our study is the first to report the prevalence of correct ICD-10 ID coding in Switzerland.
Although the data used in this study are of good quality, there are some limitations. First, the study analyses patient data from a single site and is retrospective in its design with the concomitant limitations regarding generalisability and causality. Second, we cannot exclude a certain selection bias using data from hospitalised patients on wards of internal medicine compared to other wards such as surgery or gynaecology and control for confounding factors was not possible due to the different nature of medical problems. Third, including patients with inflammatory diseases may cause underestimation of ID prevalence, since ferritin levels increase in inflammatory response [17]. Thus, our results regarding ID prevalence are expected to be on the conservative side.
Conclusions
In our patient cohort, iron deficiency (ID) is common; every seventh patient case with iron parameters (IPs) analysed was iron deficient. According to statistical estimation about two thirds of cases with ID may not have been diagnosed. Two thirds of patients with ID were treated with intravenous iron. Based on these results further studies using a prospective design in order to optimise diagnosis and treatment of patients with ID are warranted.
Acknowledgement:Dr. Thomas Gyr und Michael Feuz from the laboratory medicine at University Hospital Basel, Jean-Philippe Bapst and Dr. Ogier Roch from Vifor for discussion of the proposal.
References
1 Looker AC, Dallman PR, Carroll MD, Gunter EW, Johnson CL. Prevalence of iron deficiency in the United States. JAMA. 1997;277(12):973–6.
2 Grondin MA, Ruivard M, Perreve A, Derumeaux-Burel H, Perthus I, Roblin J, et al. Prevalence of iron deficiency and health-related quality of life among female students. J Am Coll Nutr. 2008;27(2):337–41.
3 Blaker H. Confidence curves and improved exact confidence intervals for discrete distributions. Canad J Statist. 2000;28:783–98.
4 Team RDC. R: A language and environment for statistical computing. R Foundation for Statistical Computing. Vienna, Austria: R Development Core Team (2011); 2011.
5 Guralnik JM, Eisenstaedt RS, Ferrucci L, Klein HG, Woodman RC. Prevalence of anemia in persons 65 years and older in the United States: evidence for a high rate of unexplained anemia. Blood. 2004;104(8):2263–8.
6 Kdoqi, National Kidney F. KDOQI Clinical Practice Guidelines and Clinical Practice Recommendations for Anemia in Chronic Kidney Disease. Am J Kidney Dis. 2006;47(5 Suppl 3):S11–145.
7 Patel KV. Epidemiology of Anemia in Older Adults. Seminars in Hematology. 2008;45(4):210–7.
8 Anker SD, Comin Colet J, Filippatos G, Willenheimer R, Dickstein K, Drexler H, et al. Ferric carboxymaltose in patients with heart failure and iron deficiency. N Engl J Med. 2009;361(25):2436–48.
9 Jankowska EA, Rozentryt P, Witkowska A, Nowak J, Hartmann O, Ponikowska B, et al. Iron deficiency: an ominous sign in patients with systolic chronic heart failure. Eur Heart J. 2010;31(15):1872–80.
10 Mei Z, Cogswell ME, Parvanta I, Lynch S, Beard JL, Stoltzfus RJ, et al. Hemoglobin and ferritin are currently the most efficient indicators of population response to iron interventions: an analysis of nine randomized controlled trials. J Nutr. 2005;135(8):1974–80.
11 Thurnham DI, McCabe LD, Haldar S, Wieringa FT, Northrop-Clewes CA, McCabe GP. Adjusting plasma ferritin concentrations to remove the effects of subclinical inflammation in the assessment of iron deficiency: a meta-analysis. Am J Clin Nutr. 2010;92(3):546–55.
12 Mast AE, Blinder MA, Gronowski AM, Chumley C, Scott MG. Clinical utility of the soluble transferrin receptor and comparison with serum ferritin in several populations. Clin Chem. 1998;44(1):45–51.
13 Hsu CY, McCulloch CE, Curhan GC. Iron status and hemoglobin level in chronic renal insufficiency. J Am Soc Nephrol. 2002;13(11):2783–6.
14 Galloway MJ, Smellie WS. Investigating iron status in microcytic anaemia. BMJ. 2006;333(7572):791–3.
15 Jolobe OM. Mean corpuscular haemoglobin, referenced and resurrected. J Clin Pathol. 2011;64(9):833–4.
16 Ruwald MH, Hansen ML, Lamberts M, Kristensen SL, Wissenberg M, Olsen A-MS, et al. Accuracy of the ICD-10 discharge diagnosis for syncope. Europace. 2012.
17 Gabay C, Kushner I. Acute-phase proteins and other systemic responses to inflammation. N Engl J Med. 1999;340(6):448–54.
18 Krayenbuehl PA, Battegay E, Breymann C, Furrer J, Schulthess G. Intravenous iron for the treatment of fatigue in nonanemic, premenopausal women with low serum ferritin concentration. Blood. 2011;118(12):3222–7.
19 Favrat B. Ferric Carboxymaltose Treatment to Improve Fatigue Symptoms in Iron-deficient Non-anaemic Women of Child Bearing Age (Prefer). 2012.
20 Organization WH. Nurtritional Anemias. Report of a scientific group. WHO technical report series No. 405. Geneva: World Health Organization; 1968.
21 Levey AS, Bosch JP, Lewis JB, Greene T, Rogers N, Roth D. A more accurate method to estimate glomerular filtration rate from serum creatinine: a new prediction equation. Modification of Diet in Renal Disease Study Group. Ann Intern Med. 1999;130(6):461–70.
22 Levey AS, Coresh J, Balk E, Kausz AT, Levin A, Steffes MW, et al. National Kidney Foundation practice guidelines for chronic kidney disease: evaluation, classification, and stratification. Ann Intern Med. 2003;139(2):137–47.