Figure 1
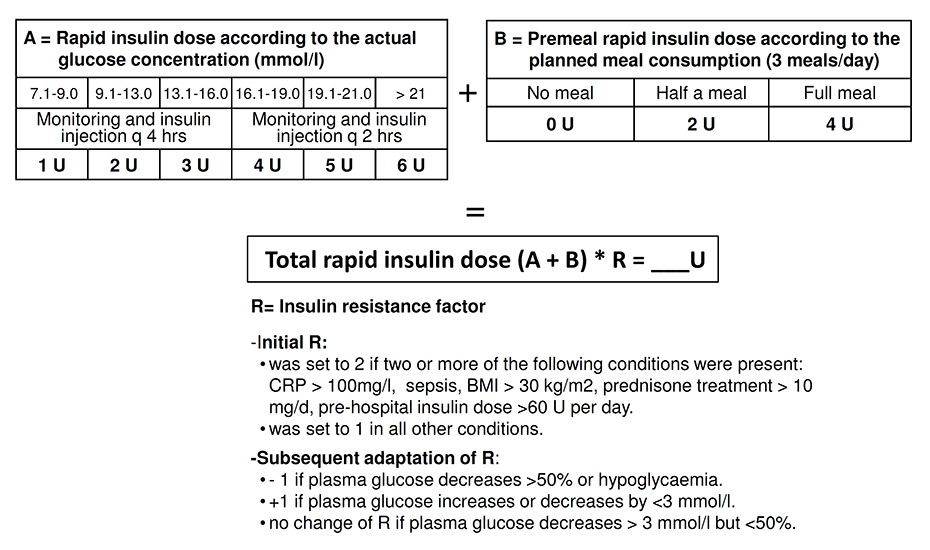
Insulin aspart dose algorithm used in the intervention group.
BMI = body mass index; CRP = C-reactive protein.
DOI: https://doi.org/10.4414/smw.2013.13808
Hyperglycaemia in hospitalised patients is associated with increased morbidity and mortality [1–5]. Although most of the literature originates from the critical care setting, the association between increased glucose levels and adverse hospital outcomes also applies to noncritical-care medical and surgical patients [2, 6]. Not only hyperglycaemia but also hypoglycaemia is a predictor of mortality [3]. Newer data from the VISEP and the Nice-Sugar trials indicate that the lowering of glucose levels in the intensive care unit (ICU) setting should not be too aggressive [1, 2, 4]. The American Diabetes Association and a recent guideline of the US Endocrine Society recommend glycaemic target levels of <7.8 mmol/l in the preprandial state in noncritically ill patients [4, 7]. However, strategies to reach this goal safely with subcutaneous (s.c.) insulin injections outside the critical care setting have not been established.
Few studies of insulin strategies to improve glycaemic control in patients on surgical or medical wards have been published [8–11]. A recent review and a meta-analysis indicate that intensive glycaemic control in noncritically ill hospitalised patients may reduce the risk of infection [12].
Nonetheless, these studies are limited, either focusing only on body mass index (BMI) to estimate insulin requirements, aiming at relatively high target glucose levels (5.6–10 mmol/l), or using a retrospective study design [8–11, 13]. BMI is not the only factor associated with insulin resistance. Additional factors such as acute illness-associated inflammation and stress hormone release may be involved [14–19]. Therefore, insulin requirements are expected to be variable in hospitalised patients and depend on the underlying medical condition, with important intraindividual differences [20]. The extent of insulin resistance is usually not known on admission, and insulin requirements may change rapidly during the course of hospitalisation.
For this reason, we aimed to evaluate the effectiveness and feasibility of an algorithm for adjustment of insulin doses to reach glycaemic targets in acutely ill patients on medical wards. The insulin doses were calculated on the basis of the actual glycaemia and an insulin resistance factor reflecting the degree of insulin resistance (factors 1 to 4, see “Intervention” below). The initial resistance factor was based on individual features of the patient and the medical condition. The factor was altered during the course of treatment on the basis of the glycaemic response to the preceding insulin dose, because the allocation of a specific factor may change during the course of the illness. The target plasma glucose range chosen in this study was 5.5–7.0 mmol/l, with 5.5 mmol/l considered to be a safe lower limit, in accordance with the guidelines of the American Diabetes Association [4].
This was a prospective, randomised, controlled, open intervention trial performed at the Departments of Medicine of the University Hospital Basel and of the Bürgerspital Solothurn, Switzerland, from January 2007 to April 2010. In both hospitals acutely ill adult patients with a wide spectrum of medical conditions were hospitalised on the medical wards. Adult patients presenting to the emergency departments of either hospital with hyperglycaemia (defined as an initial plasma glucose level of >8.0 mmol/l) and with a presumed in-hospital stay of >48 hours were included. Patients were excluded if they were immediately admitted to the ICU, had clinical signs of shock, terminal illness requiring palliative care, type 1 diabetes mellitus or known pregnancy, or refused to give informed consent. Patients were randomised either to the intensive insulin group (intervention group) or to the conventional insulin group (control group). One-to-one randomisation was used by the two participating clinics with computer-generated lists produced by an independent statistician. Allocation was concealed by the use of sealed, numbered envelopes. Blinding of investigators with regard to group assignment of patients was not feasible, but investigators were unaware of aggregate outcomes during the study.
Figure 1
Insulin aspart dose algorithm used in the intervention group.
BMI = body mass index; CRP = C-reactive protein.
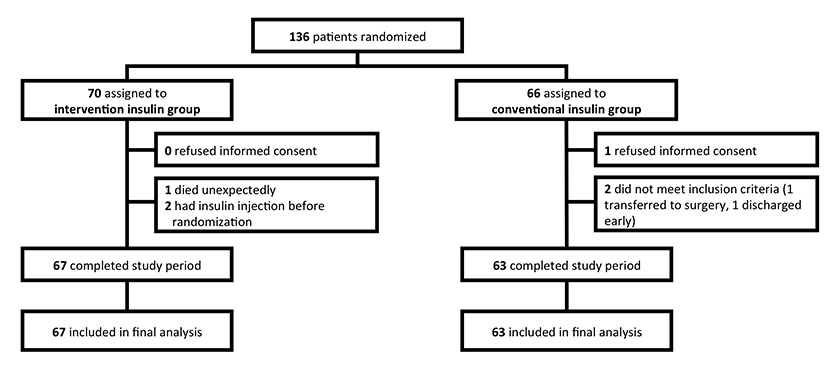
Figure 2
Trial profile.
The protocol was approved by both local ethics committees and registered in the “Current Controlled Trials Database” (ISRCTN 55224894). Written informed consent was obtained from all participants. This study adheres to the consolidated standards for the reporting of randomised-controlled trials (CONSORT) [21].
After initial glucose levels had been recorded, insulin therapy was initiated in the emergency department according to the randomisation arm. At this time all previous known diabetes medication was stopped. In the control group, patients were managed in accordance with a glucose-adapted sliding scale, with three preprandial injections of a rapid-acting insulin analogue (insulin aspart: NovoRapid®) in doses based on the plasma glucose concentration. For the first 24 hours the insulin aspart doses were equal for all patients in the control group. In patients who did not reach the target level within 24 hours, 50% of the daily rapid-acting insulin dose was administered before bedtime as a long-acting insulin analogue (insulin detemir: Levemir®). All adaptations of the insulin aspart dose on the sliding scale remained at the discretion of the treating physician.
In the intervention group, all patients were treated in accordance with a previously defined algorithm (fig. 1). In brief, an initial insulin resistance factor (1–4) was chosen on the basis of the baseline features of the patient. A factor of 2 or higher was chosen if serum C reactive protein (CRP) was >100 mg/l, or if the patient was septic or obese, treated with glucocorticoids or pretreated with insulin at doses exceeding 60 U per day. All patients without such a feature started with a resistance factor of 1. After initiation of insulin therapy, the resistance factor was modified on the basis of the course of glycaemia. Every 2 to 4 hours plasma glucose levels were measured using a bedside glucometer (Ascensia Contour®, Bayer), and insulin aspart was injected s.c. in accordance with the algorithm until the target range was reached. Thereafter plasma glucose was measured only at standardised times (see endpoints). The glucometers expressed blood glucose readings as equivalents of plasma glucose levels. If plasma glucose levels remained unchanged, or decreased by less than 3 mmol/l from one plasma glucose measurement to the next, the next higher resistance factor was assigned. If plasma glucose decreased by more than 50%, the next lower factor was assigned for continuation of insulin therapy. In the case of hypoglycaemia, insulin therapy was temporarily interrupted and continued with the next lower resistance factor. If the patient was eating, the dose of insulin aspart was increased according to the planned meal intake. If the target range was not reached within 1 day, 50% of insulin aspart dose needed in the first 24 hours was given as basal insulin (insulin detemir: Levemir®) in two divided doses in the intervention group. The study algorithm was applied whether the patient was a person with known diabetes or not. The same procedure was recommended for the control group, but it was not mandatory.
After the observation time (48 hours) all patients were treated at the discretion of the treating physician.
The primary endpoint was defined as the time in the glycaemic target range (5.5–7.0 mmol/l) during the first 48 hours after admission to the emergency room. The study was designed to show the safety and feasibility of the protocol. Therefore, the observation time was limited to 48 hours. Prespecified consecutive plasma glucose measurements were linearly interpolated to calculate the time within the glycaemic target range. To avoid bias due to different numbers of glucose measurements in the two groups, only measurements at standardised times (7:00, 11:30, 17:00, 22:30 and 2:00) as well as the measurements at study entry and at hospital discharge (if within 48 hours) were used. When patients were discharged before the end of the 48-hour study period, the last available glucose value was carried forward. Time to reach the target range, and the following safety outcomes were secondary endpoints: mean potassium levels, rates of hypokalaemia defined as a potassium level <3.6 mmol/l at days 1 and 2, and rates of mild and severe hypoglycaemia defined as plasma glucose levels of ≤3.8 mmol/l and <2.5 mmol/l, respectively.
When mild hypoglycaemia occurred 10 to 20 g of glucose was administered orally. Plasma glucose was measured after 15, 30 and 60 minutes and insulin therapy was restarted if plasma glucose exceeded 5 mmol/l.
Admission laboratory parameters were measured using automated standard laboratory techniques. Glycated haemoglobin (HbA1c) values were measured using high-performance liquid chromatography (HPLC) and Diabetes Control and Complications Trial (DCCT) standardisation.
To estimate the required sample size we used data from previous studies [22–25]. Assuming a mean time in target of 20 ± 10 hours (mean ± standard deviation [SD]) during the first 24 hours for the control insulin group, a total of 120 patients (60 patients per group) were required to detect an increase in the time in target of 30% in the intervention group (i.e. from 20 to 26 hours) with a two-sided α-level of 5% and power of 90%. To account for a possible dropout rate of around 10%, we decided to stop enrolment after a total of 130 patients had been included.
The primary statistical analysis for our primary endpoint (time in glucose target range) was a two-sided Students t-test including all randomised patients in accordance with the intention-to-treat principle. Normal distribution of this outcome was assessed graphically. We also modelled the influence of our intervention on the primary endpoint in a multivariate linear regression model, adjusted for the predefined main predictors for insulin requirements (gender, BMI, glucocorticoid use and previously known diabetes). To test the possibility that specific baseline characteristics would modify the effect of the intervention on the primary outcome, we included interaction terms in the multivariate linear regression model. Because the rate of early discharge of patients was only 5.4%, no additional sensitivity analysis was performed for outpatients. Analysis of secondary endpoints included calculation of Kaplan Meier curves for graphical display of time to reach the target range. We censored patients who did not reach the target glucose range at the time of their last glucose measurement, and the two groups were compared with a log-rank test. Other binary secondary endpoints were compared with X2-tests. Results are means ± 1 SD.
All statistical analyses were performed with STATA 9.2 (Stata Corp, College Station, Tex). All testing was two-tailed and p-values less than 0.05 were considered to indicate statistical significance.
| Table 1:Baseline characteristics. | |||
| Intervention group (n = 67) | Control group (n = 63) | ||
| Demographics | |||
| Age (years) | 72.4 ± 11.7 | 74.2 ± 8.8 | |
| Gender (m:f) | 38:29 | 29:34 | |
| Diabetes history | |||
| Previously known diabetes (n, %) | 54 (80.6%) | 50 (79.4%) | |
| Diabetes duration (years) | 9.9 ± 7.4 | 11.1 ± 8.5 | |
| Insulin on admission (U) | 37.3 ± 22.3 | 43.0 ± 32.2 | |
| Glycated haemoglobin (mmol/mol;%) | 59 ± 30 (8.1 ± 2.0) | 59 ± 30 (8.1 ± 2.0) | |
| Personal history | |||
| Body weight (kg) | 81.7 ± 17.5 | 83.2 ± 17.0 | |
| Height (cm) | 168 ± 8.9 | 167 ± 8.7 | |
| Body mass index (kg/m2) | 28.0 ± 7.4 | 29.3 ± 6.6 | |
| Waist (cm) | 109.3 ± 12.8 | 112 ± 14.5 | |
| Clinical parameters | |||
| Body temperature (°C) | 37.1 ± 1.1 | 37.3 ± 1.1 | |
| Glucocorticoid use at home | |||
| Use of glucocorticoids (n, %) | 10 (14.9%) | 11 (17.5%) | |
| Dosage of prednisone (mg) | 12.1 ± 11.2 | 10.5 ± 11.0 | |
| Initial plasma analysis | |||
| Plasma glucose (mmol/l) | 13.1 ± 4.9 | 13.8 ± 5.7 | |
| C-reactive protein (mg/l) | 57.4 ± 81.9 | 50.4 ± 80.9 | |
| White blood cell count (1x10⁹/l) | 13.1 ± 12.0 | 10.4 ± 5.1 | |
| Creatinine (μmol/l) | 113 ± 86.1 | 119 ± 73.5 | 0.66 |
| Potassium (mmol/l) | 4.1 ± 0.6 | 4.0 ± 0.7 | 0.92 |
| Table 2:Primary, secondary and safety outcomes and insulin use. | ||||
| Intervention group (n = 67) | Control group (n = 639) | Difference (95% confidence interval) | p-value | |
| Primary outcome | ||||
| Time in glucose target* (h) | 22.5 ± 10.5 | 13.0 ± 14.7 | 9.5 (95% CI 5.1, 13.9) | <0.0001 |
| Secondary outcome | ||||
| Time to reach glucose target* (h) | 11.8 ± 9.4 | 24.3 ± 18.4 | –12.5 (95% CI –17.5, –7.5) | <0.0001 |
| Safety outcomes | ||||
| Hypokalaemia (potassium <3.6 mmol/l) % (n) | 22.4% (n = 15) | 23.8% (n = 15) | –1.4% (95% CI –15.9, 13.1) | 0.84 |
| Mild hypoglycaemia (glucose <3.8 mmol/l) % (n) | 19.4% (n = 13) | 6.3% (n = 4) | 13.5% (95% CI 1.8, 24.3) | 0.03 |
| Severe hypoglycaemia (glucose <2.5 mmol/l) % (n) | 1.4% (n = 1) | 0% (n = 0) | 1.5 (95% CI –1.4, 4.4) | 0.33 |
| Insulin use in 48 hours (U) | ||||
| Mean insulin aspart | 64.7 ± 37.9 | 36.8 ± 29.4 | 27.9 (95% CI 44.8, 57.5) | <0.0001 |
| Total insulin aspart | 4331 | 2316 | 0.013 | |
| Mean insulin detemir | 8.8 ± 11.1 | 7.9 ± 11.2 | 0.9 (95% CI 6.5, 10.3) | 0.64 |
| Total insulin detemir | 591 | 499 | 0.56 | |
| *The glucose target was 5.5–7.0 mmol/l | ||||
A total of 130 patients were enrolled, 67 in the intervention group and 63 in the control group (fig. 2). Their mean age was 73 years, mean diabetes duration 10.5 years and mean HbA1c on admission 59 mmol/mol (8.1%). The two groups were well balanced with respect to baseline characteristics and comorbidities, with no statistical differences between groups (table 1). A total of 81% of the patients in the intervention group and 79% of the patients in the control group had previously known diabetes (p = 0.95). Eight patients in the intervention group and nine patients in the control group were newly diagnosed as patients with diabetes. There was no difference in BMI, use of glucocorticoids, initial plasma glucose levels, serum CRP, creatinine and potassium between the two groups.
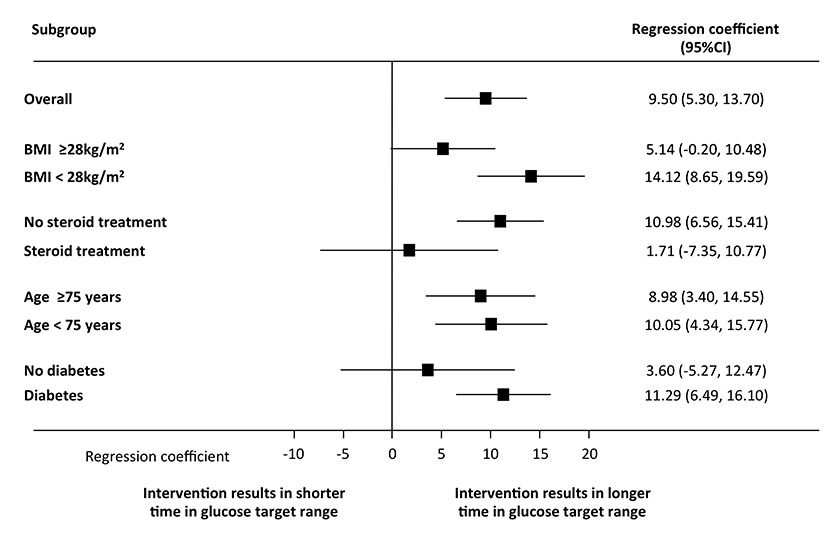
Figure 3
Effect of the intervention on time in glucose target range (5.5–7.0 mmol/l) overall and in subgroups. All models of multivariate analyses were adjusted for age, gender, body mass index (BMI), glucocorticoid use and previously known diabetes.
CI = confidence interval.
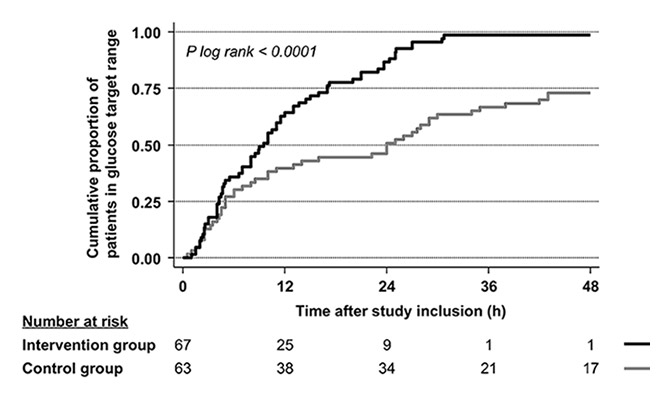
Figure 4
Cumulative proportion of patients in the two groups reaching the glucose target range after inclusion in the study.
The intervention group remained longer in the target glucose range as compared with the control group (22.5 ± 10.5 hours vs 13.0 ± 14.7 hours) with a mean difference of 9.5 hours (95% confidence interval [CI] 5.1, 13.9) (table 2). The median time to reach the target range was significantly shorter in the intervention group than in the control group (9.5 [95%CI 6.6, 11.5] vs 24.0 [95%CI 10.0, 29.0] hours, p log rank <0.0001). Figure 4 displays the time to reach the target glucose range as a Kaplan-Meier curve for each randomisation arm.
There was no difference in serum potassium and rates of potassium levels <3.6 mmol/L between the two groups. There were more mild (<3.8 mmol/l) hypoglycaemic episodes in the control group than in the intervention group (19.4% vs 6.3%, difference 13.5% [95%CI 1.8, 24.3]). There was one severe (<2.5 mmol/l) hypoglycaemic episode. This occurred in the intervention group.
Multivariate linear regression analysis adjusted for age, previously known diabetes, BMI and glucocorticoid use demonstrated an association of the intervention with the time in the glycaemic target range (linear regression coefficient 9.5 hours [95%CI 5.3, 13.7], p <0.0001). This effect was also found in subgroups stratified according to a median BMI of 28 kg/m2 and a median age of 75 years (fig. 3). The effect was no longer significant for patients with corticosteroid treatment and patients without pre-existing diabetes.
The total use of rapid-acting insulin analogue was 4331 U in the intervention group compared with 2316 U in the control group (p = 0.013; table 2). Mean insulin aspart use during the study period was 64.7 ± 37.9 U in the intervention group compared with 36.8 ± 29.4 U in the control group (p <0.0001). Thirty patients in the intervention group received long-acting insulin (total 591 U of insulin detemir during the whole intervention period) compared with 36 patients in the control group (total 499 U of insulin detemir during the whole intervention period; p = 0.56).
Insulin detemir had no influence on time in target. The main reason for the longer time in target was insulin aspart. In both study groups, in patients being treated with insulin detemir the time in the glycaemic target range was shorter than in the groups not being treated with detemir (in the control group 349 minutes with insulin detemir vs 1359 minutes without detemir; In the intervention group 1104 minutes with insulin detemir vs 1551.5 minutes without).
There was a strong association observed in all patients between the number of the resistance factor established on admission and the total amount of insulin needed to treat the patient during the first 48 hours (regression coefficient 16.5; [95%CI 5.9, 27.1], p <0.01). The mean total amount of insulin used increased from 50 U in patients with resistance factor 0 to 104 U in patients with resistance factor 3.
This is the first study to evaluate the feasibility and safety of a new s.c. insulin algorithm in noncritically ill hyperglycaemic patients admitted to general medical wards that included an anticipated insulin resistance factor for the calculation of insulin doses. The treatment algorithm proved to be effective in producing earlier and sustained correction of initial hyperglycaemia without apparent detrimental effects on patient safety. Although several newer protocols for tight glycaemic control in the ICU have been published [26-29], few studies from medical or surgical wards outside the ICU have been reported since 2007 [8–11, 13]. Two recent studies compared the use of a basal and bolus insulin schedule with a sliding scale in surgical [10] and medical patients [11]. In contrast to the RABBIT 2 trial, our study used the same basal insulin recommendations in both groups and included not only BMI but also insulin resistance factors based on individual predisposition and on the acute illness. In our intervention group, which had similar mean admission glucose levels (13.1 mmol/l) to those in RABBIT 2 (12.7 mmol/l), our mean and fasting glucose levels during the trial tended to be lower than in RABBIT 2 (7.69 mmol/l vs 9.2 mmol/l, 7.68 mmol/l vs 8.2 mmol, respectively). Unfortunately, the population in the RABBIT 2 study was slightly older, insulin naïve and glucocorticoid free.
Even in septic patients the algorithm was effective. Importantly, we found that the number of resistance factors was significantly associated with the total amount of insulin needed to correct hyperglycaemia. This indicates that consideration of these factors is clinically meaningful and suggests that the use of a resistance factor for the calculation of expected insulin doses helps to reach target levels earlier and to keep them longer within recommended ranges.
The risk of hypoglycaemia in the intervention group was comparable to data found in the literature [22, 23, 25, 30, 31]. Only in the RABBIT 2 trial (similar number of included patients but one prefixed measurement point fewer) were rates of hypoglycaemia (plasma glucose <3.3 mmol/l) three times lower than those in our intervention group.
However, as outlined above, patients in this trial tended to have lower mean plasma glucose levels [11]. On the other hand, the study by Meyer at al showed hypoglycaemic episodes in 30% to 35% of patients in spite of higher mean plasma glucose levels than in our study (8.8 mmol/l during the first four days) [9].
Limitations of our study are the relatively small number of patients included, and the fact that the number of plasma glucose measurements was slightly higher in the intervention than in the control group. However, the frequency and the dosage of the insulin injections were the main differences between the groups. Significantly more bolus insulin was used in the intervention group than in the control group. Therefore, we believe that the insulin algorithm was the main reason for the improved glycaemic outcome. Because a double-blind procedure was not feasible, the study was designed as an open intervention trial. Hence, “contamination” of the control with the intervention group could have occurred. However, as a conservative bias this favours the null hypothesis.
In summary, the present intensive insulin algorithm including BMI, amount of insulin at home, laboratory signs of inflammation, sepsis and glucocorticoid use as resistance factors, resulted in improved glycaemic control compared with conventional treatment with rigid doses of insulin, without apparent detrimental effects on patient safety such as hypoglycaemia or hypokalaemia. Because standardised procedures may prove to be cost-effective and generally increase patient safety, this algorithm should be evaluated in a larger context and with “hard” endpoints in noncritically ill patients.
Acknowledgement:We are grateful to the local physicians, caring staff and patients who participated in this study. We thank the staff of the emergency departments and the medical clinics of the University Hospital Basel and the Bürgerspital Solothurn for their helpful assistance.
1 Brunkhorst FM, Engel C, Bloos F, et al. Intensive insulin therapy and pentastarch resuscitation in severe sepsis. N Engl J Med. 2008;358:125–39.
2 Finfer S, Chittock DR, Su SY, et al. Intensive versus conventional glucose control in critically ill patients. N Engl J Med. 2009;360:1283–97.
3 Svensson AM, McGuire DK, Abrahamsson P, Dellborg M. Association between hyper- and hypoglycaemia and 2 year all-cause mortality risk in diabetic patients with acute coronary events. Eur Heart J. 2005;26:1255–61.
4 Standards of medical care in diabetes – 2012. Diabetes Care. 2012;35(Suppl 1):S11–63.
5 Van den Berghe G, Wilmer A, Hermans G, et al. Intensive insulin therapy in the medical ICU. N Engl J Med. 2006;354:449–61.
6 Schuetz P, Jones AE, Howell MD, et al. Diabetes is not associated with increased mortality in emergency department patients with sepsis. Ann Emerg Med. 58:438–44.
7 Umpierrez GE, Hellman R, Korytkowski MT, et al. Management of hyperglycemia in hospitalized patients in non-critical care setting: an endocrine society clinical practice guideline. J Clin Endocrinol Metab. 2012;97:16–38.
8 Buchs AE, Bloemers R, Shiloah E, et al. Feasibility and safety of multiple daily insulin injections in general medicine wards. Eur J Intern Med. 2009;20:435–9.
9 Meyer C, Boron A, Plummer E, Voltchenok M, Vedda R. Glulisine versus human regular insulin in combination with glargine in noncritically ill hospitalized patients with type 2 diabetes: a randomized double-blind study. Diabetes Care. 33:2496–501.
10 Umpierrez GE, Smiley D, Jacobs S, et al. Randomized Study of Basal-Bolus Insulin Therapy in the Inpatient Management of Patients With Type 2 Diabetes Undergoing General Surgery (RABBIT 2 Surgery). Diabetes Care. 34:256–61.
11 Umpierrez GE, Smiley D, Zisman A, et al. Randomized study of basal-bolus insulin therapy in the inpatient management of patients with type 2 diabetes (RABBIT 2 trial). Diabetes Care. 2007;30:2181–6.
12 Murad MH, Coburn JA, Coto-Yglesias F, et al. Glycemic control in non-critically ill hospitalized patients: a systematic review and meta-analysis. J Clin Endocrinol Metab. 2012;97:49–58.
13 Patel GW, Roderman N, Lee KA, et al. Sliding scale versus tight glycemic control in the noncritically ill at a community hospital. Ann Pharmacother. 2009;43:1774–80.
14 Mizock BA. Blood glucose management during critical illness. Rev Endocr Metab Disord. 2003;4:187–94.
15 Festa A, D’Agostino R, Jr., Williams K, et al. The relation of body fat mass and distribution to markers of chronic inflammation. Int J Obes Relat Metab Disord. 2001;25:1407–15.
16 Forouhi NG, Sattar N, McKeigue PM. Relation of C-reactive protein to body fat distribution and features of the metabolic syndrome in Europeans and South Asians. Int J Obes Relat Metab Disord. 2001;25:1327–31.
17 Lee WY, Park JS, Noh SY, et al. C-reactive protein concentrations are related to insulin resistance and metabolic syndrome as defined by the ATP III report. Int J Cardiol. 2004;97:101–6.
18 Wajchenberg BL. Subcutaneous and visceral adipose tissue: their relation to the metabolic syndrome. Endocr Rev. 2000;21:697–738.
19 Marques-Vidal P, Bastardot F, von Kanel R, et al. Association between circulating cytokine levels, diabetes and insulin resistance in a population-based sample (CoLaus study). Clinical Endocrinology. 2013;78:232–41.
20 Timper K, Donath MY. Diabetes mellitus Type 2 – the new face of an old lady. Swiss Med Wkly. 2012;142:w13635.
21 Moher D, Schulz KF, Altman DG. The CONSORT statement: revised recommendations for improving the quality of reports of parallel-group randomised trials. Lancet. 2001;357:1191–4.
22 Plank J, Blaha J, Cordingley J, et al. Multicentric, randomized, controlled trial to evaluate blood glucose control by the model predictive control algorithm versus routine glucose management protocols in intensive care unit patients. Diabetes Care. 2006;29:271–6.
23 Kanji S, Singh A, Tierney M, Meggison H, McIntyre L, Hebert PC. Standardization of intravenous insulin therapy improves the efficiency and safety of blood glucose control in critically ill adults. Intensive Care Med. 2004;30:804–10.
24 Goldberg PA, Siegel MD, Sherwin RS, et al. Implementation of a safe and effective insulin infusion protocol in a medical intensive care unit. Diabetes Care. 2004;27:461–7.
25 Zimmerman CR, Mlynarek ME, Jordan JA, Rajda CA, Horst HM. An insulin infusion protocol in critically ill cardiothoracic surgery patients. Ann Pharmacother. 2004;38:1123–9.
26 Newton CA, Smiley D, Bode BW, et al. A comparison study of continuous insulin infusion protocols in the medical intensive care unit: computer-guided vs. standard column-based algorithms. Journal of Hospital Medicine: an official publication of the Society of Hospital Medicine 2010;5:432–7.
27 Amrein K, Ellmerer M, Hovorka R, et al. Hospital glucose control: safe and reliable glycemic control using enhanced model predictive control algorithm in medical intensive care unit patients. Diabetes Technol Ther; 12:405–12.
28 Kulnik R, Plank J, Pachler C, et al. Evaluation of implementation of a fully automated algorithm (enhanced model predictive control) in an interacting infusion pump system for establishment of tight glycemic control in medical intensive care unit patients. J Diabetes Sci Technol. 2008;2:963–70.
29 Hoekstra M, Vogelzang M, Verbitskiy E, Nijsten MW. Health technology assessment review: Computerized glucose regulation in the intensive care unit – how to create artificial control. Crit Care. 2009;13:223.
30 Samann A, Muhlhauser I, Bender R, Kloos C, Muller UA. Glycaemic control and severe hypoglycaemia following training in flexible, intensive insulin therapy to enable dietary freedom in people with type 1 diabetes: a prospective implementation study. Diabetologia. 2005;48:1965–70.
31 Taylor BE, Schallom ME, Sona CS, et al. Efficacy and safety of an insulin infusion protocol in a surgical ICU. J Am Coll Surg. 2006;202:1–9.
The trial has been registered with www.clinicaltrials.gov (number NCT00353431).
Authors’ contributions:RT, BM and UK had the idea, wrote the protocol and initiated the study. RT managed the trial and collected data. RT and PS performed the statistical analyses and drafted the manuscript. UK, BM, RS and ST contributed to the writing of the manuscript. All authors approved the final version.
Funding / potential competing interests: No commercial sponsor had any involvement in design and conduct of this study, namely collection, management, analysis, and interpretation of the data; and preparation, decision to submit, review, or approval of the manuscript. RT received an unrestricted grant from Novo Nordisk to cover laboratory expenses of the study and to attend meetings and to fulfil speaking engagements. All other authors declare that they have no competing interests.