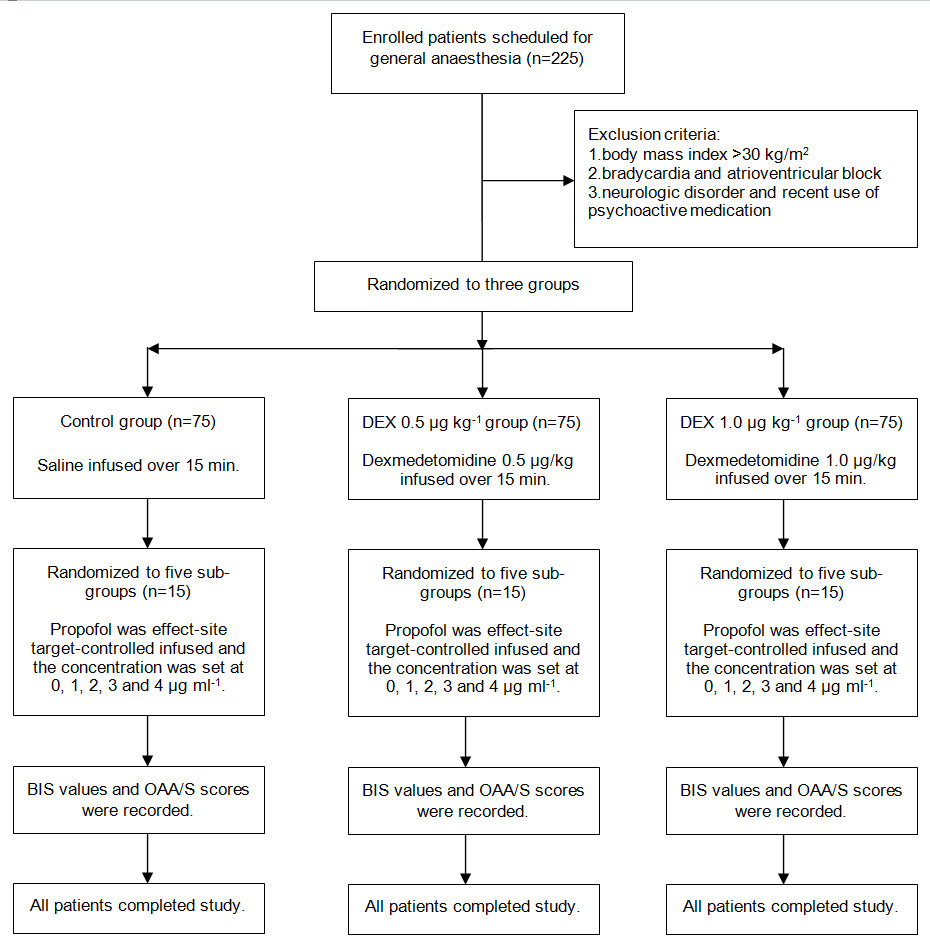
Figure 1
Disposition of the study patients.
DOI: https://doi.org/10.4414/smw.2013.13762
Dexmedetomidine is an α2-adrenegic agonist, with sedative, analgesic and sympatholytic properties [1, 2]. It has been demonstrated that dexmedetomidine is an efficacious and safe adjuvant in general anaesthesia [3, 4]. When dexmedetomidine is administrated in propofol anaesthesia, it can exert an anaesthetic-sparing effect and stabilise intraoperative haemodynamics [5–7].
The bispectral index (BIS) is a derived multifactorial electroencephalographic (EEG) parameter in which the outcome of the EEG analysis is represented a unitless value between 0 (isoelectric EEG) and 100 (alert and oriented). BIS monitoring is used by clinical anaesthetists to titrate anaesthetic agents in order to maintain loss of consciousness (LOC) and prevent intraoperative awareness [8, 9]. However, the performance of BIS for detecting LOC appears to depend on the anaesthetic regimen used. For example, BIS is considered to be a reliable method of monitoring sedative depth and can accurately predict LOC in propofol anaesthesia, but not nitrous oxide and ketamine anaesthesia. Furthermore, BIS values for detecting LOC change when other anaesthetics are used in combination with propofol [10–15].
Dexmedetomidine, acting on the α2-adrenoceptors in the locus coeruleus, produces physiological sleep-like phenomena in the EEG and a characteristic rousable sedation, which is markedly different from that of other sedatives such as the gamma-aminobutyric acid (GABA) agonist propofol [16–18]. It is unclear whether BIS can accurately predict LOC and whether BIS values predicting LOC change when dexmedetomidine and propofol are coadministrated. Recently, Kasuya et al. [19] showed that BIS could accurately predicte LOC with dexmedetomidine monoinfusion, but the cut-off BIS values for detecting LOC were lower than with propofol monoinfusion. We hypothesised that adjunctive dexmedetomidine changes BIS values for detecting LOC during propofol administration. The purpose of our study was to assess the effects of dexmedetomidine on the performance of BIS for detecting LOC during propofol administration.
The study was approved by the ethics committee of the Affiliated People’s Hospital of Jiangsu. Written informed consent was obtained from 225 patients with ASAⅠor Ⅱ, aged 20–50 years and weighing 41–68 kg, who were scheduled for general anaesthesia. Exclusion criteria included body mass index >30 kg/m2, bradycardia, atrioventricular block, neurologic disorder and recent use of psychoactive medication, including alcohol.
Figure 1
Disposition of the study patients.
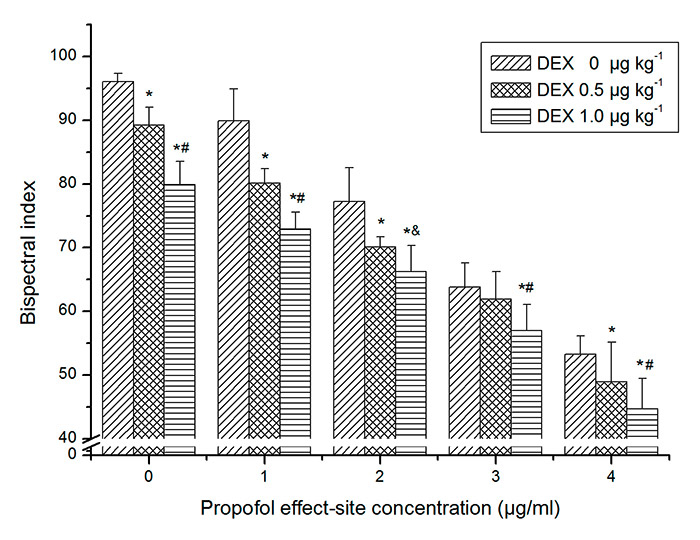
Figure 2
The effects of dexmedetomedine on bispectral index at every propofol effect-site concentration. Bars represent mean ± SD. * Significant differences compared with control group at the same propofol effect-site concentration (p <0.01). #Significant differences between dexmedetomidine (DEX) 0.5 and 1.0 μg kg–1 (p <0.01). &Significant differences between dexmedetomidine 0.5 and 1.0 μg kg–1 (p <0.05).
Atropine 0.5 mg was injected intramuscularly as preanaesthetic medication. An 18G catheter was inserted into large forearm vein for fluid and drug administration. Lactated Ringer’s solution was infused at a rate of 10 ml kg–1 h–1 and oxygen was delivered via facemask with a flow of 5 L min–1. Heart rate, noninvasive blood pressure and pulse oxygen saturation were monitored at 3-minute intervals using Datex-Ohmeda S/5 monitor. BIS was derived from the frontal electroencephalogram and calculated by an Aspect VistaTMmonitor (version 3.2, Aspect Medical System, Inc.) using BIS sensor electrodes. Patients were randomly allocated to three groups according to computer-generated random codes that were enclosed in sequentially numbered opaque envelopes: a control group (dexmedetomidine 0 µg kg–1), a dexmedetomidine 0.5 µg kg–1 group and a dexmedetomidine 1.0 µg kg–1 group (75 subjects in each) (fig. 1). Dexmedetomidine 0.5 and 1.0 µg kg–1 were intravenously infused for 15 minutes in the 0.5 and 1.0 µg kg–1groups, respectively, and saline was infused in control group. After dexmedetomidine and saline infusion were completed, propofol was administered as an effect-site target-controlled infusion (TCI). Patients in each group were randomly allocated to five subgroups based on computer-generated random codes that were enclosed in other sequentially numbered opaque envelopes: a P0subgroup, a P1subgroup, a P2subgroup, a P3subgroup, a P4subgroup (15 subjects in each), for which the effective-site concentration of propofol was set at 0, 1, 2, 3 and 4 μg ml–1, respectively (fig. 1). After patients entered into operating room, the two allocation envelopes were opened by one anaesthetist who knew which group and sub-group the patients were assigned to and administered the corresponding dose of dexmedetomidine and concentration of propofol. The syringe pump and TCI pump were shielded from another anaesthetist who did not know the grouping and recorded the BIS values and Observer’s Assessment of Alertness/Sedation (OAA/S) scale (table 1) three minutes after propofol administration. Patients were considered to be conscious if their OAA/S scores were 5, 4, or 3 and considered to be unconscious at scores of 2, 1, and 0. Propofol was administered using a commercially available TCI pump (the Slgo CP-600 Infusion System, China), which uses Marsh’s pharmacokinetic model. This system displays predicted plasma and effect-site concentration. The effect-site concentration of propofol was computed to yield a time-to-peak effect of 1.6 minutes after bolus injection and clinically confirmed by Struys et al. [20]. Therefore, we were able to obtain a steady-state effect-site concentration for propofol when recording BIS values and OAA/S scores. If mean arterial pressure was more than 130% or less than 70% of baseline value or systolic pressure was less than 90 mm Hg, urapidil and phenylephrine were administered. When heart rate was less than 55 bpm, atropine was used. Respiratory depression was treated with assisted ventilationvia facemask.
The primary endpoint of the study was BIS values for detecting LOC and the secondary endpoint was the effect-site concentration of propofol for LOC.
Data was analysed using SPSS statistical package version 17.0 for Microsoft Windows. The significance level was set at 5% unless otherwise reported. BIS values were subjected to two-way analysis of variance (ANOVA; propofol × dexmedetomidine). When the ANOVA revealed a significant main effect or interaction between the main factors, differences in subgroup means were tested using Fisher’s protected least-significant difference test. Spearman rank-order correlation was used for the correlation analysis of BIS and OAA/S. The ability of BIS to detect LOC for each group was evaluated using prediction probability (Pk), as developed by Smith et al. [21]. A Pk of 1 would mean that BIS can predict anaesthetic depth perfectly. A Pk of 0.5 would mean BIS is useless for measuring anaesthetic depth. By applying Probit analysis, the BIS values and the effect-site concentration of propofol at which 50% (ED50) and 95% (ED95) of patients lost consciousness for each group were calculated. EC50 and EC95 represented the effect-site concentration of propofol at which 50% and 95% of patients lost consciousness. BIS50 and BIS95 represented the BIS values at which 50% and 95% of patients lost consciousness. Receiver operating characteristic (ROC) curve analysis was used to evaluate the capacity of BIS to predict LOC and obtain the cut-off BIS values for LOC at which the sum of sensitivity and specificity were highest. In addition, the cut-off BIS values resulting in 100% sensitivity were calculated. A Student t-test with Bonferroni correction was used to evaluate whether the correlation coefficient and area under ROC curve, Pk and ED50 and ED95were different between groups. The significance level for this analysis was set at 0.0167.
| Table 1:Responsiveness scores of the modified Observer’s Assessment of Alertness/Sedation scale. | |
| Score | Response |
| 5 | Responds readily to name spoken in normal tone |
| 4 | Lethargic response to name spoken in normal tone |
| 3 | Responds only after name is called loudly or repeatedly |
| 2 | Responds only after mild prodding or shaking |
| 1 | Does not respond to mild prodding or shaking |
| Does not respond to noxious stimulus | |
| Table 2: Demographic characteristics of the study groups and subgroups. | |||||||
| Group | Subgroup | Male/female | Age ± SD (years) | Weight ± SD (kg) | |||
| Group | Subgroup | Group | Subgroup | Group | Subgroup | ||
| Dexmedetomidine 1.0 µg kg–1 | P | 33/42 | 8/7 | 37 ± 10 | 38 ± 10 | 55 ± 8 | 57 ± 10 |
| P1 | 6/9 | 36 ± 11 | 54 ± 8 | ||||
| P2 | 5/10 | 39 ± 10 | 54 ± 8 | ||||
| P3 | 8/7 | 35 ± 11 | 53 ± 10 | ||||
| P4 | 6/9 | 34 ± 9 | 56 ± 7 | ||||
| Dexmedetomidine 0.5 µg kg–1 | P | 40/35 | 6/9 | 34 ± 10 | 34 ± 10 | 54 ± 6 | 51 ± 6 |
| P1 | 8/7 | 33 ± 10 | 52 ± 7 | ||||
| P2 | 9/6 | 36 ± 7 | 54 ± 9 | ||||
| P3 | 8/7 | 31 ± 10 | 56 ± 3 | ||||
| P4 | 9/6 | 34 ± 9 | 52 ± 7 | ||||
| Control | P | 40/35 | 9/6 | 37 ± 7 | 36 ± 11 | 54 ± 8 | 50 ± 7 |
| P1 | 10/5 | 38 ± 8 | 57 ± 5 | ||||
| P2 | 7/8 | 42 ± 6 | 54 ± 6 | ||||
| P3 | 7/8 | 33 ± 7 | 56 ± 8 | ||||
| P4 | 7/8 | 35 ± 7 | 48 ± 5 | ||||
| P, P1, P2, P3, P4 = effective-site propofol concentration of 0, 1, 2, 3, 4 µg ml–1. | |||||||
The demographics of the 225 patients in the three groups and fifteen subgroups are shown in table 2. There were no relevant demographic differences found between groups or subgroups (p >0.05).
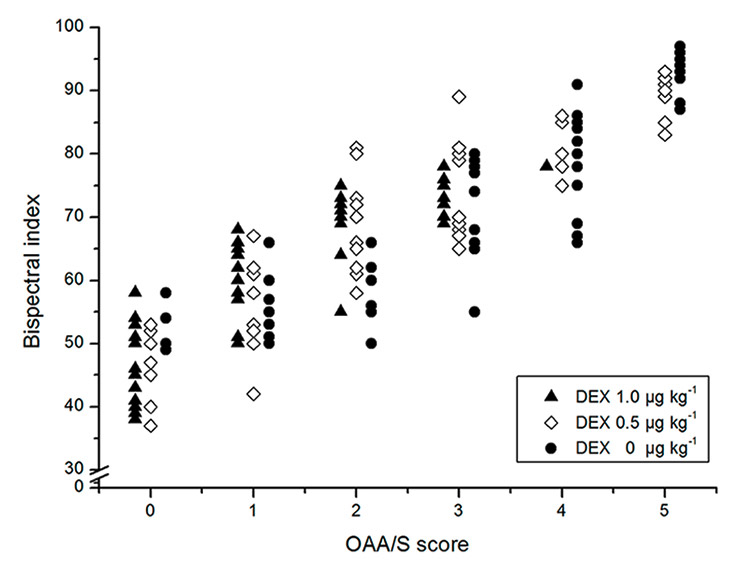
Figure 3
Raw data for the bispectral index at every Observer’s Assessment of Alertness/Sedation Scale score. (DEX = dexmedetomidine.)
As expected, propofol and dexmedetomidine significantly decreased BIS. A significant propofol × dexmedetomidine interaction indicated that dexmedetomidine exerted an antagonistic effect on BIS with propofol (p <0.01). Post hoc analysis indicated that dexmedetomidine 0.5 and 1.0 µg kg–1 decreased BIS values at every propofol concentration (fig. 2).
Scatter plots of BIS values and OAA/S scores in all groups are shown in figure 3. In all groups, a monotonic decrease in BIS was observed at decreasing OAA/S levels. The correlation coefficients (with standard errors) of BIS and OAA/S in the three groups were 0.931(0.012), 0.903(0.025) and 0.939(0.013), respectively. There were no significant differences in correlation coefficient between the groups (p >0.0167).
The ability of BIS to predict LOC as represented by the Pk values is shown in table 3. Pk values were similar in all groups (p >0.0167).
The relationships between the probability of LOC and effect-site concentration or BIS are shown in figures 4 and 5. The EC50values of the dexmedetomidine 0.5 and 1.0 µg kg–1 groups were significantly lower than that of the control group, and the EC50of the dexmedetomidine 1.0 µg kg–1 group was significantly lower than that of the dexmedetomidine 0.5 µg kg–1 group (p <0.0167). The BIS50values of the dexmedetomidine 0.5 and 1.0 µg kg–1 groups significantly increased compared with that of the control group (p <0.0167) and there was no difference in BIS50between the dexmedetomidine 0.5 and 1.0 µg kg–1 groups (p >0.0167) (table 4).
Figure 6 shows ROC curves for BIS to detect LOC. There was no significant difference in ROC curve areas between groups (p >0.0167) (table 3). Table 5 shows the cut-off BIS values for detecting LOC at which the sum of the sensitivity and specificity were the highest, and the cut-off values at which sensitivity was 100%.
| Table 3:Area under the receiver operating characteristic (ROC) curve and prediction probability (Pk) for loss of consciousness (LOC) detected by bispectral index (BIS) in the three groups. | ||
| Group | ROC curve area (standard error) | Pk for LOC (standard error) |
| Control Dexmedetomidine 0.5 μg kg–1 Dexmedetomidine 1.0 μg kg–1 | 0.983 (0.012) 0.926 (0.028) 0.979 (0.012) | 0.983 (0.012) 0.926 (0.028) 0.979 (0.012) |
| Table 4:Bispectral index and effect-site concentration of propofol at which 50% and 95% of patients lost consciousness. BIS50 (95%CI)/BIS95 and EC50 (95%CI)/EC95 for LOC in three groups. | ||
| Group | BIS50 (95%CI) / BIS95 | EC50 (95%CI) / EC95 |
| Control Dexmedetomidine 0.5 μg kg–1 Dexmedetomidine 1.0 μg kg–1 | 63.2(60.3–66.9)/55.9 71.1(67.6–74.5)/58.5 * 71.4(68.9–73.7)/64.8 * | 3.03(2.70–3.40)/3.65 1.97(1.60–2.34)/3.32 * 1.23(0.85–1.59)/2.54 *# |
| BIS50, BIS95 = bispectral index at which 50% and 95% of patients lost consciousness; EC50, EC95 = effect-site concentration of propofol at which 50% and 95% of patients lost consciousness; 95%CI = 95% confidence interval. * Significant difference compared with control group (p <0.0167). # Significant difference between dexmetomidine 0.5 μg kg–1 and 1.0 μg kg–1 group (p <0.0167). | ||
The current study demonstrated that the ability of BIS to predict LOC was not influenced by dexmedetomidine during propofol administration, but BIS values were enhanced at the moment of LOC.
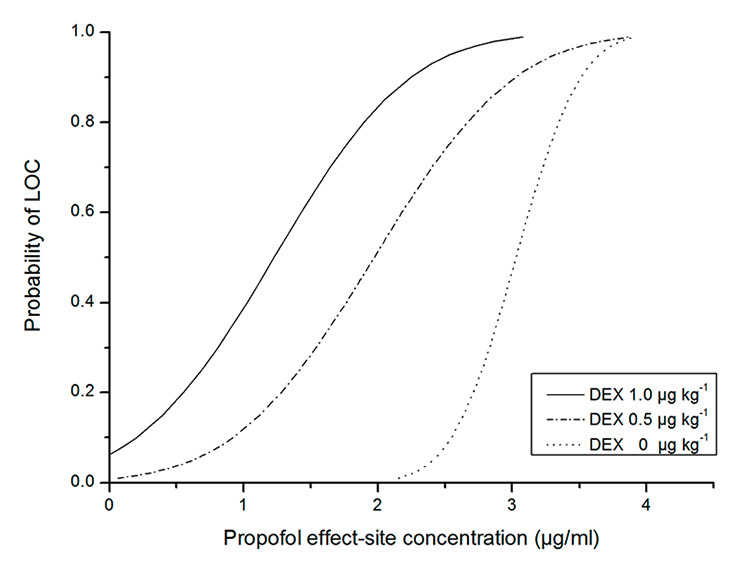
Figure 4
The relationship between the probability of loss of consciousness (LOC) and the propofol effect-site concentration. (DEX = dexmedetomidine.)
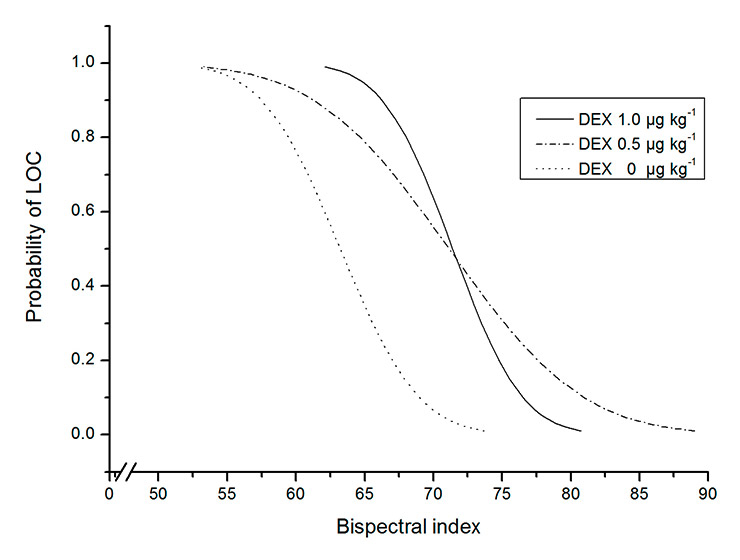
Figure 5
The relationship between the probability of loss of consciousness (LOC) and the bispectral index. (DEX = dexmedetomidine.)
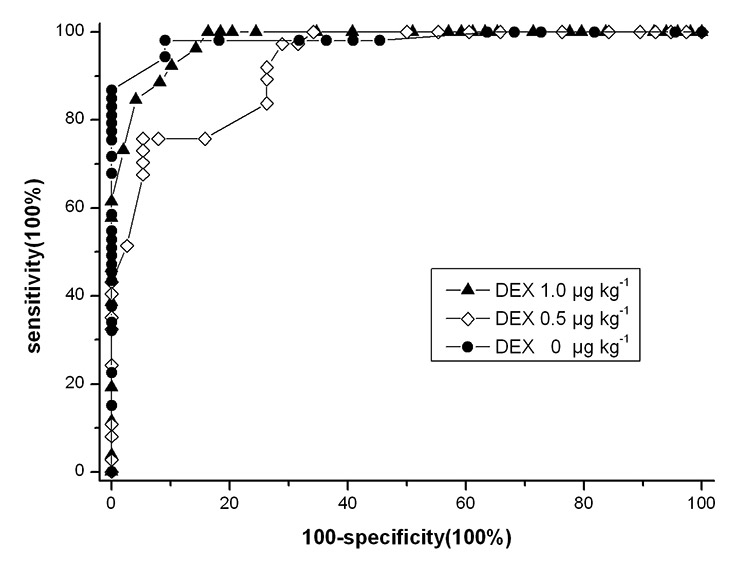
Figure 6
Receiver operating characteristic (ROC) curve for loss of consciousness detected by BIS. (DEX = dexmedetomidine.)
The prediction probability (Pk) and area under ROC curve provide a good comparison of the ability of BIS to measure the degree of sedation between groups. In the three groups, Pk and area under the curve for LOC were similar, indicating identical accuracy of BIS to predict LOC with and without adjunctive dexmedetomidine. Pk and area under the curve were more than 0.9, which indicated BIS monitoring was an excellent indicator of LOC during dexmedetomidine and propofol coadministration.
BIS thresholds for LOC depend on the combinations of different anaesthetics used [22]. For example, when opioids were used in combination with propofol, BIS values for detecting LOC increased [14, 15]. Although dexmedetomidine decreased BIS in this study, LOC was reached at higher BIS values when adding dexmedetomidine to propofol administration. BIS50 for LOC was 63.2 during propofol administration, whereas BIS50 increased to 71.1 and 71.4 after administering dexmedetomidine 0.5 and 1.0 µg kg–1, respectively. One possible explanation is that dexmedetomidine obviously decreases the effect-site concentration of propofol for LOC. Dutta et al. [23] reported that with a maintained dexmedetomidine plasma concentration of 0.66 ± 0.080 ng ml–1, which was reached with larger dexmedetomidine dose than used in our study, the propofol EC50 levels required for Ramsay sedative scores of >4 and 5 were reduced by 64% and 68%, respectively. Peden et al. [24] showed a 30% decrease in the propofol EC50 for LOC by dexmedetomidine 0.63 µg kg–1 premedication during propofol and alfentanil induction of anaesthesia. In our study, dexmedetomidine induced a leftward shift of the propofol dose-response curve for LOC and decreased the effect-site concentration of propofol in a dose-dependent matter. Propofol EC50 was 60% less in the presence of 1.0 µg kg–1 dexmedetomidine and 35% less with 0.5 µg kg–1 dexmedetomidine than without dexmedetomidine. Although the effect of dexmedetomidine on EC95 did not reach the level of significance, a clear declining trend could be observed. Another possible reason is that BIS did not detect the sedative interaction of the anaesthetics [25, 26]. Dutta et al. [23] reported that dexmedetomidine and propofol produced an additive interaction for achieving sedative endpoints, whereas our study showed antagonism on BIS between dexmedetomidine and propofol. The inhibitory effects of adjunctive dexmedetomidine with propofol on BIS were less than the cumulative effects of dexmedetomidine and propofol on BIS.
Our results contradict the findings of Kasuya et al. [19], who reported that BIS values were lower during dexmedetomidine than propofol monoinfusion at comparable OAA/S scores and the cut-off values for LOC with dexmedetomidine were less than with propofol. Theoretically, BIS values for detecting LOC decrease when dexmedetomidine is used in conjunction with propofol. Our study did not show this, possibly because of the easily rousable condition characteristic of dexmedetomidine sedation. Subjects with low BIS values can be roused to a state where meaningful responses to calling and shaking stimulation used by OAA/S score are seen and are thus given a high OAA/S score.
The ROC curve for LOC was obtained by calculating sensitivity and specificity at every possible BIS cut-off point and was used to select optimal cut-off values. The values lay at the elbow of the curve and best differentiated wakefulness and unconsciousness. Adjunctive dexmedetomidine slightly enhanced the optimal BIS cut-off values. However, the highest sum of sensitivity and specificity did no obviously change, which meant the addition of dexmedetomidine had no influence on the ability to discriminate LOC at optimal BIS values. Drummond [27] expressed the opinion that an indicator of anaesthetic depth should have a minimum of 100% sensitivity if clinicians seek a specific numeric threshold that can be interpreted to mean LOC. The BIS cut-off values for LOC at which sensitivity was 100% increased when adding dexmedetomidine. An increase in specificity at the level of 100% sensitivity was observed following adjunctive dexmedetomidine.
One limitation of this study is that we did not measure the plasma concentration of propofol. However, in clinical practice we use a target-controlled infusion device to predict, rather than high-performance liquid chromatography to determine, propofol concentration. The concentration predicted by the target-controlled infusion device is well correlated with measured concentration. In addition, because dexmedetomidine causes cardiac output and renal blood flow reduction, and a redistribution of cardiac output [2, 28], it possibly affects distribution and excretion of propofol and the accuracy of predicted propofol concentration. But, Dutta et al. [23] showed dexmedetomidine did not have a significant influence on propofol pharmacokinetics. Another limitation is that we used only the subjective OAA/S test to identify LOC. The OAA/S test has potential disadvantages. It requires some extrinsic stimulation such as calling, prodding, or shaking to evaluate the neurological status, which can affect subject’s sedative status if sedation is not deep, and results are dependent on the assessor. However, up until now, no better clinical scoring systems are used.
In conclusion, the hypnotic effects of propofol were enhanced by dexmedetomidine. However, BIS did not show this effect, since LOC occurred at a higher BIS values in the presence of dexmedetomidine. Therefore, unchanged BIS values could possibly lead to inadvertent propofol overdose when dexmedetomidine is administrated in propofol anaesthesia. Further prospective, randomised controlled trials are needed to determine an appropriate BIS values to guide intraoperative propofol titration during propofol and dexmedetomidine coadministration.
| Table 5:Cut-off BIS values for detecting loss of consciousness at maximum level of sensitivity and specificity and at a level of 100% sensitivity. | ||
| Group | At maximum level of sensitivity + specificity | At a level of 100% sensitivity |
| Cut-off value(sensitivity [%] – specificity [%]; sum of sensitivity + specificity [%]) | Cut-off value (specificity [%]) | |
| Control Dexmedetomidine 0.5 μg kg–1 Dexmedetomidine 1.0 μg kg–1 | 63.5 (98–91; 189) 74.0 (76–95; 171) 72.5 (85–96; 181) | 54.5 (36) 63.5 (66) 68.5 (84) |
1 Khan ZP, Ferguson CN, Jones RM. Alpha-2 and imidazoline receptor agonists. Their pharmacology and therapeutic role. Anaesthesia. 1999;54(2):146–65.
2 Ebert TJ, Hall JE, Barney JA, Uhrich TD, Colinco MD. The effects of increasing plasma concentrations of dexmedetomidine in humans. Anesthesiology. 2000;93(2):382–94.
3 Arcangeli A, D’Alò C, Gaspari R. Dexmedetomidine use in general anaesthesia. Curr Drug Targets. 2009;10(8):687–95.
4 Afonso J, Reis F. Dexmedetomidine: current role in anesthesia and intensive care. Rev Bras Anestesiol. 2012;62(1):118–33.
5 Ghodki PS, Thombre SK, Sardesai SP, Harnagle KD. Dexmedetomidine as an anesthetic adjuvant in laparoscopic surgery: An observational study using entropy monitoring. J Anaesthesiol Clin Pharmacol. 2012;28(3):334–8.
6 Ngwenyama NE, Anderson J, Hoernschemeyer DG, Tobias JD. Effects of dexmedetomidine on propofol and remifentanil infusion rates during total intravenous anesthesia for spine surgery in adolescents. Paediatr Anaesth. 2008;18(12):1190–5.
7 Kunisawa T, Ueno M, Kurosawa A, Nagashima M, Hayashi D, Sasakawa T, et al. Dexmedetomidine can stabilize hemodynamics and spare anesthetics before cardiopulmonary bypass. J Anesth. 2011;25(6):818–26.
8 Myles PS, Leslie K, McNeil J, Forbes A, Chan MT. Bispectral index monitoring to prevent awareness during anaesthesia: the B-Aware randomised controlled trial. Lancet. 2004;363(9423):1757–63.
9 Ekman A, Lindholm ML, Lennmarken C, Sandin R. Reduction in the incidence of awareness using BIS monitoring. Acta Anaesthesiol Scand. 2004;48(1):20–6.
10 Struys MM, Jensen EW, Smith W, Smith NT, Rampil I, Dumortier FJ, et al. Performance of the ARX-derived auditory evoked potential index as an indicator of anesthetic depth: a comparison with bispectral index and hemodynamic measures during propofol administration. Anesthesiology. 2002;96(4):803–16.
11 Glass PS, Bloom M, Kearse L, Rosow C, Sebel P, Manberg P. Bispectral analysis measures sedation and memory effects of propofol, midazolam, isoflurane, and alfentanil in healthy volunteers. Anesthesiology. 1997;86(4):836–47.
12 Park KS, Hur EJ, Han KW, Kil HY, Han TH. Bispectral index does not correlate with observer assessment of alertness and sedation scores during 0.5% bupivacaine epidural anesthesia with nitrous oxide sedation. Anesth Analg. 2006;103(2):385–9.
13 Suzuki M, Edmonds HL Jr, Tsueda K, Malkani AL, Roberts CS. Effect of ketamine on bispectral index and levels of sedation. J Clin Monit Comput. 1998;14(5):373.
14 Struys MM, Vereecke H, Moerman A, Jensen EW, Verhaeghen D, De Neve N, et al. Ability of the bispectral index, autoregressive modelling with exogenous input-derived auditory evoked potentials, and predicted propofol concentrations to measure patient responsiveness during anesthesia with propofol and remifentanil. Anesthesiology. 2003;99(4):802–12.
15 Mi WD, Sakai T, Singh H, Kudo T, Kudo M, Matsuki A. Hypnotic endpoints vs. the bispectral index, 95% spectral edge frequency and median frequency during propofol infusion with or without fentanyl. Eur J Anaesthesiol. 1999;16(1):47–52.
16 Nelson LE, Lu J, Guo T, Saper CB, Franks NP, Maze M. The alpha2-adrenoceptor agonist dexmedetomidine converges on an endogenous sleep-promoting pathway to exert its sedative effects. Anesthesiology. 2003;98(2):428–36.
17 Huupponen E, Maksimow A, Lapinlampi P, Särkelä M, Saastamoinen A, Snapir A, et al. Electroencephalogram spindle activity during dexmedetomidine sedation and physiological sleep. Acta Anaesthesiol Scand. 2008;52(2):289–94.
18 Li HL, She SZ, Yan Y, Zhu SM. Effect of dexmedetomidine on bispectral index and auditory evoked potential index during anesthesia with target controlled infusion of propofol and remifentanyl. Zhejiang Da Xue Xue Bao Yi Xue Ban. 2010; 39(1):84–8.
19 Kasuya Y, Govinda R, Rauch S, Mascha EJ, Sessler DI, Turan A. The correlation between bispectral index and observational sedation scale in volunteers sedated with dexmedetomidine and propofol. Anesth Analg. 2009;109(6):1811–5.
20 Struys MM, De Smet T, Depoorter B, Versichelen LF, Mortier EP, Dumortier FJ, et al. Comparison of plasma compartment versus two methods for effect compartment-controlled target-controlled infusion for propofol. Anesthesiology. 2000;92(2):399–406.
21 Smith WD, Dutton RC, Smith NT. Measuring the performance of anesthetic depth indicators. Anesthesiology. 1996;84(1):38–51.
22 Johansen JW. Update on bispectral index monitoring. Best Pract Res Clin Anaesthesiol. 2006;20(1):81–99.
23 Dutta S, Karol MD, Cohen T, Jones RM, Mant T. Effect of dexmedetomidine on propofol requirements in healthy subjects. J Pharm Sci. 2001;90(2):172–81.
24 Peden CJ, Cloote AH, Stratford N, Prys-Roberts C. The effect of intravenous dexmedetomidine premedication on the dose requirement of propofol to induce loss of consciousness in patients receiving alfentanil. Anaesthesia. 2001;56(5):408–13.
25 Sakai T, Singh H, Mi WD, Kudo T, Matsuki A. The effect of ketamine on clinical endpoints of hypnosis and EEG variables during propofol infusion. Acta Anaesthesiol Scand. 1999;43(2):212–6.
26 Lysakowski C, Dumont L, Pellegrini M, Clergue F, Tassonyi E. Effects of fentanyl, alfentanil, remifentanil and sufentanil on loss of consciousness and bispectral index during propofol induction of anaesthesia. Br J Anaesth. 2001;86(4):523–7.
27 Drummond JC. Monitoring depth of anesthesia: with emphasis on the application of the bispectral index and the middle latency auditory evoked response to the prevention of recall. Anesthesiolog. 2000;93(3):876–82.
28 Lawrence CJ, Prinzen FW, de Lange S. The effect of dexmedetomidine on nutrient organ blood flow. Anesth Analg. 1996;83(6):1160–5.
Funding/potential competing interests: This study was financially supported by Department of Anesthesiology, the Affiliated People’s Hospital of Jiangsu University.