Figure 1
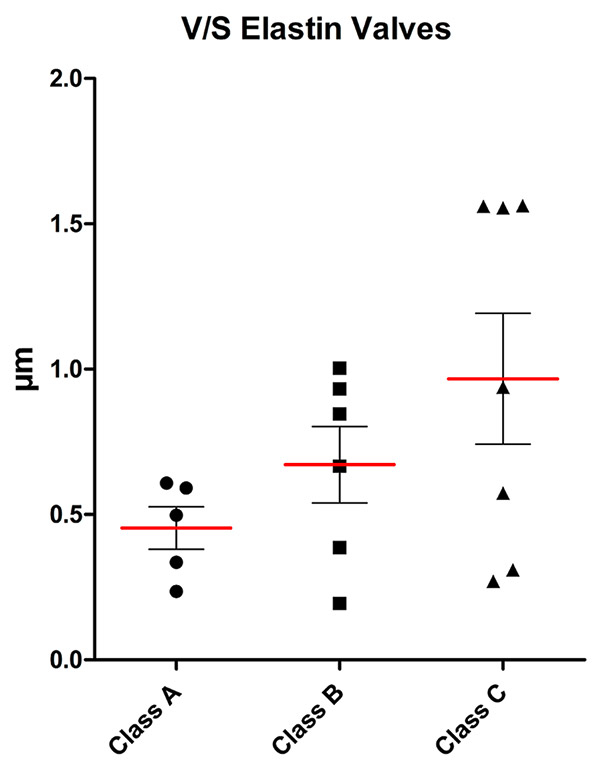
Volume-to-surface ratio of the elastin content of valves for the three classes (mean (red line), standard deviation and individual values).
DOI: https://doi.org/10.4414/smw.2013.13755
Figure 1
Volume-to-surface ratio of the elastin content of valves for the three classes (mean (red line), standard deviation and individual values).
Varicose veins are the most common clinical presentation of chronic venous disorders, occurring in about 20% of the western population, with active venous ulceration being present in about 0.5% [1]. The socioeconomic impact of chronic venous disorders of the lower limbs is highly relevant [1–6].
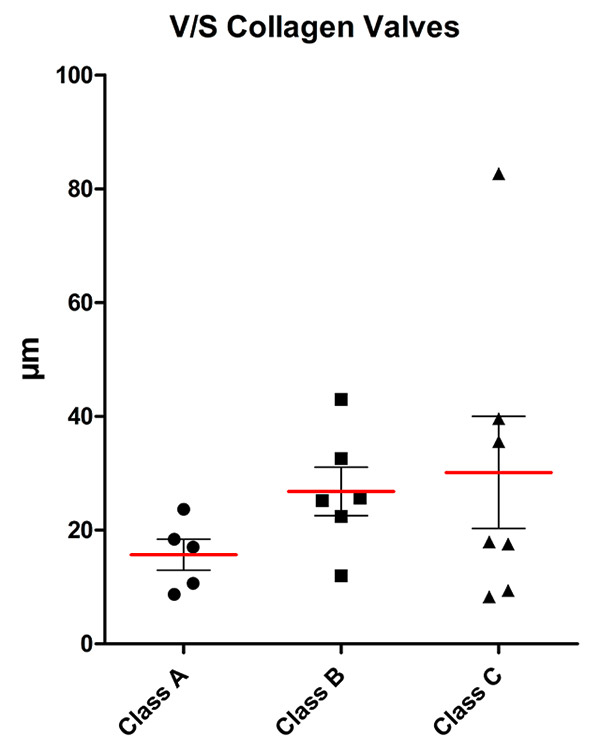
Figure 2
Volume-to-surface ratio of the collagen content of valves for the three classes (mean (red line), standard deviation and individual values).
The topic of the pathogenesis of varicose veins has been relatively neglected, and information on the role of valve or vessel wall disease in the aetiology is scarce [6–10]. There are remarkably few studies on the ultrastructure of venous valves and venous walls, and there is no obvious consensus [11–19].
Earlier theories were that varicose veins arise from valvular incompetence, but currently it is presumed that the process is multifactorial and multicentric. Many different factors play a role, such as intrinsic structure, biochemical changes, and changes in elastin, collagen and smooth muscle content, as well as in enzyme activity, to mention only a few.
To our knowledge, changes in the elastin and collagen content of varicose veins with increasingly progressive disease has not been investigated, particularly not in the valves, and changes in the endothelium of the venous valve and vessel wall have not been compared. Venous valves become more insufficient with increasing diameter of the vein, and additional insufficiency of the valve may be expected with progressive disease on the basis of diminishing elastin content and subsequent decreased mechanical function. It was, therefore, our aim to investigate venous valves in a systematic manner, with emphasis on the ultrastructure, in order to gain a greater understanding of the pathogenesis of venous valve disease and subsequently to optimise current therapies.
The study was approved by the local ethics committee. Informed consent was obtained from all patients. The patients included were undergoing primary great saphenous vein (GSV) surgery for symptomatic chronic venous disorders, or undergoing arterial bypass surgery with GSV as graft material, at the Hospital of Thun. Each patient underwent duplex sonography before surgery, as part of the usual preoperative investigations (Acuson Aspen, Acuson Corporation, Mountain View CA, USA). Patients with postphlebitic changes in their proximal long saphenous vein and without compressibility were excluded from the study, as were those who were not willing to participate. The operations were performed in most cases under spinal anaesthesia, with some under general and a few under local anaesthesia. The groin was opened using a transverse incision. Absorbable suture material was used for the ligation (Vicryl, Ethicon Endo-Sugery, Johnson and Johnson Company, Spreitenbach, Switzerland). The insufficient part of the long saphenous vein was stripped from proximal to distal to avoid nerve injuries, and the specimen was taken with great care to minimise possible damage. The harvested vein was transferred to the appropriate medium for transmission electron microscopy and stereology. A consecutive series of patients were assigned to one of three groups on the basis of the clinical class of their chronic venous disorder. Group A consisted of patients without relevant chronic venous disorders (C0 and C1 in accordance with CEAP (Clinical severity, Etiology, Anatomy, Pathophysiology)), group B represented early stage chronic venous disorders, corresponding to C2 and C3, and group C had advanced venous disease, corresponding to C4, C5 and C6 [6, 18]. The number of patients needed was determined before the start of the study to be at least five per group, corresponding to more than 20,000 electron microscopy observations altogether. In all patients, the proximal 2 cm of the GSV, including the terminal or preterminal valve at the confluence of the superficial inguinal veins, was harvested with the least possible mechanical damage.

Figure 3
Transmission electron microscopic image of the increasing content in elastin in valves from classes A to C. En: endothelial cells, El: elastin, Col: collagen. Magnification: 4400x.
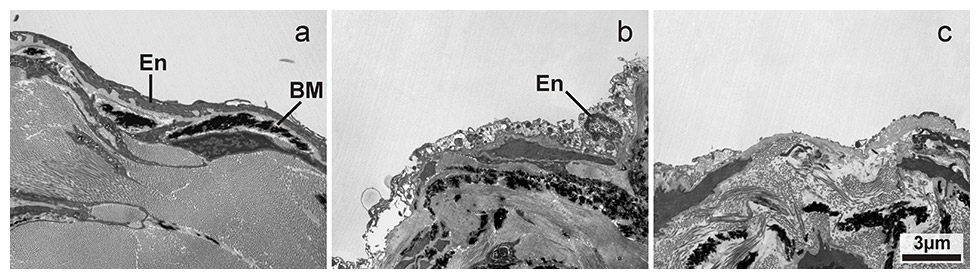
Figure 4
Transmission electron microscopic image of endothelial damage on the valve surface with increasing severity from a to c: a) normal endothelial cells; b) swollen and necrotic appearance of the endothelial cells; c) denuded valve surface with absent endothelial cells. En: endothelial cells, BM: basal membrane. Magnification: 4400x.
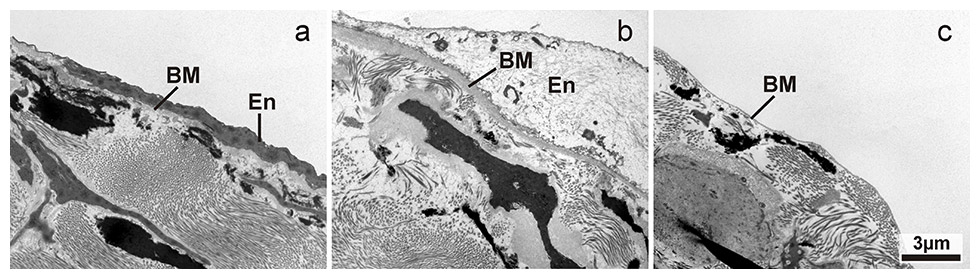
Figure 5
Transmission electron microscopic image of endothelial damage on vessel wall surface near a valves surface with increasing severity from a to c: a) normal endothelial cells; b) drastically swollen and necrotic appearance of the endothelial cells, basal membrane is also swollen; c) denuded vessel wall surface with absent endothelial cells showing direct contact of the basal membrane with the vessel lumen. En: endothelial cells, BM: basal membrane. Magnification: 4400x.
C0‑C1 control specimens were harvested from patients undergoing bypass surgery using the GSV (the proximal few centimetres are often too wide and therefore unsuitable for bypass surgery), or from patients who had symptomatic C1‑C2 disease with isolated reflux in the confluence of the superficial inguinal veins and were undergoing high ligation and resection of the very proximal GSV only.
It was planned that at least five vein segments would be harvested for examination from each group. A morphologist performed a blinded qualitative and quantitative ultrastructural examination.
Between the 1st of January 2010 and the 28th of February 2011, 242 venous procedures on 242 legs were performed, including great and small saphenous vein procedures and re-do procedures, as well as operations for perforators and side branches. Of 132 primary great saphenous vein procedures, in only 17 procedures (12.8%) was a terminal or preterminal valve not clamped within 2 cm of the inguinal confluence of the superficial veins and therefore, as defined in the study protocol, usable as a specimen for microscopy.
After resection of the venous valves, the vessel pieces were immersed in fixative that was prepared as follows: 1.5% paraformaldehyde (Fluka, Buchs, Switzerland) and 1.5% glutaraldehyde (Agar Scientific, Stansted, Essex, UK) in 0.15M HEPES (Fluka, Buchs, Switzerland) with an osmolarity of 830 mOsm/l and adjusted to a pH of 7.35. The solution was made in advance and stored in aliquots of 50 ml at –20 °C until used.
The specimens remained in the fixative at 4 °C for at least 24 hours before being further processed. They were then washed with 0.15 M HEPES twice for 5 minutes, postfixed with 1% OsO4 (SPI Supplies, West Chester, USA) in 0.1 M Na-cacodylate-buffer (Merck, Darmstadt, Germany) at 4 °C for 2 hours, washed with 0.05 M maleate-NaOH buffer (Merck, Darmstadt, Germany) three times for 5 minutes, and then stained in 0.5% uranyl acetate (Fluka, Buchs, Switzerland) in 0.05 M maleate-NaOH buffer at 4 °C for 2 hours. The tissue samples were then washed in 0.05 M maleate-NaOH buffer three times for 5 minutes and dehydrated in 70%, 80%, and 96% ethanol (Alcosuisse, Switzerland) for 15 minutes each at room temperature. Subsequently, samples were immersed in 100% ethanol (Merck, Darmstadt, Germany) three times for 10 minutes, in acetone (Merck, Darmstadt, Germany) twice for 10 min, and finally in acetone-epon (1:1) overnight at room temperature. The next day, specimens were embedded in epon (Fluka, Buchs, Switzerland) and left to harden at 60 °C for 5 days.
Sections were produced using an ultramicrotome UC6 (Leica Microsystems, Vienna, Austria), first semithin sections (1 µm) for light microscopy, which were stained with a solution of 1% toluidine blue O (Merck, Darmstadt, Germany), and then ultrathin sections (70–80 nm) for electron microscopy.
The latter were mounted on 200 mesh copper grids and stained with a tannic acid-uranyl acetate (TU) solution prepared as follows [20]: 0.2 g of tannic acid (Merck, Darmstadt, Germany) and 0.5 g paranitrophenol (Merck, Darmstadt, Germany) were dissolved completely in 35 ml of distilled water with the aid of heat [20]. Paranitrophenol was used in order to prevent contamination. After cooling, 0.3 ml of 5% uranyl acetate was added to this solution. The reagent thus obtained was the staining solution. Thin sections were stained by floating them upon single drops of the TU solution for 15 minutes at room temperature. After a thorough rinse in distilled water, they were dried and then stained with lead citrate for 5 minutes by means of an ultrostainer (Leica Microsystems, Vienna, Austria). The TU-lead citrate method applied to thin sections stained intensely the central amorphous component of elastic fibres.
Sections were then examined at a primary magnification of x4400 using a transmission electron microscope (CM12, Philips, Eindhoven) equipped with a digital camera (Morada, Soft Imaging System, Münster, Germany) and image analysis software (iTEM) [21, 22].
Images were captured on a systematically aligned quadrant for subsampling [21]. The tissue compartments of the valves and their surface-related distribution were quantitatively estimated by means of point and line grids superimposed over the digital images. STEPanizer software was used for image handling, test system generation and hit count recording [22]. Quantification in microscopy should always be done with reference to the containing space in order to obtain absolute values. Ignoring this inevitably yields densities only and comparing densities can cause substantial bias and misinterpretation (“reference trap”) [23, 24]. Biopsy material inherently lacks the information about the reference space from which it was taken. To circumvent this problem, volume estimations were related to the surface area of valves and vessel walls abutting the vessel lumen, thus providing an internal reference (volume-to-surface ratio). Volume was estimated by counting points hitting the relevant tissue component, and surface area was assessed by counting intersections of test lines with the vessel border. The resulting volume-to-surface ratio can also be interpreted as the arithmetic mean thickness of a tissue component per unit vessel wall surface.
In valves, the following components were assessed: volume of elastin per unit surface area of valve [V/S elastin/valve], volume of collagen [V/S collagen/valve] and volume of all other components comprising endothelial cells and the extracellular space. In both valves and adjacent wall regions, the proportion of the surface area facing the vessel lumen was classified according to the ultrastructural preservation of the overlying endothelial cells. The classification was: endothelial cells with normal ultrastructural appearance; endothelial cells showing signs of swelling and/or necrosis; or denuded areas with completely missing endothelium.
Data were compared statistically using a two-tailed student’s t-test and Kruskal Wallis and Dunn post-hoc test.
The study population consisted of 17 patients; 11 were female and 6 male. The overall average patient age (range) was 46.5 (22–74) years. The average age in group A was 37.6 (22–63) years, in group B 43.2 (29–60) years and in group C 57.0 (32–74) years. Group A consisted of three female and two male patients, group B of three female and three male patients, and group C of five female patients and one male patient. Cardiovascular risk factors were present in three patients in group B and three in group C, but none in group A. There were no surgical complications other than haematoma not leading to revision, which is often observed. Patient demographics, including cardiovascular risk factors, are listed in table 1.
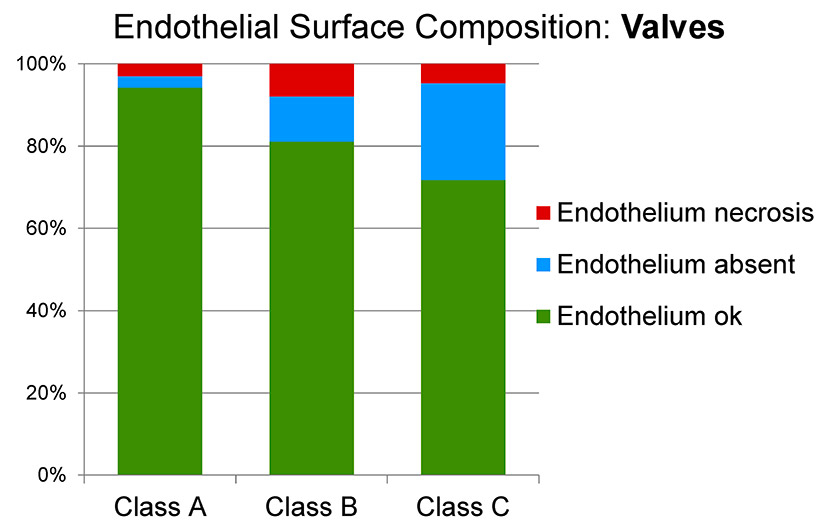
Figure 6
Surface analysis of the endothelium of the valve in the three classes of venous disease (A: minimal; B: early stage; C: advanced).
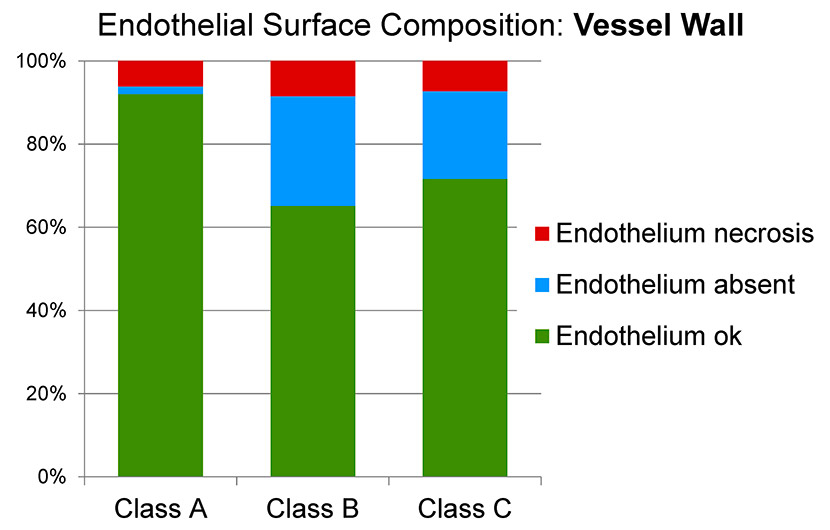
Figure 7
Surface analysis of the endothelium of the vessel wall in the three classes of venous disease (A: minimal; B: early stage; C: advanced).
The elastin and collagen content within valves seemed to differ between group A, group B and group C (figs 1 and 2), although this required confirmation from a formal quantitative analysis using stereology. The fine structure of the vascular endothelium showed areas of normal appearance, areas with swelling and necrosis, as well as areas with absent endothelial cells and a denuded basement membrane, in both valves and vessel walls (figs 3–5). Differences in the degree of damage between groups could not be judged unambiguously on a purely qualitative basis.
Stereological data is summarised in figures 1–7. Stereological analysis of the valves gave mean values for the volume-to-surface ratio of elastin of 0.45 μm3/μm2 in group A, 0.67 μm3/μm2 in group B and 0.97 μm3/μm2 in group C (fig. 1). Although the trend of the means indicated a clear increase in elastin content per unit surface area, this was not statistically significant owing to large interindividual variation with a limited number of patients per group. A similar relation was found for the volume-to-surface ratio of collagen (15.7 μm3/μm2 in group A, 26.8 μm3/μm2in group B, 30.1 μm3/μm2in group C; fig. 2). For both elastin and collagen content, the group means roughly doubled from group A to group C.
Surface analysis of the valve endothelium showed a trend towards more severe damage with disease progression from group A (94.2% normal, 3.0% swollen/necrotic, 2.8% absent) to group B (81.1% normal, 7.9% swollen/necrotic, 11.0% absent) to group C (71.7% normal, 4.7% swollen/necrotic, 23.6% absent) (fig. 6). In particular, a decrease in normal endothelium was accompanied by an increase in absent endothelium from group A to group C.
The endothelium of the vessel wall adjacent to the valve was best preserved in group A (92.0% normal endothelial surface, 6.1% swollen/necrotic endothelial surface, 1.9% absent endothelial surface), whereas the degree of damage was slightly higher in group B (65.2% normal, 8.5% swollen/necrotic, 26.4% absent) and higher again in group C (71.6% normal, 7.2% swollen/necrotic, 21.1% absent) (fig. 7).
Because of high variation within groups and a small number of patients per group, the differences did not reach statistical significance. However, a clear trend towards a decrease in normal, and an increase in absent, endothelium from group A to groups B and C was apparent.
| Table 1: Patient demographics. | |||
| Group | Gender (n) | Age (years) | Risk factors (n) |
| Male - female | Mean (range) | None - one - two or more | |
| A | 2 - 3 | 37.6 (22–63) | 5 - 0 - 0 |
| B | 3 - 3 | 43.2 (25–60) | 3 - 1 - 2 |
| C | 1 - 5 | 57.0 (32–74) | 3 - 2 - 1 |
In our study, progression of the venous disease did not correlate with a reduction in the elastin content within the venous valve. For both elastin and collagen content, the group means roughly doubled from group A to group C. This could be a sign that valve disease plays a smaller role than vessel wall disease in the development of chronic venous insufficiency, but because of the small number of patients there is not enough supportive data to allow firm conclusions.
In our study we also observed that the endothelium of venous valves and the vein wall tends to show increasing degenerative changes with progressive severity of venous disease. The endothelium of the valve did not show more degenerative changes than the endothelium of the wall.
In a previous recent study, the great and small saphenous veins of 13 patients (10 patients with primary varicose veins, 3 trauma patients without clinical evidence of varicose veins) were assessed using a transmission electron microscope. Hypertrophy, elongation and invagination of the intima was observed in the veins of the varicose vein patients, as compared with the GSV segments of the trauma patients (normal controls) [12]. In another recent study, the GSV in two different age groups (26–35 years and 36–45 years) was compared using transmission electron microscopy. It was concluded that morphological changes increase with increasing age of the patient [17]. These two studies suggest that ultrastructural degenerative changes seen with transmission electron microscopy increase with age and with the presence of venous insufficiency.
In our study we compared the changes in the endothelium of the venous valve and vessel wall in three groups with increasing severity of venous disease (CEAP class), and we too observed increasing degenerative changes with progression of disease. According to our results, the endothelia of the valve and of the vessel wall change in a similar, degenerative manner with the progression of the venous disease.
Like arteries, veins suffer pressure changes, but they are of course smaller pressure changes than in the arterial system. Venous pressure changes especially between the supine and erect positions. But according to our results, the endothelia of both the venous valves and the vessel wall alter degeneratively.
There were several limitations to the study. Firstly, during resection of the specimen, minimal damage to at least the adventitia was unavoidable, and this may have caused difficulties in defining the adventitia under the transmission electron microscope. Although the endothelium of the valve and the vessel wall could be examined and compared, it was difficult to define the adventitia of the wall and, therefore, a reliable calculation of the surface to volume ratio within the wall was unfortunately not possible.
The small number of specimens was another limitation. Only the proximal part of the vein and the terminal and preterminal valves were investigated. According to the Bonn Vein Study [25], less than 10% of the middle European adult population show no signs of venous disease (C0 according to CEAP), these being mainly very young people. Our planned C0 and C1 specimens (group A) were, in fact, mild C2 specimens (with more severe C2 and C3 in group B). These specimens came from relatively young patients. Some were undergoing arterial reversed-GSV bypass surgery where the proximal centimetre of the GSV was too large in diameter to match the distal anastomosis and was therefore resected and harvested. Some came from young symptomatic patients from who worked in the standing position. These patients had proximal GSV valve insufficiency (Hach1) and underwent high ligation with resection of the proximal few centimetres of the GSV only and were, as mentioned above, therefore close to group B patients. Obtaining an ideal C0 specimen was not possible in this study. As expected, the average age increased from group A to B to C. It would have been ideal to have the same average age in every group.
Finally, using electron microscopy, we studied the amount of elastin, but not conformational or structural changes in the elastin. The latter changes are of course likely to play a pathophysiological role in varicose veins.
In summary we conclude that with progression of venous disease the valve elastin content, as assessed morphologically, seems to increase, and the endothelium of the venous valve and the vein wall tend to show more damage. On an ultrastructural level, venous valve and vessel wall endothelia may degenerate in a similar way with the progression of the venous disease.
Acknowledgement:We are grateful for the technical support of Mrs E. Yao.
1 Golledge J, Quigley FG. Pathogenesis of varicose veins. Eur J Vasc Endovasc Surg. 2003;25(4):319–24.
2 Bergan JJ, Schmid-Schönbein GW, Coleridge Smith PD, Nicolaides AN, Boisseau MR, Eklof B. Chronic venous disease. N Engl J Med. 2006;3;355(5):488–98.
3 Lim CS, Davies AH. Pathogenesis of primary varicose veins. Br J Surg. 2009;96(11):1231–42.
4 Karathanos Ch, Sfyroeras G, Drakou A, Roussas N, Exarchou M, Kyriakou D, et al. Superficial vein thrombosis in patients with varicose veins: role of thrombophilia factors, age and body mass. Eur J Vasc Endovasc Surg. 2012;43(3):355–8.
5 Evans CJ, Fowkes FG, Ruckley CV, Lee AJ. Prevalence of varicose veins and chronic venous insufficiency in men and women in the general population: Edinburgh Vein Study. J Epidemiol Community Health. 1999;53(3):149–53.
6 Meissner MH, Gloviczki P, Bergan J, et al. Primary chronic venous disorders. J Vasc Surg. 2007;46(Suppl S):54S–67S.
7 Leu HJ. Morphology of chronic venous insufficiency – light and electron microscopic examinations. Vasa. 1991;20(4):330–42.
8 Sales CM, Rosenthal D, Petrillo KA, Jerivs HS, Matsuura J, Clark MD, et al. The Valvular Apparatus in Venous Insufficiency: A Problem of Quantity? Ann Vasc Surg. 1998;12(2):153–5.
9 Schweighofer G, Mühlberger D, Brenner E. The anatomy of the small saphenous vein: fascial and neural relations, saphenofemoral junction and valves. J Vasc Surg. 2010;51(4):982–9.
10 Mühlberger D, Morandini L, Brenner E. Venous valves and major superficial tributary veins near the saphenofemoral junction. J Vasc Surg. 2009;49(6):1562–69.
11 Sayer GL, Smith PD. Immunocytochemical characterisation of the inflammatory cell infiltrate of varicose veins. Eur J Vasc Endovasc Surg. 2004;28(5):479–83.
12 Wali MA, Eid RA. Intimal changes in varicose veins: an ultrastructural study. J Smooth Muscle Res. 2002;38(3):63–74.
13 Sansilvestri-Morel P, Rupin A, Badier-Commander C, Kern P, Fabiani JN, Verbeuren TJ, et al. Imbalance in the synthesis of collagen type I and collagen type III in smooth muscle cells derived from human varicose veins. J Vasc Res. 2001;38(6):560–8.
14 Seydewitz V, Staubesand J. Calcium determination, enzyme biochemical and electron microscopy studies of saphenous veins in patients with coronary sclerosis or varicose veins. Z Gesamte Inn Med. 1990;15;45(4):96–100.
15 Takase S, Bergan JJ, Schmid-Schönbein G. Expression of adhesion molecules and cytokines on saphenous veins in chronic venous insufficiency. Ann Vasc Surg. 2000;14(5):427–35.
16 Pascarella L, Schmidt-Schoenbein GW, Bergan J. An animal model of venous hypertension: the role of inflammation in venous valve failure. J Vasc Surg. 2005;41(2):303–11.
17 Aunapuu M, Arend A. Histopathological changes and expression of adhesion molecules and laminin in varicose veins. Vasa. 2005;34(3):170–5.
18 Leu AJ, Leu HJ, Franzeck UK, Bollinger A. Microvascular changes in chronic venous insufficiency – a review. Cardiovasc Surg. 1995;3(3):237–45.
19 Porter JM, Moneta GL. International Consensus Committee on Chronic Venous Disease: reporting standards in venous disease: an update. J Vasc Surg. 1995;21(4):635–45.
20 Kajikawa K, Yamaguchi T, Katsuda S, Miwa A. An improved electron stain for elastic fibers using tannic acid. J Electron Microsc (Tokyo). 1975;24(4):287–9.
21 Cruz-Orive LM, Weibel ER. Sampling designs for stereology. J Microsc. 1981;122(Pt 3):235–57.
22 Tschanz SA, Burri PH, Weibel ER. A simple tool for stereological assessment of digital images: the STEPanizer. J Microsc. 2011;243(1):47–59.
23 Braendgaard H, Gundersen HJ. The impact of recent stereological advances on quantitative studies of the nervous system. J Neurosci Methods. 1986;18(1-2):39–78.
24 Wulfsohn D, Nyengaard JR, Tang Y. Postnatal growth of cardiomyocytes in the left ventricle of the rat. Anat Rec A Discov Mol Cell Evol Biol. 2004;277(1):236–47.
25 Rabe E, Pannier-Fischer F, Bromen K, Schuldt K, Stang A, Poncar Ch, et al. Bonner Venenstudie der Deutschen Gesellschaft für Phlebologie – Epidemiologische Untersuchung zur Frage der Häufigkeit und Ausprägung von chronischen Venenkrankheiten in der städtischen und ländlichen Wohnbevölkerung. Phlebologie. 2003;32;1–14. German
Funding / potential competing interests: This study was peer-reviewed and funded by the Schweizerischer Nationalfonds (SNF), Bern, Switzerland. The project number is 32003B_127436. No other potential conflict of interest relevant to this article was reported.