Metabolomics – a novel window into inflammatory disease
DOI: https://doi.org/10.4414/smw.2013.13743
Martin A
Fitzpatrick, Stephen P.
Young
Summary
Inflammation is an important component of normal responses to infection and injury. However, chronic activation of the immune system, due to aberrant responses to normal stimuli, can lead to the establishment of a persistent inflammatory state. Such inflammatory conditions are often debilitating, and are associated with a number of important co-morbidities including cardiovascular disease. Resting non-proliferative tissues have distinctive metabolic activities and requirements, which differ considerably from those in infiltrating immune cells, which are undergoing proliferation and differentiation. Immune responses in tissues may therefore be modulated by the relative abundance of substrates in the inflamed site. In turn immune cell activity can feed back and affect metabolic behaviour of the tissues, as most clearly demonstrated in cachexia – the loss of cellular mass driven by tumour necrosis factor-alpha (TNF-α) a key mediator of the inflammatory response. Here we discuss the potential for metabolomic analysis to clarify the interactions between inflammation and metabolic changes underlying many diseases. We suggest that an increased understanding of the interaction between inflammation and cellular metabolism, energy substrate use, tissue breakdown markers, the microbiome and drug metabolites, may provide novel insight into the regulation of inflammatory diseases.
Metabolism and inflammation
Inflammation is a normal and important response to infection and injury. The cardinal features of inflammation – swelling, redness, stiffness and increased temperature – are outward indicators of significant local changes in metabolism. Increasing blood flow in turn affects local nutrient supply and in particular oxygenation of the tissues while infiltrating activated immune cells bring additional metabolic stressors that must be met. Furthermore, inflammation is associated with the rapid influx, differentiation and proliferation of leukocytes. Infiltrating cells have distinct metabolic requirements and, together with the increased cell number, result in a significant alteration in the metabolic profile of the inflamed tissues. In turn, the environment of the tissues may alter the activity, behaviour or differentiation of the invading cells. The activity of macrophages and neutrophils in both clearance of infection and tissue repair is particularly significant due to the production of cytokines and cytotoxic molecules, including reactive oxygen species and reactive nitrogen species, consuming considerable oxygen, adenosine 5’-triphosphate (ATP) and reduced nicotinamide adenine dinucleotide phosphate (NADPH) in the process. Reactive species, while essential for killing invading organisms, also put considerable stress on surrounding and distal tissues via loss of protective metabolites including reduced glutathione (GSH). In rheumatoid arthritis patients blood levels of GSH decline by 50% and this is associated with a 3-fold increase in lipid peroxides [1]. A similar picture is seen in healthy ageing and this is enhanced in individuals receiving medical attention (fig. 1) suggesting that the process of “inflamma ging” may interact with pathological developments to promote changes in metabolism [2].

Figure 1
Levels of plasma antioxidant glutathione decrease with age whereas markers of oxidative damage lipid hydroperoxides increase.
This provides an example of the magnitude of changes in metabolite levels that can be observed in humans which, in this case, may be consequence of inflammaging. Adapted from Nuttall SL, Martin U, Sinclair AJ, Kendall MJ. Glutathione: in sickness and in health. Lancet. 1998;351(9103):645–6 [62].
It is interesting to note that mechanisms of metabolic and immune control co-evolved, originating in single fat body organ as still seen in Drosophila melanogaster [3]. This association persists in higher organisms, where lymph nodes are embedded in perinodal adipose tissue that may influence immune responses [4]. In humans adipose tissue is well infiltrated with macrophages, and the production of inflammatory cytokines by both adipocytes and macrophages contributes to systemic inflammation [5]. This link between inflammation and metabolism is well demonstrated in cachexia, where the loss of cellular mass is driven by tumour necrosis factor-alpha (TNF-α) a mediator of the inflammatory response [5, 6]. Under normal circumstances acute inflammatory triggers are cleared or repaired rapidly, with subsequent homeostatic return. However, there are a number of chronic inflammatory diseases where aberrant immune activation results in a persistent inflammatory state. The metabolic consequences of chronic inflammation extend beyond the local site of disease, driving important co-morbidities including accelerated atherosclerosis and cardiovascular disease. Understanding of the metabolic aspects may therefore be key to fully characterising inflammatory disease. However, given the complexity of the interlinking metabolic pathways in different organs, tissues and cells a systems biology approach is needed to assess and interpret these metabolic changes.
Principles of metabolomics
Metabolomics is a novel systems approach that can be used to dissect the local and systemic metabolic consequences of inflammation. Just as genomics studies the genetic basis of phenotype, and transcriptomics and proteomics study the products of these genes, metabolomics seeks to understand the downstream effects caused by the action of these proteins and enzymes in the context of energy and metabolite consumption and regulation. A hypothesis-forming approach, it is driven by the non-discriminant analysis of the low molecular weight metabolite component of target samples. The potential of metabolomics has shown promise in the prediction and diagnosis of diseases including ulcerative colitis, rheumatoid arthritis, multiple sclerosis (MS) among others [7–9].
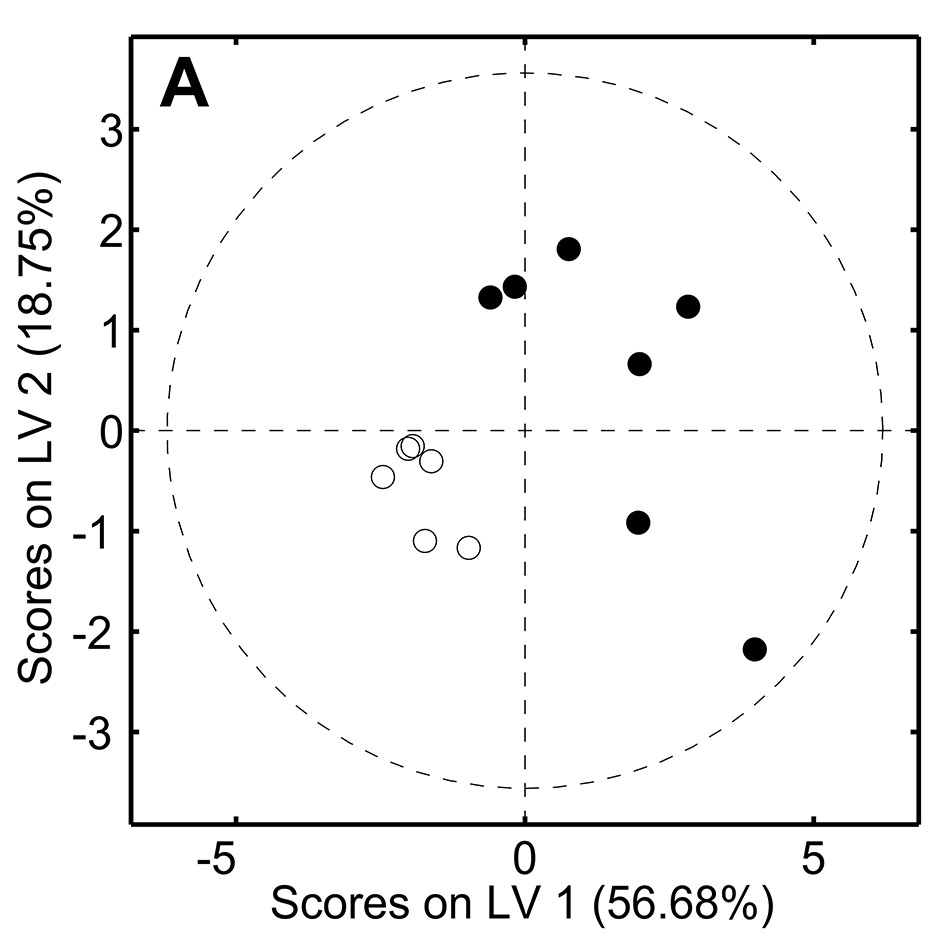

Figure 2
Metabolomic analysis of serum samples from old () and young () healthy volunteers.
1D spectra were acquired in a 500MHz spectrometer and processed with NMRLab/Metabolab and analysed with partial least squares discriminant analysis (PLS-DA). The two groups (<25 and >75 years) were well separated on PLSDA (A) with loadings (B) showing amine derivatives and ketone bodies are raised in ageing, which may be markers of underlying inflammaging.
Metabolomic analysis starts with the acquisition of metabolite data from samples. There are a number of variations of techniques for this purpose, although the most commonly used are nuclear magnetic resonance (NMR) spectroscopy, or mass spectrometry (MS). Samples may be derived from any sample suitably processed to be cell-free, including urines, plasma, cerebrospinal fluid, faecal extracts and synovial fluid [7–9], and pH stable through addition of buffers. Alternatively cell extracts may be performed into a suitable solvent, such as methanol with chloroform extraction to remove protein components. Consistent processing and buffering is key to the success of metabolomic analysis due to the potential confounding factors that may result from variations in pH during acquisition – including shifted peaks and chemical reaction resulting in loss or gain of metabolites. Acquisition of samples results in spectra containing a number of peaks, representing proton resonance in 1H NMR or mass/charge (m/z) ratios in mass spectrometry. In practise however the goal of analysis is the same – using differences in metabolites to describe the differences between sample groups. The large size of the datasets and often numerous samples requires the use of multivariate analysis to simplify and distil meaning from the resulting data.
Statistical methods for the analysis of metabolomic data may be broadly grouped into directed and undirected approaches [10]. In undirected analysis such as PCA, the goal is to describe the maximum variation in the dataset itself without providing information to the model about the class groupings. The output is a series of orthogonal principal components, describing the maximum to minimum variation in the data in turn through weighted peaks. If the source of largest variation in the data is the difference between control and test samples, principal components analysis (PCA) alone is sufficient to differentiate class groupings. However, in more variable samples, as is often the case in biological sourced materials, other confounding or random data may mask the true differences in the samples. Here directed analysis techniques may be more useful. Partial least squares regression (PLS) may be used to describe variation in one dataset by reference to another – for example, using metabolite concentrations to predict disease activity, progression or severity. Similarly, the related technique PLS discriminant analysis (PLS-DA) uses multivariate metabolomic peak data to describe the assignment of samples to binary groups. By focusing on the variation that describes the differences between control and test samples, it is possible to tease out the clinically relevant variation in the face of significant unrelated noise. The output of these approaches is markedly similar: a statistical model from which is it possible to accurately predict disease state or patient group from similarly processed samples from new individuals. However, these models are complicated and include multiple correlated peaks. Forward selection regression analysis may therefore be employed to iteratively discard peaks resulting in a small number of metabolites while maintaining predictive capability – a requirement for the development of cheap specific bioassays. Selection of controls, accounting for confounding effects such as diet, smoking, and medication history, is key to the development of accurate models.
A simple example of the output of a metabolomic study is shown in figure 2, where we assessed NMR-derived metabolic fingerprints of serum from a small cohort of healthy elderly individuals (age >75 years) in comparison to young donors (<25 years). The groups are clearly separated in a PLS-DA model and analysis of the loadings plot (which indicates which regions of the NMR spectra contribute to the separation) indicates several distinguishing metabolites including methylamine and ketone bodies which have been associated with ageing in rats probably as a result in changes in pyruvate and energy metabolism [11]. Ketone bodies are also generated by inflammatory leukocytes and have been observed in the synovium in RA [2]. Therefore, here they may be present as a result of low grade inflammation which is characteristic of inflammaging and so may provide novel markers of this process [12].
By applying these metabolomics techniques to inflammatory disease the goal is to determine the role of metabolic processes in the development of normal and aberrant inflammatory states. Metabolite markers, assayed from the various tissues and fluids, are accessible and simple to obtain from patients while having the potential to provide deeper indications of underlying disease processes.
Metabolic markers
In the following sections we take a systematic approach to outline key markers identified by metabolomic studies to date which are summarised in table 1.
In spite of the early state of the field, there already exist a number of key areas of investigation where metabolic patterns are emerging, both in general inflammatory disease and in specific pathologies. Here we focus on the most important of these which include energy sources, hypoxia, regulation of inflammation, tissue degradation, waste and drug metabolites.
|
Table 1: Key metabolites and their association with inflammatory diseases in current literature arranged according to the major themes discussed. |
|
Metabolite
|
Associations
|
Fluids
|
Inflammatory diseases
|
References
|
|
Lactate: Warburg and the hypoxic environment
|
| Lactate |
Hypoxia, oxidative damage. |
SF, Urine, CSF |
RA, OA†, IIH, MS |
[8, 30, 32] |
| Citric acid cycle intermediates |
| Oxaloacetate |
|
CSF, VF |
IIH, LIU |
[9] |
| Citrate |
|
CSF |
IIH |
[9] |
| Malate |
|
Urine |
OA† |
[32] |
|
Alternative energy sources
|
| Amino acid metabolites |
|
|
|
| Xanthurenic acid
Uracil, xanthine, glycine |
|
CD |
[48] |
| |
RA† |
[60] |
| Ketone bodies |
Acetyl-CoA, fatty acid, amino acid breakdown. |
SF, CSF |
RA, MS |
[12, 42, 43] |
| Lipoprotein-associated fatty acids |
Resting energy source |
SF, Blood |
IA, OA |
[41] |
|
Tissue degradation and waste
|
| Essential amino acids |
Protein breakdown |
Serum |
OA |
[46] |
| Hyaluronic acid |
|
|
|
|
| Trimethylamine |
|
Urine |
IBD, IBD†, CD |
[47, 53] |
| Urea |
|
VF |
LIU |
[52] |
|
Xenobiotics and the Microbiome
|
| Oxylipids |
|
NSAIDs |
[54, 61] |
| Cholesterol esters and Phospholipid metabolites |
|
Simvastatin |
[55] |
| Acetate |
|
Faecal |
CD |
[47] |
| Butyrate |
|
Faecal |
CD, T1D |
[47, 58] |
| Formate |
|
Urine |
CD |
[47] |
|
Others
|
| Creatinine |
|
CSF |
MS |
[30] |
| RA = rheumatoid arthritis; IA = inflammatory arthritis; OA = osteoarthritis; IIH = idiopathic intercranial hypertension; MS = multiple sclerosis; LIU = lens induced uveitis; CD = Crohn’s disease. CSF = cerebospinal fluid, VF = vitreous fluid, SF = synovial fluid; † animal model. |
Lactate: the Warburg effect and hypoxia
In the presence of adequate oxygen, differentiated cells metabolise glucose through mitochondrial oxidation of glycolytic pyruvate in the tricarboxylic acid (TCA) cycle, with resulting NADH fuelling oxidative phosphorylation to produce 36 ATP per glucose molecule. Under hypoxic conditions the oxidative pathways are inhibited and glycolytic pyruvate is instead excreted as lactate, with a decreased 2 ATP output per glucose molecules in the cell. Physiological levels of oxygen range between 5%–12% depending on tissue location. Structures in the body held naturally at the lower end of this range, by virtue of low perfusion or vascularisation, include the lymph nodes, eye and synovium. In normal inflammatory conditions hypoxia results as a side effect of blood vessel occlusion due to inflammation or as a result of increased cell density following infiltration. Hypoxia is a key driver of cell migration into the tissues and perfusion may act as a signalling mechanism to invading cells [13]. Reductions in oxygen lead to stabilisation of transcription factor hypoxia-inducible factor (HIF) providing an elegant cellular oxygen detection system. Stabilisation of HIF drives major changes in cellular gene expression including the promotion of glycolytic enzymes. Peripheral blood CD4+ T cells exposed to hypoxia show dramatic induction of genes involved in metabolism and homeostasis [14]. Innate immune cells, including neutrophils and macrophages are thought better adapted to function at low oxygen tensions with preferential use of glycolysis to provide ATP even under normal physiological oxygen [15]. Macrophages tend to accumulate in the hypoxic sites of chronic inflammation and hypoxia is associated with the activation of infiltrating and tissue-resident macrophages resulting in up-regulation of pro-inflammatory IL-1, IL-6, IFN-γ and TNF-α [16–20]. Most infections or injuries are cleared or repaired quickly with perfusion and metabolic homeostasis soon restored. However, in poorly perfused tissues such as the rheumatoid synovium and sclerotic tissues oxygen perfusion can fall as low as 0.5%–2.5% and this regulation may be perturbed leading to continued recruitment [21, 22]. Lactate is a waste product of normal metabolism reversibly converted from glycolytic pyruvate via the enzyme lactate dehydrogenase. Excess cellular lactate is excreted and re-circulated via conversion in the live to glucose (the Cori cycle). In sufficiently oxygenated cells it may also be converted back to pyruvate via reaction with intracellular NAD+ to fuel the citric acid cycle. However, in poorly perfused tissues the production of lactate outstrips this homeostatic control and lactate accumulates. In hypoxic conditions the HIF-mediated up-regulation of lactate dehydrogenase A further promotes this accumulation [23].
Lactate therefore is a key marker of inflammatory sites under hypoxia. However, this relationship is not restricted to inflammation. In 1924 Otto Warburg first observed that cancer cells metabolise glucose by glycolysis even under aerobic conditions [24]. It has been suggested that that all differentiating and replicating cells must use this same mechanism in order to produce the requisite biomass for cellular replication [25]. By this mechanism, glucose and glutamine can adequately supply the majority of carbon, nitrogen and energy for cell growth and division. Indeed, under growth conditions, metabolising glucose to CO2 via oxidative phosphorylation runs counter to the needs of the cell. Therefore, non-proliferative, highly ATP-dependent organs such as the brain favour free-energy production via oxidative phosphorylation of glucose [26], while in contrast, under resting conditions, skeletal muscle metabolism is predominantly fatty acid dependent, switching to glycolysis and oxidative phosphorylation under activity [27]. In proliferative tissues such as the lymph nodes, there is instead a tendency towards metabolism of glucose to lactate, pyruvate and CO2, and glutamine to ammonia, glutamate and aspartate. Importantly this may also apply to cells, such as polymorphonuclear leukocytes, that invade inflammatory sites [28, 29]. The switch to aerobic glycolysis therefore compounds the production of lactate, locally and distally – including where hypoxia is absent.
The role for lactate as a universal marker of inflammation is borne out clinically. Increases in the ratio of lactate : glucose in blood plasma and synovial fluid in patients with rheumatoid arthritis has been shown to correlate with active inflammation and oxidative damage to the joint, for example [8]. Meanwhile, in a wide-ranging study of cerebrospinal fluid (CSF) from patients with a number of neurological conditions, high lactate was a distinguishing feature of idiopathic intracranial hypertension (IIH) hinting to a potential inflammatory basis for the disease with pressure occlusion of the intracranial vasculature. Increased CSF lactate and creatinine are also seen in multiple sclerosis patients versus controls, potentially reflecting leukocyte infiltration into the lesions [30]. Such alterations in pyruvate and lactate can in turn drive downstream effects on the citric acid cycle. Pyruvate may be converted to intermediates of the citric acid cycle, malate and oxaloacetate [31] by pyruvate carboxylase and malic enzyme respectively. Raised urine malate is a strong predictor of disease activity in the Hartley guinea pig model of OA [32]. Raised oxaloacetate and reduced citrate are also associated with disease in idiopathic intracranial hypertension together with increases in ketone bodies 3-hydroxybutyrate, suggestive of an anaerobic carbohydrate-deficient environment [9].
Alternative energy sources
The base relationship between resting energy expenditure and body mass is described by the Kleiber formula (REE = 293M0.75). Organ-specific metabolic rates and preferred substrates are also well established (fig. 3) with the heart and kidney consuming the major proportion of energy in the resting adult, followed by the brain and liver [33, 34]. However, these basal rates are significantly altered by malnutrition, illness, smoking, and inflammation and changes in substrate availability can have disproportionate effects [34]. Recent work on a cohort of RA patients found that their global basal metabolic rate (BMR) was 6,276 kJoules/day, which was 8% higher that the value from a control group. Importantly a group of RA patients who smoked had a 20% higher BMR of 7,188 kJoules/day (fig. 4) [35]. This indicates how large the effects of inflammation and factors promoting it can be and explains why changes in blood and tissue metabolites are easily observed. Inflammation is a highly energy-dependent process and acutely reliant on adequate energy availability to function correctly [36]. Fever is associated with an 11% increase in energy consumption per 1°C, while phagocyte production during an infectious episode consumes approximately 790 kJoules [37, 38]. In sepsis the metabolic rate can reach up to 30%–60% above baseline levels [39]. The converse is also true, with the energy surplus associated with obesity and other metabolic syndromes driving altered immune responses and chronic inflammation [40].
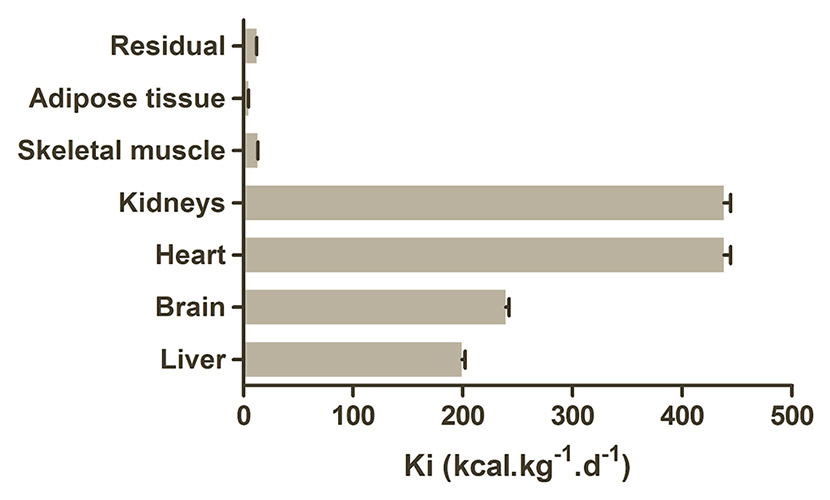
Figure 3
Metabolic requirements of the major tissues.
While the overall resting energy expenditure falls in old age, relative contributions of organs to the total remains stable. Adapted from Wang Z, Ying Z, Bosy-Westphal A, Zhang J, Schautz B, Later W, et al. Specific metabolic rates of major organs and tissues across adulthood : evaluation by mechanistic model of resting energy expenditure 1–4. Am J Clin Nutr. 2010;92(4):1369–77 [34].

Figure 4
Smoking has a significant effect on the basal metabolic rate of rheumatoid arthritis patients (RA).
Metabolic rate is higher in RA compared to healthy controls and this is enhanced even further by smoking, indicating the complexity of interactions between metabolism and disease. Adapted from Metsios GS, Stavropoulos-Kalinoglou A, Nevill M, Douglas KMJ, Koutedakis Y, Kitas GD. Cigarette smoking significantly increases basal metabolic rate in patients with rheumatoid arthritis. Ann Rheum Dis. 2008;67(1):70–3 [35].
Energy availability is therefore a key regulator of immune activation and resolution. Resting energy requirements for non-brain and non-proliferative tissues, particularly the skeletal muscle and heart, are predominantly met by the oxidation of free fatty acids [27]. Due to the oxidation requirement their use is typically limited to well-perfused tissues, however damage to the joint in inflammatory and osteoarthritis appears to be associated with an increased perfusion of macromolecular fatty acids into the synovium. In osteoarthritis increased lipoprotein associated fatty acids, together with metabolism products glycerol, ketones and pyruvate, are all indicative of lipolysis occurring as an energy source. Similarly, a study of RA synovial fluid samples has shown reduced chylomicron and very-low-density-lipoprotein associated triglycerides compared to controls, suggesting increased utilisation of fats as an energy source in the joint in spite of the hypoxic environment. Blood plasma levels of cholesterol, acetylated glycoprotein and lipids were also raised in RA [41].
Fatty acids are additionally broken down in the liver and kidney, producing ketone bodies for recirculation to the tissues. Ketone bodies acetoacetate and 3-hydroxybutyrate provide a key energy source for the heart and brain, through reconversion to acetyl-CoA to feed the citric acid cycle in the tissues, while acetone is readily excreted as waste. In normal fasting conditions plasma levels of ketone bodies are low, as tissues with lower metabolic needs sustain themselves on local reserves of fatty acids, but these sources are not sufficient for active, highly energy-dependent tissues and ketone body production rises significantly. After 3.5 days of glucose starvation the brain can obtain as much as 25% of total energy from ketone bodies [26]. However, alterations in ketone body production and metabolism have also been observed in inflammatory diseases in the absence of glucose restriction. Elevated 3-hydroxybutyrate has also been seen in MS with samples containing as much as 32 μM concentration of this metabolite [42, 43]. As previously described, chronic inflammation may drive metabolic changes, deriving in particular from cachexia-associated catabolism and ketogenesis. The presence of the ketone body 3-hydroxybutyrate in urine has been linked to respiratory chain deficiency leading to impaired NADH oxidation [44]. Local changes may also be informative: raised synovial fluid concentrations of ketone bodies, particularly 3-hydroxybutyrate, in patients with rheumatoid arthritis are suggested to reflect the degradation of local acetyl-CoA under hypoxic conditions [12]. This was also suggested by the low glucose NMR signal in synovial fluid which was 20% lower than paired sera, which is a direct measure of the decrease in this metabolite.
Tissue degradation and waste
Normal tissue homeostasis requires the turnover of both cellular and acellular biomass. In the inflammatory state however, these processes are often altered offering the possibility of characteristic excess or paucity of specific biomarkers. Specific tissue-derived metabolites may provide the clearest markers of gross tissue destruction. Hyaluronic acid for example, is a major component of articular cartilage proteoglycan aggregate and essential for the functional integrity of extracellular matrix. Hyaluronidase activity is absent in both normal and inflamed synovial fluid, and therefore breakdown does not occur. However, in rheumatoid arthritis the action of reactive oxygen species results in detectable levels of hyaluronic acid in the synovium providing a direct local marker of joint destruction [45].
Essential amino acids, those that cannot be synthesised de novo in the human body, also offer a useful general marker for protein degradation. On a background of steady dietary intake any alterations in tissue concentrations must derive from catabolism of existing proteins – sourced from gross tissue destruction, apoptosis or cellular autophagy. This principle has been clearly demonstrated in a mass spectrometry study of serum from patients with OA. Valine concentration in the OA patients was 306 μM while in the control group it was 266 μM, giving rise to a significant alteration in the ratio of serum valine to histidine and leucine to histidine in patients versus controls [46]. In a study of comparing faecal extracts from patients with ulcerative colitis (UD) and Crohn’s disease (CD), higher levels of alanine, isoleucine, leucine, lysine and valine were all seen in patients with CD [47]. Gas chromatography-mass spectrometry analysis of urinary metabolites in a mouse model of Crohn’s disease similarly identified alterations in tryptophan metabolism [48]. This appears to be a general feature of inflammatory processes, as demonstrated using adenoviral vector to induce chronic expression of inflammatory IL-1B or TNFα, the IL-1B treated group similarly saw increases in leucine, isoleucine, valine, n-butyrate and glucose [49]. Interestingly, dietary supplementation with a subset of essential amino acids, the branch chain amino acids, has shown to drive an increase in Th1-like responses via IL-1, IL-2, TNF and interferon suggesting the possibility of a link between local release from degradation and chronic inflammation [50].
The catabolism of amino acids, either as an energy source or resulting from protein degradation, results in the local and systemic accumulation of ammonia. This toxic metabolite is rapidly converted to urea, predominantly in the liver and kidney but also elsewhere, for subsequent excretion via urine [51]. In tissue destruction other nitrogenous base carriers, such as trimethylamine, perform broadly similar functions. Excretion of nitrogenous waste is key to tissue homeostasis, however, under excess production or in sites of poor circulation these metabolites can accumulate. For example in a study of ocular inflammatory diseases compared vitreous humour samples from patients with various retinal disorders distinctions could be drawn with urea, oxaloacetate and glucose all significantly raised in lens-induced uveitis (LIU) compared to chronic non-infectious uveitis (CU) [52]. Similarly, a study of urinary metabolites in a IL-10 deficient mouse model of inflammatory bowel disease (IBD) showed an increase in trimethylamine (TMA) compared to controls, with the increase in urine TMA (1540 μM in the IL10 deficient compared to 308 μM in the wild-type at 20 weeks) running parallel to the progression of IBD [53], a finding corroborated in human studies using both urine and faecal extracts [47].
Xenobiotics and the microbiome
So far we have dealt only with metabolites of human biological origin. However, two other broad metabolite classes deserve further mention in the context of inflammatory disease: xenobiotics and the microbiome.
Xenobiotics are chemicals found in an organism that are not derived from normal biological processes or dietary intake – a classification that includes most drug treatments. Metabolism of xenobiotics is a complex process, predominantly occurring in the liver and typically involving multiple steps of oxidation, reduction, hydrolysis, cyclisation, and decyclisation with the end goal of detoxification and excretion. Metabolism is associated with characteristic profile of intermediates and excretion products that are unique to the drug or class. In a clinical context these metabolites simply restate what is already known – the treatment regimen of the patient. More interesting are the effects of drug metabolism on disease progression and resolution. For example, in a study of diclofenac significantly altered levels of oxylipids were seen in those patients that responded to the drug, with arachadonic acid metabolite 5,6-DHET identified as a novel marker of inflammation [54]. Similarly, analysis of patient responses to simvastatin successfully discriminated responders and non-responders by metabolic profiles of cholesterol esters and phospholipid metabolites [55]. Interestingly, this study was also able to discriminate between metabolites associated with drug effects on LDL-C or C-reactive protein independently – characterising mechanism of action within an individual. Potentially, the baseline metabolic characteristics of an individual may have important implications for drug lifetime, and effectiveness, and provide a route to tailoring dosing or drug choice to an individual in accordance to not just genetic variability but also lifestyle and diet.
The microbiome is a collective term for the totality of commensal bacteria within our bodies. Bacteria outnumber our own cells by a ratio of 10 to 1 [56], are responsible for many essential metabolic processes for our health, and respond to both inflammatory and immune processes. In an analysis of faecal extracts from patients with Crohn’s disease (CD) and ulcerative colitis (UC) reduced levels of butyrate, acetate, methylamine and TMA were detected compared to controls [47]. Urinary metabolites derived from alterations in gut metabolism also allow distinction to be drawn between the two diseases with hippurate and 4-cresol low in CD versus UC and controls, and formate higher in CD [57]. While it is perhaps unsurprising that inflammatory gut conditions would drive alterations in gut bacterial metabolism, changes have also been seen in other conditions with no known gut involvement. In a case-control study of type-1 diabetes a switch in gut bacteria from mucin-degrading, butyrate producing bacteria, to non-butyrate and lactate-utilising bacteria has been associated with development of the disease [58]. The role of the microbiome in cardiovascular conditions was likewise demonstrated by the finding that metabolism of dietary lecithin by gut flora leads to absorption and accumulation of derivatives of choline which in turn promotes disease [59]. This close relationship between the metabolism of gut bacteria and elsewhere in the body provides a key challenge in our understanding of disease processes through analysis of body fluids.
Conclusion
Metabolomics is, a novel systems approach offering insight into the underlying mechanisms of inflammatory disease. As outlined here, seemingly disparate metabolic markers can be broadly arranged into functional groupings that together describe local and global disease processes. The key difficulty is in separating these local and global effects when assaying through a single bio-fluid. However, in the context of diagnostic or prognostic markers, this is not necessarily required. Metabolic processes do not occur in isolation, and through the noise the interaction of the multiple systems involved in an inflammatory response emerges a characteristic fingerprint of disease. In developing diagnostic assays we are aided by the fact that these fingerprints frequently consist of the same relatively small subset of metabolites, yet maintain their discriminative capacity, sensitivity and specificity. Metabolomics offers a novel non-invasive approach to rapid diagnosis, prognosis and prediction of inflammatory disease outcomes.
References
1 Hassan MQ, Hadi R, Al-Rawi ZS, Padron V, Stohs SJ. The glutathione defense system in the pathogenesis of rheumatoid arthritis. J Appl Toxicol. 2001;21(1):69–73.
2 Franceschi C, Capri M, Monti D, Giunta S, Olivieri F, Sevini F, et al. Inflammaging and anti-inflammaging: a systemic perspective on aging and longevity emerged from studies in humans. Mech Ageing Dev. 2007;128(1):92–105.
3 Leclerc V, Reichhart JM. The immune response of Drosophila melanogaster. Immunol Rev. 2004;198(1):59–71.
4 Hotamisligil GS. Inflammation and metabolic disorders. Nature. 2006;444(7121):860–7.
5 Berg AH, Scherer PE. Adipose tissue, inflammation, and cardiovascular disease. Circ Res. 2005;96(9):939–49.
6 Summers GD, Metsios GS, Stavropoulos-Kalinoglou A, Kitas GD. Rheumatoid cachexia and cardiovascular disease. Nat Rev Rheumatol. 2010;6(8):445–51.
7 Schicho R, Nazyrova A, Shaykhutdinov R, Duggan G, Vogel HJ, Storr M. Quantitative metabolomic profiling of serum and urine in DSS-induced ulcerative colitis of mice by (1)H NMR spectroscopy. J Proteome Res. 2010;9(12):6265–73.
8 Naughton DP, Haywood R, Blake DR, Edmonds S, Hawkes GE, Grootveld M. A comparative evaluation of the metabolic profiles of normal and inflammatory knee-joint synovial fluids by high resolution proton NMR spectroscopy. FEBS Lett. 1993;332(3):221–5.
9 Sinclair AJ, Viant MR, Ball AK, Burdon MA, Walker EA, Stewart PM, et al. NMR-based metabolomic analysis of cerebrospinal fluid and serum in neurological diseases – a diagnostic tool? NMR Biomed. 2010;23(2):123–32.
10 Ramadan Z, Jacobs D, Grigorov M, Kochhar S. Metabolic profiling using principal component analysis, discriminant partial least squares, and genetic algorithms. Talanta. 2006;68(5):1683–91.
11 Wu B, Yan S, Lin Z, Wang Q, Yang Y, Yang G, et al. Metabonomic study on ageing: NMR-based investigation into rat urinary metabolites and the effect of the total flavone of Epimedium. Mol Biosyst. 2008;4(8):855–61.
12 Naughton D, Whelan M, Smith EC, Williams R, Blake DR, Grootveld M. An investigation of the abnormal metabolic status of synovial fluid from patients with rheumatoid arthritis by high field proton nuclear magnetic resonance spectroscopy. FEBS Lett. 1993;317(1-2):135–8.
13 Ng CT, Biniecka M, Kennedy A, McCormick J, Fitzgerald O, Bresnihan B, et al. Synovial tissue hypoxia and inflammation in vivo. Ann Rheum Dis. 2010;69(7):1389–95.
14 Gaber T, Häupl T, Sandig G, Tykwinska K, Fangradt M, Tschirschmann M, et al. Adaptation of human CD4+ T cells to pathophysiological hypoxia: a transcriptome analysis. J Rheumatol. 2009;36(12):2655–69.
15 Cramer T, Yamanishi Y, Clausen BE, Förster I, Pawlinski R, Mackman N, et al. HIF-1alpha is essential for myeloid cell-mediated inflammation. Cell. 2003;112(5):645–57.
16 Vergadi E, Chang MS, Lee C, Liang OD, Liu X, Fernandez-Gonzalez A, et al. Early macrophage recruitment and alternative activation are critical for the later development of hypoxia-induced pulmonary hypertension. Circulation. 2011;123(18):1986–95.
17 Albina JE, Henry W, Mastrofrancesco B, Martin B, Reichner JS. Macrophage activiation by culture in an anoxic environment. J Immunol. 1995;(155):4391–6.
18 Scannell G. Leukocyte responses to hypoxic/ischemic conditions. New Horiz. 1996;4(2):179–83.
19 Murata Y, Ohteki T, Koyasu S, Hamuro J. IFN-γ and pro-inflammatory cytokine production by antigen-presenting cells is dictated by intracellular thiol redox status regulated by oxygen tension. Eur J Immunol. 2002;32(10):2866–73.
20 White JR, Harris RA, Lee SR, Craigon MH, Binley K, Price T, et al. Genetic amplification of the transcriptional response to hypoxia as a novel means of identifying regulators of angiogenesis. Genomics. 2004;83(1):1–8.
21 Lund-Olesen K. Oxygen tension in synovial fluids. Arthritis Rheum. 1970;13(6):769–76.
22 Beyer C, Schett G, Gay S, Distler O, Distler JHW. Hypoxia. Hypoxia in the pathogenesis of systemic sclerosis. Arthritis Res Ther. 2009;11(2):220.
23 Wheaton WW, Chandel NS. Hypoxia. 2. Hypoxia regulates cellular metabolism. Am J Physiol Cell Physiol. 2011;300(3):C385–93.
24 Warburg O, Negelein E. On the metabolism of cancer cells. Biochem Z. 1924;152:319–44.
25 Vander Heiden MG, Cantley LC, Thompson CB. Understanding the Warburg effect: the metabolic requirements of cell proliferation. Science. 2009;324(5930):1029–33.
26 Hasselbalch SG, Knudsen GM, Jakobsen J, Hageman LP, Holm S, Paulson OB. Brain metabolism during short-term starvation in humans. J Cereb Blood Flow Metab. 1994;14(1):125–31.
27 Gerich JE. Physiology of glucose homeostasis. Diabetes Obes Metab. 2000;2(6):345–50.
28 Wu GY, Field CJ, Marliss EB. Glutamine and glucose metabolism in rat splenocytes and mesenteric lymph node lymphocytes. Am J Physiol Endocrinol Metab. 1991;260(1):E141–147.
29 Stjernholm RL, Burns CP, Hohnadel JH. Carbohydrate metabolism by leukocytes. Enzyme. 1972;13(1):7–31.
30 Nicoli F, Vion-Dury J, Confort-Gouny S, Maillet S, Gastaut JL, Cozzone PJ. Cerebrospinal fluid metabolic profiles in multiple sclerosis and degenerative dementias obtained by high resolution proton magnetic resonance spectroscopy. C R Acad Sci III. 1996;319(7):623–31.
31 Malloy CR, Thompson JR, Jeffrey FM, Sherry D. Contribution of exogenous substrates to acetyl coenzyme A: measurement by 13C NMR under non-steady-state conditions. Biochemistry. 1990;29(29):6756–61.
32 Lamers RJ, DeGroot J, Spies-Faber EJ, Jellema RH, Kraus VB, Verzijl N, et al. Identification of disease- and nutrient-related metabolic fingerprints in osteoarthritic Guinea pigs. J Nutr. 2003;133(6):1776–80.
33 Kinney JM. Energy metabolism: tissue determinants and cellular corollaries. Raven Press; 1992. p. 562.
34 Wang Z, Ying Z, Bosy-Westphal A, Zhang J, Schautz B, Later W, et al. Specific metabolic rates of major organs and tissues across adulthood : evaluation by mechanistic model of resting energy expenditure 1 – 4. Am J Clin Nutr. 2010;92(4):1369–77.
35 Metsios GS, Stavropoulos-Kalinoglou A, Nevill M, Douglas KMJ, Koutedakis Y, Kitas GD. Cigarette smoking significantly increases basal metabolic rate in patients with rheumatoid arthritis. Ann Rheum Dis. 2008;67(1):70–3.
36 Demas GE, Chefer V, Talan MI, Nelson RJ, Crommenacker JVD, Richardson DS, et al. Metabolic costs of mounting an antigen-stimulated immune response in adult and aged C57BL/6J mice. Am J Physiol. 1997;273(5):R1631–7.
37 Benhariz M, Goulet O, Salas J, Colomb V, Ricour C. Energy cost of fever in children on total parenteral nutrition. Clin Nutr. 1997;16(5):251–5.
38 Romanyukha A, Rudnev SG, Sidorov I. Energy cost of infection burden: an approach to understanding the dynamics of host-pathogen interactions. J Theor Biol. 2006;241(1):1–13.
39 Chioléro R, Revelly JP, Tappy L. Energy metabolism in sepsis and injury. Nutrition. 1997;13(9 Suppl):45S–51S.
40 Hotamisligil GS, Erbay E. Nutrient sensing and inflammation in metabolic diseases. Nat Rev Immunol. 2008;8(12):923–34.
41 Lauridsen MB, Bliddal H, Christensen R, Danneskiold-samsøe B, Bennett R, Keun H, et al. 1H NMR spectroscopy-based interventional metabolic phenotyping: a cohort study of rheumatoid arthritis patients. J Proteome Res. 2010;9(9):4545–53.
42 Molnarfi N, Brandt KJ, Gruaz L, Dayer JM, Burger D. Differential regulation of cytokine production by PI3Kdelta in human monocytes upon acute and chronic inflammatory conditions. Mol Immunol. 2008;45(12):3419–27.
43 Lutz NW, Viola A, Malikova I, Confort-Gouny S, Ranjeva JP, Pelletier J, et al. A branched-chain organic acid linked to multiple sclerosis: first identification by NMR spectroscopy of CSF. Biochem Biophys Res Commun. 2007;354(1):160–4.
44 Chitayat D, Meagher-Villemure K, Mamer OA, O’Gorman A, Hoar DI, Silver K, et al. Brain dysgenesis and congenital intracerebral calcification associated with 3-hydroxyisobutyric aciduria. J Pediatr. 1992;121(1):86–9.
45 Parkes HG, Grootveld MC, Henderson EB, Farrell A, Blake DR, Parke HG, et al. Oxidative damage to synovial fluid from the inflamed rheumatoid joint detected by 1H NMR spectroscopy. J Pharm Biomed Anal. 1991;9(1):75–82.
46 Zhai G, Wang-Sattler R, Hart DJ, Arden NK, Hakim AJ, Illig T, et al. Serum branched-chain amino acid to histidine ratio: a novel metabolomic biomarker of knee osteoarthritis. Ann Rheum Dis. 2010;69(6):1227–31.
47 Marchesi JR, Holmes E, Khan F, Kochhar S, Scanlan P, Shanahan F, et al. Rapid and noninvasive metabonomic characterization of inflammatory bowel disease. J Proteome Res. 2007;6(2):546–51.
48 Lin H-M, Edmunds SI, Helsby NA, Ferguson LR, Rowan DD. Nontargeted urinary metabolite profiling of a mouse model of Crohn’s disease. J Proteome Res. 2009;8(4):2045–57.
49 Griffin JL, Anthony DC, Campbell SJ, Gauldie J, Pitossi F, Styles P, et al. Study of cytokine induced neuropathology by high resolution proton NMR spectroscopy of rat urine. FEBS Lett. 2004;568(1-3):49–54.
50 Bassit R, Sawada L, Bacurau RFP, Navarro F, Martins E, Santos RVT, et al. Branched-chain amino acid supplementation and the immune response of long-distance athletes. Nutrition. 2002;18(5):376–9.
51 Morris SM. Regulation of enzymes of the urea cycle and arginine metabolism. Annu Rev Nutr. 2002;22(58):87–105.
52 Young SP, Wallace GR. Metabolomic analysis of human disease and its application to the eye. J Ocul Biol Dis Infor. 2009;2(4):235–42.
53 Murdoch TB, Fu H, MacFarlane S, Sydora BC, Fedorak RN, Slupsky CM. Urinary metabolic profiles of inflammatory bowel disease in interleukin-10 gene-deficient mice. Anal Chem. 2008;80(14):5524–31.
54 van Erk MJ, Wopereis S, Rubingh C, van Vliet T, Verheij E, Cnubben NHP, et al. Insight in modulation of inflammation in response to diclofenac intervention: a human intervention study. BMC Med Genomics. 2010;3:5.
55 Kaddurah-Daouk R, Baillie R a, Zhu H, Zeng Z-B, Wiest MM, Nguyen UT, et al. Lipidomic analysis of variation in response to simvastatin in the Cholesterol and Pharmacogenetics Study. Metabolomics. 2010;6(2):191–201.
56 Savage DC. Microbial ecology of the gastrointestinal tract. Annu Rev Microbiol. 1977;31(70):107–33.
57 Williams HRT, Cox IJ, Walker DG, North BV, Patel VM, Marshall SE, et al. Characterization of inflammatory bowel disease with urinary metabolic profiling. Am J Gastroenterol. 2009;104(6):1435–44.
58 Brown CT, Davis-Richardson AG, Giongo A, Gano K, Crabb DB, Mukherjee N, et al. Gut microbiome metagenomics analysis suggests a functional model for the development of autoimmunity for type 1 diabetes. PloS One. 2011;6(10):e25792.
59 Wang Z, Klipfell E, Bennett BJ, Koeth R, Levison BS, Dugar B, et al. Gut flora metabolism of phosphatidylcholine promotes cardiovascular disease. Nature. 2011;472(7341):57–63.
60 Weljie AM, Dowlatabadi R, Miller BJ, Vogel HJ, Jirik FR. An inflammatory arthritis-associated metabolite biomarker pattern revealed by 1H NMR spectroscopy. J Proteome Res. 2007;6(9):3456–64.
61 Schmelzer KR, Inceoglu B, Kubala L, Kim IH, Jinks SL, Eiserich JP, et al. Enhancement of antinociception by coadministration of nonsteroidal anti-inflammatory drugs and soluble epoxide hydrolase inhibitors. Proc Natl Acad Sci U S A. 2006;103(37):13646–51.
62 Nuttall SL, Martin U, Sinclair AJ, Kendall MJ. Glutathione: in sickness and in health. Lancet. 1998;351(9103):645–6.