Diagnosis of hypersplenism with the epinephrine stimulation test
DOI: https://doi.org/10.4414/smw.2012.13324
B
Misselwitz, EB
Bachli, P
Kaiser, JS
Goede
Summary
PRINCIPLES: Hypersplenism can be defined by thrombocytopenia and/or neutropenia resulting from blood cell sequestration in an enlarged spleen. In multimorbid patients the differential diagnosis of cytopenia is challenging and currently there is no established test for diagnosing hypersplenism.
METHODS: The epinephrine stimulation test (EST) measures changes in platelets, neutrophil counts and spleen size following a subcutaneous epinephrine injection. We retrospectively analysed the results of EST in 228 patients.
RESULTS: Increases in neutrophils and platelets after epinephrine injection were significantly greater in patients with enlarged than in patients with normal size spleens. Using cutoffs of low, intermediate and high confidence EST was positive in 69.8% vs. 41.3% (low confidence), 49.6% vs. 17.4% (intermediate confidence) and 38.8% vs. 10.9% (high confidence) in patients with enlarged vs. normal size spleens. Changes in platelet and neutrophil counts correlated with each other and with changes in spleen size, confirming cell release from the spleen during EST. When stratified according to the underlying diagnosis, patients with liver disease had the strongest response to EST, patients with malignant haematological diseases the weakest. In addition the response to EST was significantly related to changes in platelet and neutrophil counts after splenectomy, confirming the validity of our test. No serious side effects occurred during EST.
CONCLUSION: When used in a large patient cohort, EST is a safe and simple diagnostic test. In this exploratory study EST is of value in evaluating patients with cytopenia and a positive EST argues strongly for hypersplenism. Future studies should prospectively evaluate EST for the management of patients with splenomegaly.
23 years of experience at a tertiary care hospital
Abbreviations
EST: Epinephrine stimulation test
HCL: Hairy cell leukaemia
HIV: Human immunodeficiency virus
ITP: Immune thrombocytopenia
RFA: Radiofrequency ablation
Introduction
Splenic cytopenia refers to any cytopenia with a pathogenesis involving the spleen. Whereby the spleen could either actively degrade or sequester blood cells. For the latter mechanism the term hypersplenism is commonly used. Hypersplenism can be defined by thrombocytopenia and/or neutropenia resulting from blood cell sequestration in an enlarged spleen. In some cases hypersplenism may also be responsible for mild anaemia [1–3].
The vessel system of an enlarged spleen can be of considerable size. Even under normal conditions some 30% of platelets are stored within the spleen. In hypersplenism this may increase to 90% [4, 5]. Importantly, platelets sequestered within the spleen have a normal survival time [4, 5]. Pooling of neutrophils has also been suggested to occur in an enlarged spleen [6–8]. In the absence of other pathologies the bone marrow is expected to be normal or hyperregenerative.
Evaluation of cytopenia in patients with an enlarged spleen can be challenging and complex. Cytopenia may be due to hypersplenism, but patients typically also suffer from an underlying disease which could directly lead to cytopenia. In addition, treatment may include drugs with haematological side effects. For example, in patients with liver cirrhosis due to hepatitis C virus infection, thrombocytopenia may be due to hypersplenism, impaired platelet production, the chosen antiviral therapy and/or secondary conditions including haemophagocytosis.
Therefore a simple diagnostic test to establish or rule out hypersplenism would be beneficial. Initial studies to evaluate splenic sequestration have been done more than four decades ago [4]. Subsequently the epinephrine stimulation test (EST), measuring changes in neutrophil and platelet counts after subcutaneous injection of epinephrine in patients with suspected hypersplenism, was developed [9]. For neutrophils but not platelets an increase after epinephrine injection could also be due to demargination, redistribution of neutrophils from the vessel wall to the circulation. However, Schaffner et al. used the EST to demonstrate a relationship between the haematological response to epinephrine injection and splenic contraction [8, 10]. In the last 23 years EST has been a standard diagnostic procedure to evaluate thrombocytopenia and/or neutropenia in patients with an enlarged spleen in our tertiary care hospital. In this study we summarise our experience with EST and provide data of 228 patients evaluated by this procedure. Within the limits of a retrospective analysis we set out to explore the value of EST in predicting splenic sequestration of platelets and neutrophils, and for the diagnosis of hypersplenism.
Patients and methods
At our clinic between 1984 and 2006, 232 EST were carried out in 228 patients. EST was performed as published before [9]. In brief: after determination of baseline blood count and spleen pole diameter using ultrasound technique, 0.5 mg epinephrine per m2 body surface area was injected subcutaneously in the volar forearm. After epinephrine administration spleen size was reassessed at 10 min and another blood count was taken at 30 min. Percent changes over baseline measurements in spleen size and blood count were calculated. Criteria of low, intermediate and high confidence were defined. The criterion for platelets was considered positive if in a thrombocytopenic patient an increase of 30%, 40% or 50% above baseline was observed. Similarly, the test criterion for neutrophils was regarded as positive if in a neutropenic patient an increase of 60%, 100% or 150% was observed. EST was performed by this standardised protocol on a routine basis in our outpatient clinic. Indications for EST were workup of patients with low platelet count and/or neutropenia with suspected hypersplenism or evaluation before splenectomy.
We retrospectively defined the following diagnostic groups for further analysis: 1) unclear cytopenia (53 patients, 23%), 2) liver disease (n = 56; 25%), 3) malign haematological diseases (n = 63; 28%) including hairy cell leukaemia (HCL; n = 35, 15%), 4) benign haematological diseases (n = 28; 12%) including immune thrombocytopenia (ITP, n = 21; 9%), 5) human immunodeficiency virus (HIV) infection (n = 16; 7%), 6) autoimmune diseases (n = 10; 4%) and 7) other conditions (2 patients, 1%).
Patients were also analysed according to spleen size. Thus the splenomegaly group included patients with a documented spleen diameter of 13 cm or more (120 patients) or a documented “large” or “huge” spleen size without specifications (9 patients). Similarly, the group with a normal spleen size included patients with a spleen diameter of less than 11.5 cm (32 patients) or a documented “normal” size spleen without specific information (2 patients). These strict criteria for normal and large spleen size were chosen since measurements of spleen size in more than one dimension and data for height and weight of patients were not available in most cases. However, an analysis using 12 cm as a lower cutoff yielded essentially identical results (not shown).
Data of 23 patients were used to analyse blood counts before and after splenectomy,. For these patients, 2 blood counts at least 2 months apart within the first 3 months after splenectomy were available (in this data set blood counts of 3 single time points were missing). Platelet and neutrophil counts at both time points were highly correlated (R2= 0.51 for neutrophils and 0.44 for thrombocytes, respectively in a linear regression analysis, Microsoft Excel). Therefore, an average of both values was calculated. Eight patients with ITP were excluded from the analysis of platelet and neutrophil counts after splenectomy.
For statistical calculations and graphs GraphPad Prism 5 was used. If not indicated otherwise, for correlation analysis Spearman’s rank correlation coefficients were calculated. For groupwise comparisons the Mann-Whitney-U test or, where appropriate, for a pairwise analysis the Wilcoxon signed rank test was used. For comparison of test results in different patient groups Fisher’s exact test was used. An accurate estimation of splenic size requires sonographic measurements in three dimensions [11]. These data were not available in all cases. Hence to estimate changes in spleen volume we used the difference of the third power of splenic length at time points 0 min and 10 min as an approximation. Since the calculation of Spearman’s rank correlation coefficients only uses the ranks of measurements, an exact volume is not needed for a valid correlation analysis. Retrospective data collection was done in agreement with institutional policies and ethical guidelines of our institution (University Hospital of Zürich).
Results
Patient population
Our study summarises experience with EST in a large and diverse patient cohort. In the course of 23 consecutive years we performed 232 EST in 228 patients: 59% of our patients were male; the age range of our study population was 17–86 years. As shown in table 1, most of our patients presented with splenomegaly, anaemia and thrombocytopenia; a considerable fraction also had neutropenia. Patients presented with various conditions including undefined cytopenias (23%), benign or malign haematological diseases (28%), liver disease (25%) and HIV infection (7%). Our patient cohort is comparable to patients of a large retrospective study at another tertiary care centre [12] identifying haematological (57%), hepatic (11%) and infectious conditions (19%) as the most frequent causes of splenomegaly.
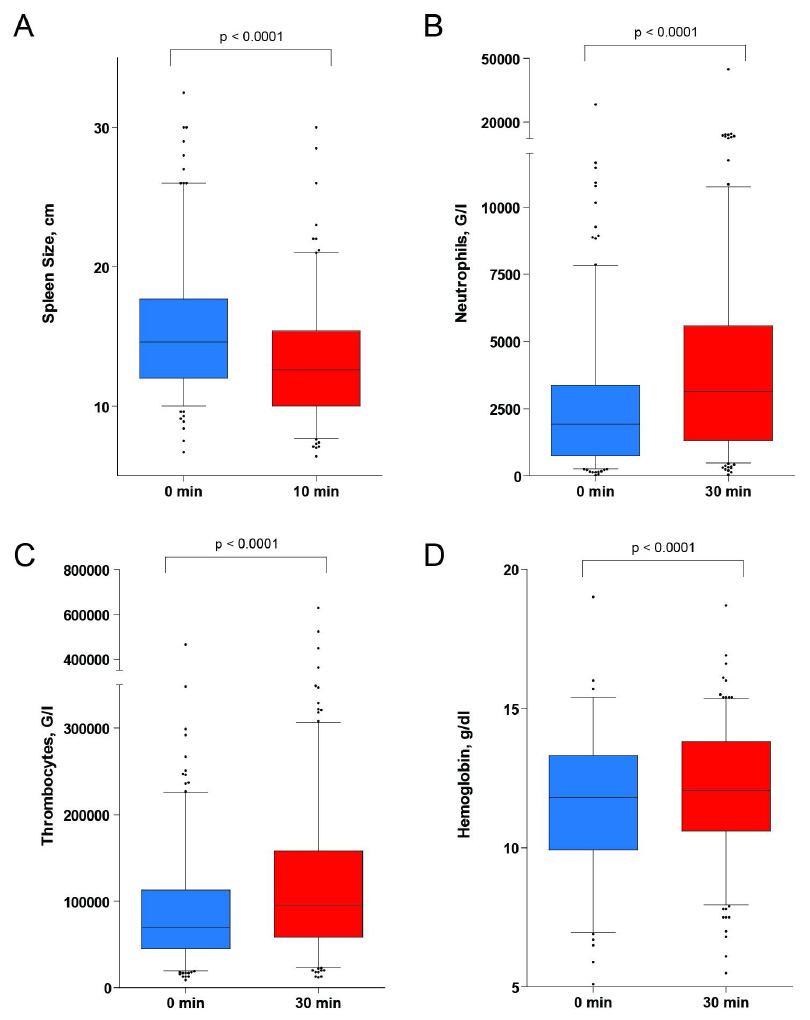
Figure 1
Changes in spleen size and peripheral blood count during epinephrine stimulation test (EST). Peripheral blood count and spleen pole diameter were determined before and at 30 min or 10 min following epinephrine injection respectively. The box plot indicates the median and the 25th and 75th percentile of the data respectively. The whiskers represent the 5th and 95th percentile; outliers are directly shown. Statistical analysis: Wilcoxon signed rank test.
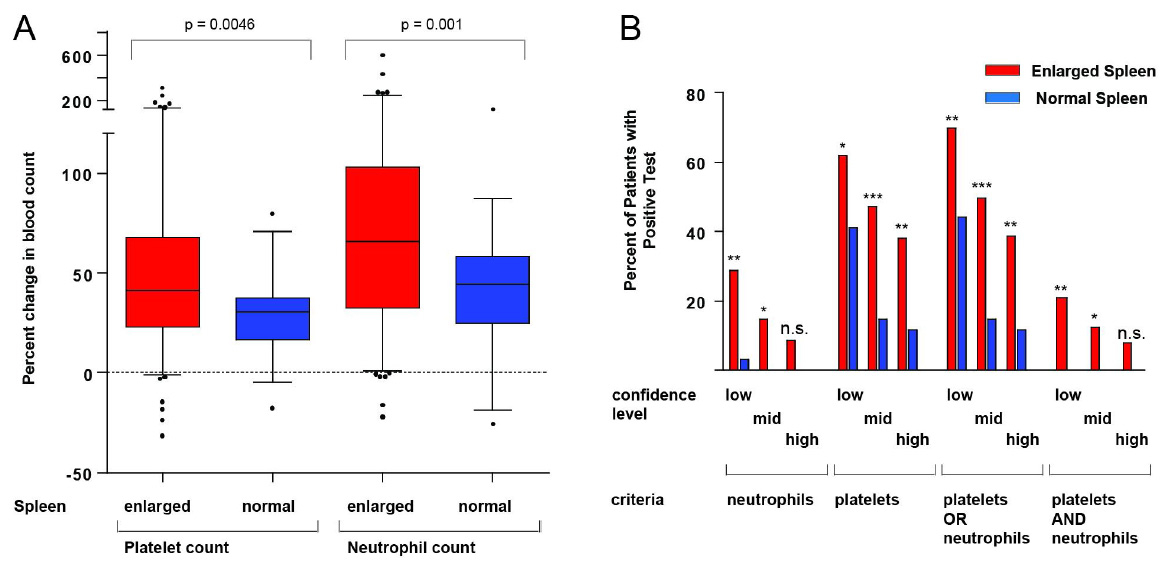
Figure 2
A: Changes in platelet and neutrophil counts in patients according to spleen pole diameter. Statistical analysis: Mann Whitney U test; box plot and whiskers as described in the legend for figure 1. B: Higher frequency of positive tests in patients with an enlarged spleen compared to patients with a normal size spleen. Different criteria for the evaluation of EST were defined requiring either neutrophils, platelets, one of each (“platelets OR neutrophils”) or both (“platelets AND neutrophils”) to be above the respective cutoff. Limits of low, intermediate ("mid") and high confidence of the test were defined: For platelets an increase of 30%, 40% or 50% respectively was chosen. For neutrophil counts these values were 60%, 100% or 150% respectively. Significance was calculated using Fisher’s exact test.
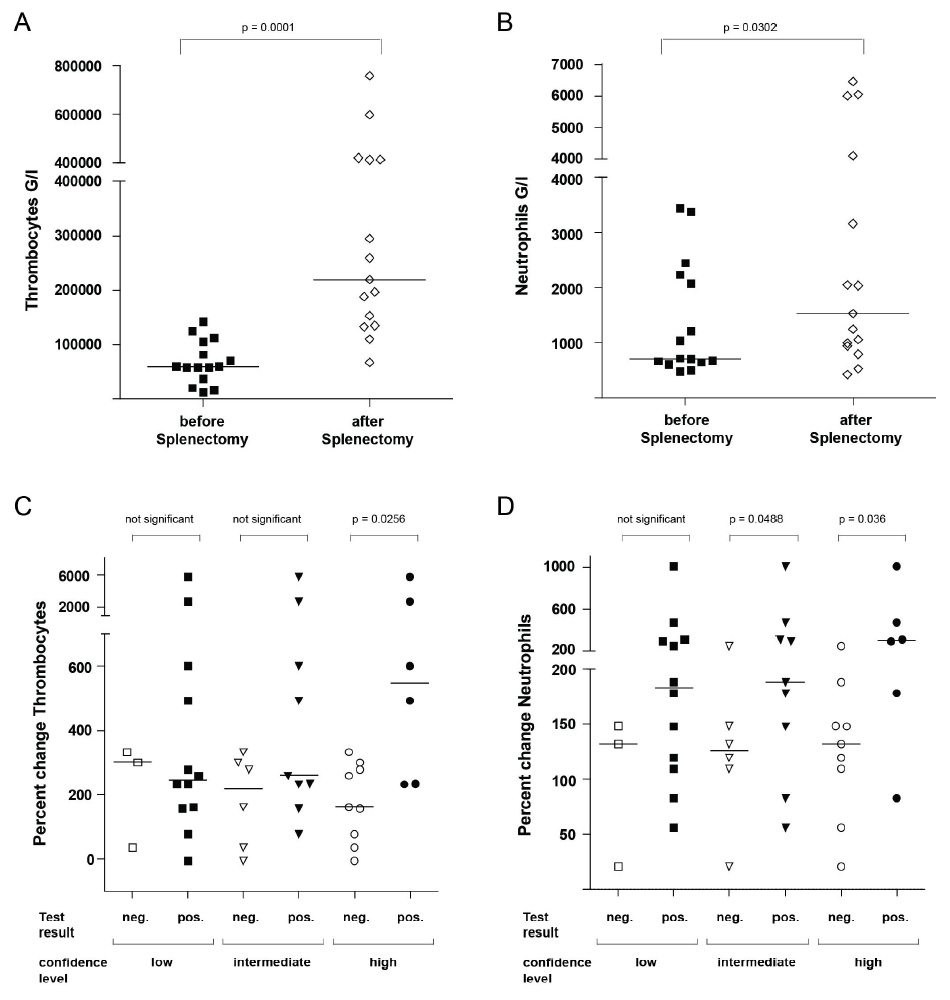
Figure 3
Platelet and neutrophil counts before and after splenectomy according to results of EST. A, B: Thrombocyte and neutrophil counts before and after splenectomy. C, D: Percent change in thrombocyte and neutrophil counts after splenectomy according to the result of EST at different confidence levels. The horizontal lines in the graphs indicate the median of the respective data shown. Significance was calculated using the Wilcoxon signed rank test (A, B) or Mann Whitney U test (C, D) respectively.
Side effects of EST
EST was well tolerated and no patient had to be hospitalised due to side effects. Unwanted effects of the epinephrine injection occurred only rarely (9 patients, 3.9% of all EST). We observed elevated blood pressure in 6 cases (2.6% of all EST), headaches in 4 cases (1.7%), anxiety in 3 cases (1.3%), palpitations in 2 cases (0.9%), nausea in 1 case (0.4%) and chest pain in 1 case (0.4%). In all patients symptoms responded immediately to phentolamine treatment. In one of these patients (0.4% of all EST) epinephrine had been accidentally injected intravenously, leading to nausea, headache, palpitations and elevated blood pressure. Symptoms in this patient also responded promptly to phentolamine and did not require hospitalisation. Our data therefore confirm EST as a safe diagnostic procedure which can be performed in patients with various diseases and in an outpatient clinic.
Changes in spleen size and blood count during EST
During EST changes in spleen size, platelet, and neutrophil counts as well as haemoglobin values were routinely assessed according to our standardised protocol. The pole diameter of the spleen was measured before the test and at the 10-minute time point. As expected, pole diameter of the spleen significantly decreased, on average by 2.2 cm, during EST (fig. 1A). Simultaneously, neutrophil and thrombocyte counts increased significantly, on average by 86% and 43% over baseline values respectively (fig. 1B, C). We also noted a small increase in haemoglobin concentration by 4.2% over baseline values (fig. 1D). Taken together, our data are consistent with the assumption that platelets and neutrophils are recruited from the spleen after epinephrine stimulation.
Changes in spleen size during EST correlated significantly with changes in neutrophil and platelet counts (table 2). This correlation was more pronounced when instead of the pole diameter estimated changes of the spleen volume were correlated with neutrophil and platelet responses. Our data therefore suggest that improvements in blood counts are mediated by a decrease in spleen volume.
Different responses of EST according to spleen size
Not surprisingly, responses of EST differed according to spleen size (fig. 2A). Our patient cohort mainly comprises patients with enlarged spleens; however, patients with normal spleen sizes were also tested. EST in the latter patients might have been ordered by the responsible physician to evaluate the possibility of platelet or neutrophil trapping in a normal size spleen as a cause of cytopenia. We defined a patient group with a normal size spleen (diameter <11.5 cm) and a patient group with splenomegaly (diameter ≥13 cm). These strict criteria were chosen for an optimal separation of both patient groups. Our control group comprised patients with unclear cytopenia (n = 12; 35%), ITP (n = 12; 35%), liver disease (n = 5; 15%), autoimmune diseases (n = 3; 9%) as well as HIV and lymphoma (1; 3% each). The splenomegaly group summarizes patients with liver disease (n = 38; 29%), malign haematological disorders (n = 42; 33%, including 26 patients with hairy cell leukaemia), unclear cytopenia (n = 24; 19%), HIV (n = 15; 12%), benign haematological disorders (n = 7; 5%, including 4 patients with ITP), autoimmune disease (n = 2; 2%) and other conditions (n = 1; 1%).
We compared relative changes in cell counts in both patient groups during EST and noted a significantly stronger platelet and neutrophil response for splenomegaly patients compared to patients with a normal spleen size (p = 0.0046 and p = 0.001, respectively, fig. 2A).
Different confidence levels of EST
Due to lack of a gold standard we tried an internal validation of EST, using the splenomegaly group as the test group and patients with normal size spleen as a control group. Patients with a normal size spleen per definition would not have hypersplenism. In a broader sense these patients would have a low probability of a true positive test. In contrast, the group of patients with an enlarged spleen would have a higher likelihood of a true positive test. A high ratio of the percentage of positive tests in patients with a large spleen to the percentage of positive tests in patients with normal size spleens would indicate a good discrimination of both groups, suggesting high specificity of the test.
We defined cutoff criteria of low, intermediate and high confidence for a positive EST (fig. 2B). The limits for increases in platelet and neutrophil counts of low confidence were 30% and 60%, of intermediate confidence 40% and 100% and of high confidence 50% and 150% respectively. We further combined these criteria in two different ways, requiring either only one (“platelets OR neutrophils”) or both values (“platelets AND neutrophils”) to be above the cutoff value.
As shown in figure 2B, for all cutoff criteria the fraction of positive test results for patients with an enlarged spleen was consistently higher than for patients with a normal size spleen. In most instances, differences reached statistical significance; the only exceptions were several criteria of high confidence for which the small number of positive tests precluded significance even though in the control group no patient tested positive.
An increase in platelet counts above the respective cutoff levels was frequently observed in splenomegaly patients, consistent with a high sensitivity of this criterion. However, the high number of positive tests at least for the low confidence evaluation suggests a limited specificity. In contrast, positive test results for changes in neutrophils occurred infrequently in patients with normal size spleens.
Generally, choosing the stricter criteria of higher confidence improved discrimination of both groups (indicating an improved specificity). This improvement was most pronounced for increases in thrombocytes for which positive results were observed in 62% vs. 41% (low confidence), 47% vs. 15% (intermediate confidence) and 38% vs. 12% (high confidence) of patients with enlarged and normal spleens, respectively.
In our evaluation, for the most stringent mode of analysis a high specificity is likely since an increase of both, thrombocytes and neutrophils above cutoff occurred in 21%, 12% and 8% of patients with splenomegaly but in no patient with a normal spleen (“platelets AND neutrophils” in fig. 2B). However, strict criteria might also decrease the sensitivity of our test, as indicated by the low number of positive tests in patients with large spleens under these conditions.
In our clinical practice and in the following evaluations we required only one criterion to be above the threshold (evaluation “platelets OR neutrophils” in fig. 2B). In our patient cohort EST was thus positive in 69.8% vs. 41.3% (low confidence), 49.6% vs. 17.4% (intermediate confidence) and 38.8% vs. 10.9% (high confidence) in patients with enlarged vs. normal size spleen.
Response of EST in different diagnosis subgroups
Stratifying splenomegaly patients according to the underlying diagnosis revealed important differences between specific patient groups (table 3). For patients with splenomegaly and liver disease EST was significantly more often positive than for the remaining splenomegaly patients at all confidence levels (low confidence: 87% vs. 63%, p = 0.0063; intermediate confidence: 71% vs. 41%, p = 0.002; high confidence: 58% vs. 31%, p = 0.0054). Moreover, in patients with liver disease the correlation of changes in spleen volume vs. changes in platelets (r = 0.52, p <0.0005) and neutrophils (r = 0.47, p <0.002) was more pronounced than in the whole patient group (compare table 2). We conclude that haematological abnormalities in hypersplenic patients with liver diseases were especially responsive to epinephrine.
In contrast, in the subgroup of patients with splenomegaly and malign haematological disorders or hairy cell leukaemia, EST was significantly less often positive (table 3). Importantly, an analysis of the frequency of positive tests in diagnostic subgroups yielded similar differences if all patients including patients with normal size spleen were considered. However, significance levels tended to be lower, probably due to contamination of patients with a normal size spleen and negative test results (table S1).
Validation of EST in patients undergoing splenectomy
Haematological changes after splenectomy would be an independent validation of EST. 23 patients were evaluated with EST before splenectomy. 8 patients with ITP were excluded since splenectomy is a known treatment for ITP and would be expected to increase platelet counts independently of effects on splenic platelet sequestration. For the remaining patients, blood counts before and after splenectomy were compared (for details see Patients and Methods section). As expected, splenectomy caused a strong and significant increase in platelet and neutrophil counts (p = 0.0001, p = 0.03, respectively; fig. 3A, B).
EST results were predictive of increases in neutrophil and platelet counts after splenectomy. We stratified patients according to EST results (fig. 3C, D). With the least stringent criteria for EST evaluation, we did not notice any differences between patients with positive and negative EST. In contrast, with criteria of high confidence, patients with positive test results showed stronger improvement in cell counts than patients with negative test results. This increase was significant for changes in platelet counts (p = 0.0256) and neutrophils (p = 0.036). Significance also remained intact in the whole splenectomy group including the 8 patients with ITP (data not shown). Using criteria of intermediate confidence, significant differences were only observed for changes in neutrophil counts (p = 0.0488). Taken together, EST results are significantly related to changes in cell counts after splenectomy.
|
Table 1: Clinical presentation of patients with splenomegaly, normal size spleen and the whole patient cohort evaluated by the epinephrine stimulation test: spleen size and peripheral blood count before epinephrine stimulation test. Our patient cohort also comprised 27 patients with borderline size spleen (≥11.5 cm but <13 cm) as well as 38 patients without documented spleen size. |
|
Spleen size
|
Splenomegaly
≥13 cm
n = 129
|
Normal
<11.5 cm
n = 34
|
All
n = 228
|
| Haemoglobin values
Anaemia
(<11.7 g/dL in ♀ or <13.4 g/dL in ♂)
Normal
Not documented |
87
35
7 |
10
21
3 |
132
80
16 |
| Thrombocytes
Thrombocytopenia (<150000 G/L)
Thrombocytosis (>450000 G/L)
Normal values |
122
0
7 |
25
0
9 |
195
1
32 |
| Neutrophiles
Neutropenia (<1500 G/L)
Neutrophilia (>8500 G/L)
Normal values |
60
2
67 |
9
4
21 |
97
10
121 |
|
Table 2: Correlation analysis of percent changes in platelet, neutrophil and spleen parameters. Significant differences are indicated in green (p <0.05), very significant differences in red (p <0.01); Spearman's rank correlation test. |
| |
Percent change in platelet count
|
Percent change in neutrophil count
|
| Percent change of neutrophil count |
r = 0.65
p <0.0001
|
|
| Spleen length |
r = 0.19
p = 0.01
|
r = 0.28
p = 0.0001
|
| Change in spleen length |
r = 0.18
p = 0.023
|
r = 0.25
p = 0.0017
|
| Approximate change in spleen volume |
r = 0.22
p = 0.0063
|
r = 0.31
p <0.0001
|
|
Table 3: Positive tests in different diagnosis groups. Patients were analysed according to their underlying diagnosis. The percentage of patients with splenomegaly is given; the subsequent analysis is restricted to these splenomegaly patients. For each level of confidence the number of positive tests is given and significance of any difference versus the remaining patient population calculated (Fisher’s exact test). Significant differences are indicated in green (p <0.05), very significant differences in red (p <0.01). |
|
|
All patients
|
Splenomegaly patients
|
|
|
|
Splenomegaly
|
Positive low
confidence
|
Positive intermediate
confidence
|
Positive
high
confidence
|
| |
n |
n |
n |
n |
n |
| All |
228 |
129; 57% |
90; 70% |
64; 50% |
50; 39% |
| Malignant
haematological |
63 |
42
67% |
24; 57%
p = 0.041 |
15; 36%
p = 0.039 |
9; 21%
p = 0.0066 |
| HCL
subgroup |
35 |
26
74% |
14; 54%
n.s. |
8; 31%
p = 0.047 |
4; 15%
p = 0.0066 |
| Liver disease |
56 |
38
68% |
33; 87%
p = 0.0063 |
27; 71%
p = 0.002 |
22; 58%
p = 0.0054 |
|
Table S1: Positive tests in different diagnosis groups. Patients were analysed according to their underlying diagnosis in a similar analysis to that presented in table 3; however, the whole patient population, including patients with normal size spleens, was considered. For each level of confidence the number of positive tests is given and significance of any difference versus the remaining patient population calculated (Fisher’s exact test). Significant differences are indicated in green (p <0.05), very significant differences in red (p <0.01). |
|
|
|
Positive
low
confidence
|
Positive intermediate
confidence
|
Positive
high
confidence
|
|
|
Number
|
n; %
|
n; %
|
n; %
|
| All |
228 |
138; 61% |
87; 38% |
67; 29% |
| Malignant
hematological |
63 |
37 59%
n.s. |
19; 30%
n.s. |
12; 19%
n.s. |
| HCL
subgroup |
35 |
19; 54%
n.s. |
9; 26%
n.s. |
4; 11%
n.s. |
| Liver disease |
56 |
41; 73%
p = 0.028 |
33; 59%
p = 0.0004 |
26; 46%
p <0.0001 |
Discussion
The current study summarises 23 years of experience with the epinephrine stimulation test at our institution. We provide clinical, sonographic and haematological data for 228 patients. Seminal studies of EST were done up to 30 years ago with very small patient cohorts [8, 10]. Our data now provide a detailed analysis of a much larger patient cohort.
Our data confirm and extend our knowledge of hypersplenism. Hypersplenism does not translate into dramatic histopathological findings [13], and physiological studies are required to clarify pathogenesis. Previously, a negative correlation of spleen size and haematological parameters has been observed in various settings, e.g. in Gaucher’s disease [14] and liver cirrhosis [15]. In our study, changes in blood cell counts correlate with changes in spleen diameter [10] and correlate even more strongly with estimated changes in spleen volume after epinephrine injection, suggesting the spleen as the source for the release of neutrophils and platelets.
Epinephrine also leads to demarginalisation of granulocytes from the walls of blood vessels. However, in our study an increase in neutrophil counts above cutoff levels was only infrequently observed in the patient group with a normal size spleen, making it unlikely that demarginalisation contributes in a major way to a positive EST result. Furthermore, in our analysis, changes in thrombocyte and granulocyte values showed a strong correlation, consistent with a common mechanism for the increase of both cell types after epinephrine injection [10]. However, since the majority of all patients and even 53% of patients with splenomegaly did not present neutropenia at baseline, hypersplenism might affect the thrombocyte count more strongly than the neutrophil count. Nevertheless, the study thus confirms the view that a reserve pool of thrombocytes and granulocytes exists which is larger in hypersplenism and stored to a considerable degree in the spleen [10]. Epinephrine injection in turn causes splenic contraction and release of thrombocytes and neutrophils.
Our results are important in the light of more recent reports which emphasise the role of thrombopoietin for thrombocytopenia in splenomegaly due to liver disease [1]. Our data do not exclude a role for haematopoietic growth factors, but offer further evidence that splenic sequestration makes a relevant contribution to the pathogenesis of thrombocytopenia in splenomegaly, most probably as one aspect of a multifactorial disease.
Compared to other diagnosis groups, EST was most frequently positive in patients with liver disease. In this situation splenomegaly results from increased portal pressure and venous stasis in the spleen. These changes of portal and splenic blood flow are probably important, since epinephrine-dependent changes were less pronounced in malignant haematological diseases when the spleen is infiltrated with leukaemia or lymphoma cells. It is likely that the latter process leads to a decrease in the intravascular volume of the otherwise enlarged spleen and a less pronounced response of EST, as indicated by the lesser frequency of pathological EST results in patients with malignant haematological diseases, including HCL (table 3).
Hypersplenism is known to be an important aspect of liver disease and has prognostic significance for survival [16]. Hypersplenism in this context could be reversed by splenectomy or orthotopic liver transplantation [17] but also attenuated by placement of a transjugular intrahepatic portosystemic shunt [18, 19] or by partial splenic embolisation [20–23]. In a recent randomised controlled trial comparing splenectomy and radiofrequency ablation (RFA) [24] a similar correction of blood counts in the RFA group compared to the splenectomy group was observed if more than 70% of the splenic volume was ablated. Future management of thrombocytopenia in liver disease might be oriented towards the contribution of pathogenetic factors such as splenic sequestration or thrombopoietin deficiency [25]. Thereby, a role of EST for the selection of patients for different therapeutic interventions could be tested.
We propose different cutoff values for EST defined by comparing platelet and neutrophil changes for patients with normal and enlarged spleens. It is important to note that an increase in neutrophils above cutoff levels was infrequently observed in the control group with a normal size spleen, suggesting a high specificity of this criterion. However, an increase in platelets after epinephrine injection was also observed in patients without splenomegaly (even though less frequently), indicating the less than optimal specificity of this criterion. We can think of two reasons for such false positive tests: i) significant trapping and release of blood cells may also occur in a normal size spleen; this would not constitute hypersplenism, since the diagnostic criterion of splenomegaly would be missing but might have the same haematological consequences; ii) individual physiological reactions of a normal spleen to epinephrine might vary; we are currently unable to distinguish between the two possibilities.
We independently confirmed cutoff values and validity of EST using data of patients who underwent splenectomy. Splenectomy can correct cytopenia due to hypersplenism [26, 27]. As expected of a diagnostic test for hypersplenism, increases in platelets and neutrophils after splenectomy were more marked in patients with positive test results if strict diagnostic criteria were used.
Our study has several strengths but also important limitations. The strength of our study is the large patient population, which compares favourably with former studies of fewer than 20 patients [8, 10]. Importantly, the size and diversity of our patient cohort, which includes many age groups and underlying diseases, allows us to conclude that EST is a safe diagnostic procedure. Furthermore, there has been a paucity of publications addressing diagnostic procedures of hypersplenism, and diagnostic alternatives to EST are lacking.
A limitation of our study is the retrospective study design. Diagnostic criteria for a positive test were also retrospectively defined. Historical cutoff values for EST were established in a small cohort of healthy patients, which might not be representative of patients with cytopenia not due to hypersplenism. For these reasons our results require prospective validation in a new patient group. Also, the majority of the whole patient population and even the majority of patients with an enlarged spleen had normal baseline neutrophil values. This reflects either a referral bias or a (in our opinion more likely) lower risk of neutropenia in hypersplenic patients. In any case, fewer data are available within our cohort for evaluation of EST for the diagnosis of hypersplenic neutropenia. Another important limitation is the lack of an accepted diagnostic gold standard for hypersplenism. Hence no numbers for sensitivity and specificity of EST can be calculated, making a quantitative interpretation of EST difficult. A third limitation is the partially incomplete data set, with documentation of spleen diameters in 38 (16.7%) of patients missing. However, due to the large number of remaining patients, this incomplete reporting is unlikely to change our analysis. Finally, even though our patient cohort is large, for some diagnostic subgroups and for the analysis of patients undergoing splenectomy the numbers are small and the heterogeneity of the study population remains a concern.
In our clinical experience during the last 23 years EST has been useful on many occasions. EST was employed for exclusion of predominant hyporegenerative thrombocytopenia in the setting of e.g. an HIV-infected patient with highly active antiretroviral therapy, or in a patient with liver disease under drug treatment. In several of these cases a strong EST response allowed the patient to be managed without bone marrow examination. However, considering the above-mentioned limitations of our study EST should always be considered as one piece in a diagnostic puzzle and interpreted within the clinical context.
Whether thrombocytopenia due to hypersplenism confers a lesser bleeding risk than thrombocytopenia in a different setting is unknown. According to older data, thrombocytes sequestered within the enlarged spleen are available, functionally active and in equilibrium with the pool of freely circulating platelets [4, 10]. Recruitment of these platelets to the circulation during a critical bleeding episode would be expected. It was speculated that EST would simulate the stress of a shock situation since changes in thrombocytes and granulocytes after EST closely resemble changes during physical exercise [8]. However, neither older studies nor our data directly address the risk of bleeding and a predictive value of EST results for future bleeding episodes has not been demonstrated.
In conclusion, for the management of a patient with splenomegaly the lack of an established test directly measuring splenic sequestration is a major clinical limitation. We believe this question should be addressed in a systematic prospective trial which should include EST, scintigraphy studies of radiolabelled thrombocytes, bone marrow examinations and measurements of haematopoietic growth factors. Moreover, long term follow-up data of these patients should be acquired. So while our data do not close the gap for the diagnosis of hypersplenism, they provide the basis for a better study of this condition.
Acknowledgements:The authors would like to thank Balamurugan Periaswamy for help with the statistical analysis and Silke Misselwitz for help with the figures.
Funding / potential competing interests: No financial support and no other potential conflict of interest relevant to this article was reported.
References
1 Peck-Radosavljevic M. Hypersplenism. Eur J Gastroenterol Hepatol. 2001;13(4):317–23.
2 Bowdler AJ. Splenomegaly and hypersplenism. Clin Haematol. 1983;12(2):467–88.
3 Greer JP, Foerster J, Rodgers GM, Paraskevas F, Glader B, Arber DA, et al. Winthrobe’s Clinical Hematology, 12th edition. 2009.
4 Aster RH. Pooling of platelets in the spleen: role in the pathogenesis of “hypersplenic” thrombocytopenia. J Clin Invest. 1966;45(5):645–57.
5 Martin DW, Woeber KA, Smith LH. Hypersplenism. Calif Med. 1973;118(1):24–9.
6 Brubaker LH, Johnson CA. Correlation of splenomegaly and abnormal neutrophil pooling (margination). J Lab Clin Med. 1978;92(4):508–15.
7 Bishop CR, Rothstein G, Ashenbrucker HE, Athens JW. Leukokinetic studies. XIV. Blood neutrophil kinetics in chronic, steady-state neutropenia. J Clin Invest. 1971;50(8):1678–89.
8 Schaffner A, Fehr J. Granulocyte demargination by epinephrine in evaluation of hypersplenic states. Scand J Haematol. 1981;27(4):225–30.
9 Fehr J, Grossmann HC. Disparity between circulating and marginated neutrophils: evidence from studies on the granulocyte alkaline phosphatase, a marker of cell maturity. Am J Hematol. 1979;7(4):369–79.
10 Schaffner A, Augustiny N, Otto RC, Fehr J. The hypersplenic spleen. A contractile reservoir of granulocytes and platelets. Arch Intern Med. 1985;145(4):651–4.
11 Downey MT. Estimation of splenic weight from ultrasonographic measurements. Can Assoc Radiol J. 1992;43(4):273–7.
12 O’Reilly RA. Splenomegaly in 2,505 patients at a large university medical center from 1913 to 1995. 1963 to 1995: 449 patients. West J Med. 1998;169(2):88–97.
13 Kraus MD. Splenic histology and histopathology: an update. Semin Diagn Pathol. 2003;20(2):84–93.
14 Gielchinsky Y, Elstein D, Hadas-Halpern I, Lahad A, Abrahamov A, Zimran A. Is there a correlation between degree of splenomegaly, symptoms and hypersplenism? A study of 218 patients with Gaucher disease. Br J Haematol. 1999;106(3):812–.
15 Shi BM, Wang XY, Mu QL, Wu TH, Xu J. Value of portal hemodynamics and hypersplenism in cirrhosis staging. World J Gastroenterol. 2005;11(5):708–11.
16 Liangpunsakul S, Ulmer BJ, Chalasani N. Predictors and implications of severe hypersplenism in patients with cirrhosis. Am J Med Sci. 2003;326(3):111–6.
17 Chikamori F, Nishida S, Selvaggi G, Tryphonopoulos P, Moon JI, Levi DM, et al. Effect of liver transplantation on spleen size, collateral veins, and platelet counts. World J Surg;34(2):320–6.
18 Pursnani KG, Sillin LF, Kaplan DS. Effect of transjugular intrahepatic portosystemic shunt on secondary hypersplenism. Am J Surg. 1997;173(3):169–73.
19 Alvarez OA, Lopera GA, Patel V, Encarnacion CE, Palmaz JC, Lee M. Improvement of thrombocytopenia due to hypersplenism after transjugular intrahepatic portosystemic shunt placement in cirrhotic patients. Am J Gastroenterol. 1996;91(1):134–7.
20 Zhu K, Meng X, Li Z, Huang M, Guan S, Jiang Z, et al. Partial splenic embolization using polyvinyl alcohol particles for hypersplenism in cirrhosis: a prospective randomized study. Eur J Radiol. 2008;66(1):100–6.
21 Lee CM, Leung TK, Wang HJ, Lee WH, Shen LK, Liu JD, et al. Evaluation of the effect of partial splenic embolization on platelet values for liver cirrhosis patients with thrombocytopenia. World J Gastroenterol. 2007;13(4):619–22.
22 Wang HY, Shih SC, Lin SC, Chang WS, Wang TE, Lin FJ, et al. Partial splenic embolization: 12-month hematological effects and complications. Hepatogastroenterology. 2008;55(86-87):1838–42.
23 Hayashi H, Beppu T, Masuda T, Mizumoto T, Takahashi M, Ishiko T, et al. Predictive factors for platelet increase after partial splenic embolization in liver cirrhosis patients. J Gastroenterol Hepatol. 2007;22(10):1638–42.
24 Feng K, Ma K, Liu Q, Wu Q, Dong J, Bie P. Randomized clinical trial of splenic radiofrequency ablation versus splenectomy for severe hypersplenism. Br J Surg. 2011;98(3):354–61.
25 Afdhal N, McHutchison J, Brown R, Jacobson I, Manns M, Poordad F, et al. Thrombocytopenia associated with chronic liver disease. J Hepatol. 2008;48(6):1000–7.
26 Blendis LM, Clarke MB, Williams R. Effect of splenectomy on the haemodilutional anaemia of splenomegaly. Lancet. 1969;1(7599):795–8.
27 Wani NA, Parray FQ. Splenectomy in idiopathic hypersplenism. Int Surg. 2006;91(3):157–61.