Estimation of glomerular filtration rate in hospitalised patients: are we overestimating renal function?
DOI: https://doi.org/10.4414/smw.2012.13708
Michelle
Frank, Sara
Guarino-Gubler, Michel
Burnier, Marc
Maillard, Franco
Keller, Luca
Gabutti
Summary
QUESTIONS UNDER STUDY AND PRINCIPLES: Estimating glomerular filtration rate (GFR) in hospitalised patients with chronic kidney disease (CKD) is important for drug prescription but it remains a difficult task. The purpose of this study was to investigate the reliability of selected algorithms based on serum creatinine, cystatin C and beta-trace protein to estimate GFR and the potential added advantage of measuring muscle mass by bioimpedance.
METHODS: In a prospective unselected group of patients hospitalised in a general internal medicine ward with CKD, GFR was evaluated using inulin clearance as the gold standard and the algorithms of Cockcroft, MDRD, Larsson (cystatin C), White (beta-trace) and MacDonald (creatinine and muscle mass by bioimpedance).
RESULTS: 69 patients were included in the study. Median age (interquartile range) was 80 years (73–83); weight 74.7 kg (67.0–85.6), appendicular lean mass 19.1 kg (14.9–22.3), serum creatinine 126 μmol/l (100–149), cystatin C 1.45 mg/l (1.19–1.90), beta-trace protein 1.17 mg/l (0.99–1.53) and GFR measured by inulin 30.9 ml/min (22.0–43.3). The errors in the estimation of GFR and the area under the ROC curves (95% confidence interval) relative to inulin were respectively: Cockcroft 14.3 ml/min (5.55–23.2) and 0.68 (0.55–0.81), MDRD 16.3 ml/min (6.4–27.5) and 0.76 (0.64–0.87), Larsson 12.8 ml/min (4.50–25.3) and 0.82 (0.72–0.92), White 17.6 ml/min (11.5–31.5) and 0.75 (0.63–0.87), MacDonald 32.2 ml/min (13.9‒45.4) and 0.65 (0.52‒0.78).
CONCLUSIONS: Currently used algorithms overestimate GFR in hospitalised patients with CKD. As a consequence eGFR targeted prescriptions of renal-cleared drugs, might expose patients to overdosing. The best results were obtained with the Larsson algorithm. The determination of muscle mass by bioimpedance did not provide significant contributions.
Introduction
Glomerular filtration rate (GFR) can be measured using standardised methods such as the determination of inulin clearance or by calculating the clearance of alternative substrates, such as iodinated contrast agents (for instance, iohexol) or radioisotopes [1]. In clinical practice, however, determination of GFR by these methods is so cumbersome and costly that clinicians cannot use them on a regular basis and must be satisfied with an estimation of GFR calculated from endogenous markers of kidney function, traditionally serum creatinine and, more recently, cystatin C and beta-trace protein. The determination of creatinine is reproducible, not expensive and easily accessible. However, the use of creatinine for measuring kidney function has a number of limitations, specifically owing to the fraction of the substance eliminated by non-renal routes and to its dependence on muscle mass and, last but not least, on dietary intake [2–11]. Cystatin C and beta-trace protein do offer some theoretical advantages, the main one being their low susceptibility to anthropometric variables [12–20]; however, they have failed to win a place in the delicate compromise between determination cost, accuracy and reproducibility despite the fact that they have now been available for a number of years [21–24]. Also owing to limited intra-individual variability, creatinine thus continues to be the endogenous substrate of first choice for estimating kidney function and, when appropriate, for determining the stage of dysfunction [25, 26].
Starting from creatinine it is possible to estimate either, GFR by a number of formulas, the most popular of which is the one obtained by Levey in 1999 from the Modification of Diet in Renal Disease (MDRD) study data [4, 5] or creatinine clearance with the equation published by Cockcroft in 1976 [3]. Because of the fraction eliminated by tubular and intestinal routes, creatinine clearance usually overestimates GFR; however, the difference between the two measurements falls within determination-related error dispersion [27]. For the purpose of correcting the error given by the difference between individual muscle mass and average muscle mass by age group [28, 29], MacDonald proposed in 2006 an equation that also included determination of appendicular lean mass by bioelectrical impedance analysis [30, 31].
There are also dedicated equations available for estimating GFR from cystatin C and beta-trace protein (proposed by Larsson in 2004 [13] and by White in 2007, respectively [20]), that are not or little affected by body composition [12–20] but are unfortunately exposed to great intra- and inter-individual variability just like the substrates they are based on [21–24].
Despite progress in knowledge about endogenous markers of kidney function, the determination of GFR remains difficult. The difficulty is further enhanced in patients at the extremes of the normal distribution, particularly with regard to weight, muscle mass, and age [2, 7, 32].
The frail elderly who are admitted to internal medicine wards, with their many comorbidities and the consequences of their disabilities, often have complex conditions treated with medications having a narrow therapeutic spectrum and, by definition, they put the equations used for estimating kidney function to the hardest of tests. This is even more so when we know that one third to one fourth of all patients above 60 years of age, some of whom with normal creatinine values, have at least stage III chronic kidney disease (CKD) [33] and that GFR has been shown to decrease by 0.8 ml/min/year on average, starting from the age of 40 [2].
Confused by the number and diversity of available equations, and anxious to verify their accuracy in the elderly population of our internal medicine wards with CKD and moderately compromised kidney function, we decided to compare the main equations (Cockcroft [3], MDRD [5], White [20], Larsson [13] and MacDonald [30]), using inulin clearance as the gold standard [34, 35].
Materials and methods
Patients and measurements
We recruited 70 unselected Caucasian patients with CKD and moderate kidney function impairment (stage III–IV according to KDOQI guidelines [25]) among the elderly population (>70 year old) of the internal medicine wards of two secondary care hospitals in the south of Switzerland (Regional Hospitals of Locarno and Bellinzona). Every patient had to be cardiopulmonary compensated showing a stable weight at least in the 4 days before inclusion. We excluded patients with evidence of unstable renal function in the last two weeks (serum creatinine excursions >20 µmol/l), before inclusion.

Figure 1
Box Plot showing the absolute error in estimating GFR (inulin clearence as the gold standard). CYSA, BTPA, CKCA, MDRDA, ALMA = absolute error in estimating the GFR using algorithms based respectively on Cystatin C; Beta-trace protein, creatinine and anthropometric values (Cockcroft); creatinine and anthropometric values (MDRD), creatinine, anthropometric values and appendicular lean mass (approximating muscle mass) measured by bioimpedance.
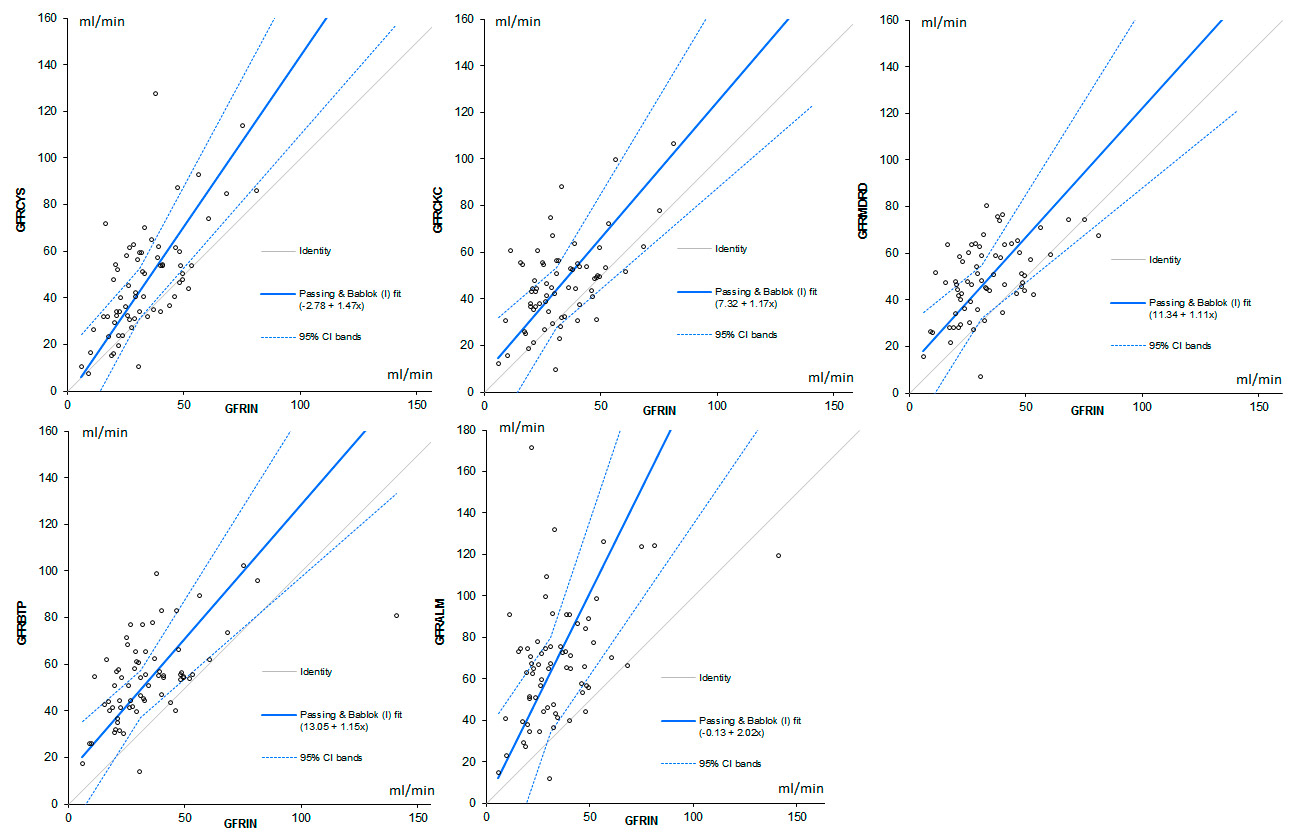
Figure 2
Scatterplots comparing the estimations obtained with the tested algorithms to the GFR measured by inulin; the diagonal line indicates the equality. A Passing and Bablok analysis shows the trend of the distribution and its 95% confidence intervals.
GFR CYS = GFR estimated by Cystatin C; GFR BTP = GFR estimated by Beta Trace Protein; GFR ALM = GFR estimated by Appendicular Lean Mass and creatinine. GFR CKC= GFR estimated by Cockcroft’s algorithm. GFR MDRD = GFR estimated by MDRD (Modification of Diet in Renal Disease) algorithm.
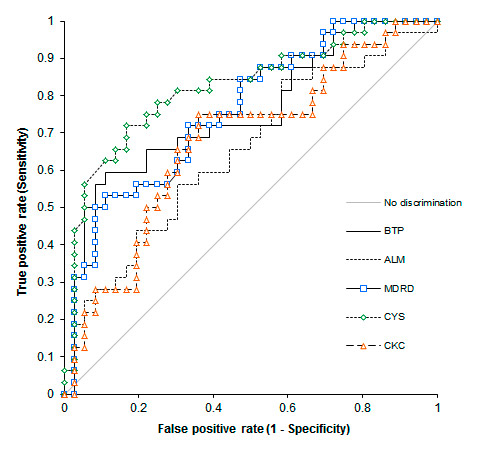
Figure 3
ROC Curves plotting the sensitivity against 1 minus the specificity of the selected algorithms in predicting an inulin clearance <30 ml/min.
CYS = GFR estimated by Cystatin C; BTP = GFR estimated by Beta Trace Protein; ALM = GFR estimated by Appendicular Lean Mass and creatinine. CKC= GFR estimated by Cockcroft’s algorithm. MDRD = GFR estimated by MDRD (Modification of Diet in Renal Disease) algorithm. The ideal test would have an AUC of 1, whereas a random guess would have an AUC of 0.5.
To minimise bias, starting on kick-off day, all patients meeting the selection criteria were asked to participate in the study and every patient from whom an informed consent was obtained was recruited.
On the inclusion day, blood samples were obtained from each patient to determine serum creatinine, cystatin C and beta-trace protein additionally bioimpedance was assessed. On the same day the glomerular filtration rate (GFR) was measured using a single bolus inulin clearance [36].
Blood samples were rapidly (waiting time <15 minutes) centrifuged for 10 minutes (1,500 RPM) in the local laboratory. Plasma and serum were extracted and frozen at respectively –80 and –20 °C and then sent to the “Central Chemical and Immunology Laboratory of the Public Hospital Network of Bellinzona” to determine the serum creatinine, Cystatin C and beta-trace protein and to the “Nephrology Research Laboratory of the Lausanne University Hospital” to determine the plasma inulin.
Laboratory assessments for serum creatinine, cystatin C and beta-trace protein and for plasma inulin
To obtain the serum creatinine value, a modified IDMS calibrated kinetic Jaffé reaction on a Hitachi 912 photometer was used. Serum cystatin C and beta trace-protein levels were analysed with the Siemens method using the Behring Nephelometer II.
Plasma inulin was determined using a spectrophotometer (microadaptation of an anthrone procedure on a Technicon Autoanalyser [37]).
Inulin clearance
Inulin clearance has been used as the gold standard for the determination of GFR [39, 40]. Considering (1.) the known good correlation between the clearance values obtained with a constant infusion of inulin and with a single shot method respectively and (2.) the simplicity of the short infusion strategy, the latter was used to determine the GFR [35, 36].
Two timed blood samples after the bolus injection of inulin could have been enough to calculate the GFR [36]; we decided however to increase the number of blood samples to 4 in order to set up a better disappearance curve and to estimate the inulin clearance (one-compartment model) thrice for every patient according to the following formula.
GFR Inulin = (ln Cn‒1 ‒ ln Cn)/(tn‒1 ‒ tn)
(C = inulin concentration [mg/l]; t = time [min])
Concerning the inulin administration; on the study day, at time 0, a bolus of 12.5 ml of Inutest® (a solution containing 25% inulin) was administered intravenously over 10 minutes. Altogether five blood samples were obtained; the first one prior to inulin administration and then at 90, 180, 270 and 360 minutes.
GFR and creatinine clearance estimation
To estimate creatinine clearance and GFR, the algorithms of Cockcroft (CCL CKC) andLevey (GFR MDRD) based on serum creatinine and anthropometric values, Larsson based on cystatin C (GFR CYS), White based on serum creatinine and beta-trace protein (GFR BTP) and MacDonald based on serum creatinine, anthropometric values and the appendicular lean mass obtained by bio-impedance (proportional to muscular mass) (GFR ALM) were used (table 1).
Cystatin C and Beta Trace Protein
Cystatin C is an endogenous, 13 kilo-Dalton protein, generated at a relatively constant rate, freely filtered by the glomeruli and reabsorbed and catabolised by the tubular epithelial cells [12, 13].
Similarly, Beta Trace Protein is a low molecular weight glycoprotein, primarily isolated as prostaglandin D2 synthase, in its turn filtered by the glomeruli and with minimal extra-renal elimination [19, 20].
Predicting appendicular lean mass by bioimpedance
The appendicular lean mass was estimated by bioimpedance; a commonly used method for estimating body composition based on the study of the passive electrical properties of the biological tissues. Bio-impedance allows estimating the relative volumes of different tissues or fluids in the body as total body water, appendicular lean mass (approximating the muscle mass) and fat body weight.
The efficacy and the reproducibility of the bioimpedance in estimating the body composition has been evaluated and judged favorably in many studies [38–40].
To perform the measurements electrodes were put on the dorsal surfaces of the ipsilateral wrist and ankle (on the metacarpal- and metatarsal phalangeal joint of the hand and foot) and a BIA 101 device (Akern, Florence, Italy) was used. Then, on the basis of the resulting resistance (Rz) and reactance (Xc), using the Bodygram® software, the appendicular lean mass (ALM) was calculated.
Statistical and data analysis
Statistical and data analysis were performed using the SPSS 20.0 and the Analyse-it 2.26 statistical software packages. Considering that the absolute error in predicting GFR is not normally distributed we decided to analyse the significance using a Friedman Test. In all cases a p ≤0.05 was considered statistically significant. Distributions were graphically depicted using box-plots and scatterplots.
The quality of the measurements of the inulin clearances was assessed analysing the intra-patient dispersion of the GFR values calculated as the median of the difference between the extremes.
To compare the accuracy of the selected prediction algorithms we used: a Bland and Altman analysis in which the error is plotted against the mean of measured and estimated GFR [41], a Passing and Bablok analysis depicting graphycally the trend and 95% confidence intervals of the distribution and receiver operating characteristic curves (ROC) which give a graphical display of sensitivity and specificity of the test. In ROC curves the sensitivity is plotted versus 1 – specificity, with each point of the curve representing a different cut-off level. The area under the curve (AUC) describes the test overall performance; to facilitate comparisons between individual variables the value was given with the 95% confidence interval.
Ethical approval was obtained from the local Ethics Committee (Comitato Etico Cantonale, Bellinzona), and all participants gave written informed consent prior to enrolment.
|
Table 1: Selected estimation algorithms. Formula used to estimate the Creatinine Clearance and the GFR respectively. |
|
GFR or CCl (ml/min)
|
Algorithm
|
| CCL CKC |
(140 ‒ age [year]) × weight [kg] / (creatinine [μmol/l] × 72) × (0.85 if female) |
| GFR MDRD |
175 × (creatinine [μmol/l])‒1.154 × (age [year])‒0.203 × (0.742 if female) |
| GFR CYS |
77.239 × Cystatin C (mg/l)‒1.2623
|
| GFR BTP |
167.8 × BTP [mg/l]‒0.758 × creatinine [μmol/l]‒0.204 × (0.871 if female) |
| GFR ALM |
101.008‒1.014 × LOG10 (creatinine [μmol/l] / 88) + 0.01644 × ALM [kg] + 0.07108 ×√ weight (Kg) |
| CCL CKC = creatinine clearance estimated by the Cockcroft algorithm; GFR MDRD = GFR estimated by the MDRD (Modification of Diet in Renal Disease) algorithm; GFR CYS = GFR estimated on the basis of the cystatin C value; GFR BTP = GFR estimated on the basis of the creatinine and the beta-trace protein value; GFR ALM = GFR estimated on the basis of the creatinine and the appendicular lean mass. |
Results
From the 70 recruited patients, one was excluded for incomplete blood samples.
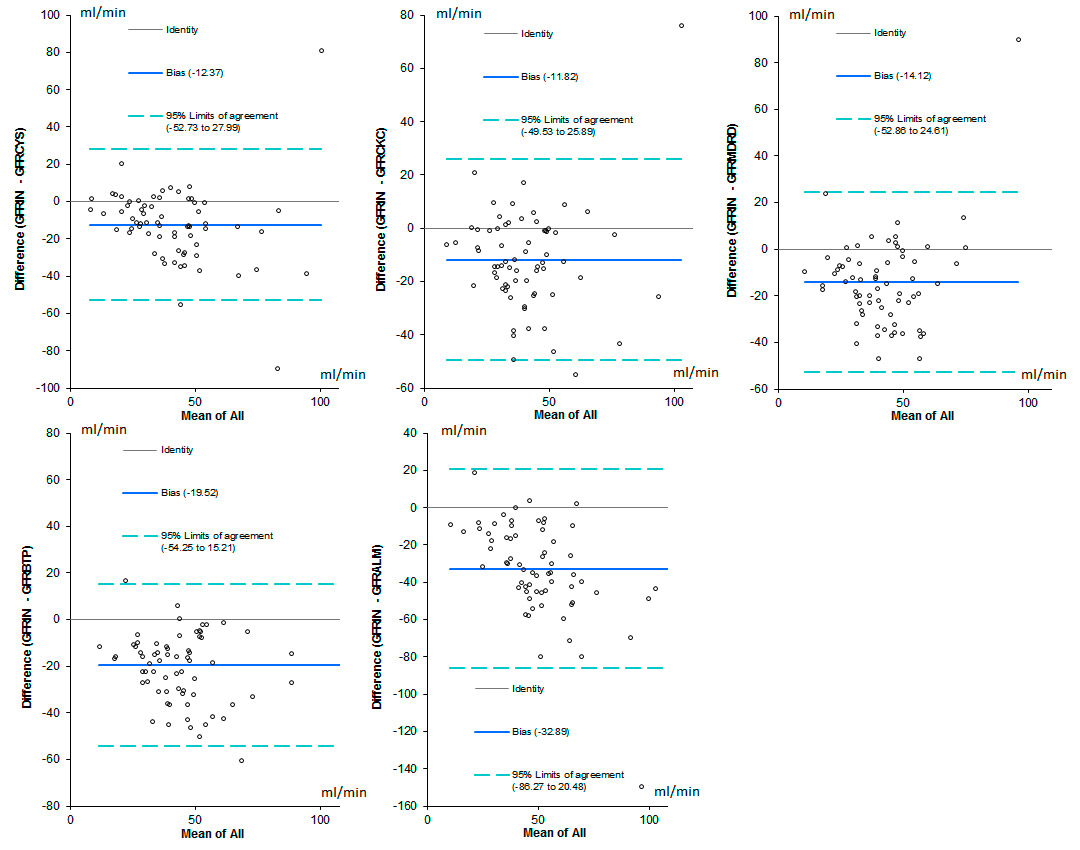
Figure 4
Bland and Altman analysis. In this analysis the differences between the gold standard and the selected prediction algorithm, are plotted against the mean of measured and calculated GFR for each individual patient.
GFR CYS = GFR estimated by Cystatin C; GFR BTP = GFR estimated by Beta Trace Protein; GFR ALM = GFR estimated by Appendicular Lean Mass and creatinine. GFR CKC= GFR estimated by Cockcroft’s algorithm. GFR MDRD = GFR estimated by MDRD (Modification of Diet in Renal Disease) algorithm.
The demographic and clinical characteristics of the study group are presented in table 2. As a comparison, the mean age and eGFR (MDRD) of the totality of the patients admitted to the internal medicine wards of the two hospitals in the study year (N = 5,676) was (median and interquartile range) 76 (66–84) years and 57 (38–81) ml/min respectively. Patients with chronic kidney disease stage III‒IV represented 52.9% of the entire population.
The GFR measured with inulin and calculated with the selected algorithms and the absolute error in performing the estimation (median and mean values to allow a quantitative comparison) are listed in table 3. The reliability of the inulin clearance was assessed analysing the intra-patient absolute difference between the extremes of the three individual determinations (median, 25% and 75% interquartile ranges which were: 8.2, 3.6 and 13.6 ml/min respectively).
All selected algorithms significantly overestimate GFR in our group of patients (p <0.001).
The absolute error in estimating GFR is depicted graphically in figure 1. The difference among the median values of the selected algorithms was found to be significant (p <0.001). The estimations obtained on the basis of cystatin C were characterised by the lowest median and mean error (table 3), while those obtained with the McDonald algorithm were the worst. Outliers 45 and 46 were characterised by a large body weight and estimated muscular mass (118 and 98, and 40 and 35 kg respectively).
The distribution of the values obtained estimating GFR with the 5 tested algorithms, compared to the reference method (inulin clearance) is depicted graphically using scatterplots in figure 2. A Passing and Bablok analysis shows the trend of the distribution and its 95% confidence intervals compared to the identity line.
The ROC curves comparing sensitivity and specificity of the tested algorithms in predicting an inulin clearance <30 ml/min are depicted in figure 3. The area under the curves and the 95% confidence intervals were respectively: CKC 0.68 (0.55–0.81), MDRD 0.76 (0.64–0.87), Cystatin C 0.82 (0.72–0.92), BTP 0.75 (0.63–0.87), ALM 0.65 (0.52–0.78).
The Bland and Altman analysis is shown in figure 4.
The percentage of patients wrongly attributed on the basis of the selected prediction algorithm, to a lower or a higher CKD stage is summarised in table 4. GFR CYS, inducing less class changes compared to the other algorithms, obtained the better score followed in order by GFR CKC, GFR MDRD, GFR BTP and GFR ALM.
|
Table 2: Clinical characteristics of the studied population (n = 69). |
|
Median (25–75% interquartile range)
|
Mean ± SD
|
| Age (years) |
80 (73–83) |
78 ± 7 |
| Weight (kg) |
74.7 (67.0–85.6) |
77.3 ± 15.2 |
| BMI (kg/m2) |
26.0 (23.3–30.0) |
27.3 ± 5.2 |
| ALM (kg) |
19.1 (14.9–22.3) |
19.1 ± 6.1 |
| Creatinine (μmol/l) |
126 (100–149) |
134 ± 62 |
| Cystatin C (mg/l) |
1.45 (1.19–1.90) |
1.71 ± 0.87 |
| Beta-trace protein (mg/l) |
1.17 (0.99–1.53) |
1.34 ± 0.64 |
|
Table 3: Measured versus estimated GFR. GFR measured with inulin and calculated with the selected algorithms and absolute error in performing the estimation. Data are given using non-parametric and parametric values to allow a quantitative comparison; mean and SD values of the absolute error correlate with accuracy and precision respectively. |
|
Median (25–75% interquartile range) ml/min
|
Mean ± SD ml/min
|
Median error (25–75% interquartile range) ml/min
|
Mean error ± SD ml/min
|
| GFR Inulin |
30.9 (22.0–43.3) |
34.9 ± 20.0 |
|
|
| GFR CKC |
45.1 (34.6–55.3) |
46.7 ± 18.5 |
14.3 (5.55–23.2) |
11.8 ± 19.2 |
| GFR CYS |
45.9 (31.9–59.4) |
47.2 ± 23.0 |
12.8 (4.50–25.3) |
12.4 ± 20.6 |
| GFR BTP |
54.2 (42.2–62.4) |
54.4 ± 18.2 |
17.6 (11.5–31.5) |
19.5 ± 17.7 |
| GFR MDRD |
47.9 (39.5–60.1) |
49.0 ± 15.9 |
16.3 (6.4–27.5) |
14.1 ± 19.8 |
| GFR ALM |
66.0 (46.3–77.7) |
32.9 ± 27.2 |
32.2 (13.9–45.4) |
32.9 ± 27.2 |
| GFR CYS = GFR estimated by Cystatin C; GFR BTP = GFR estimated by Beta Trace Protein; GFR ALM = GFR estimated by Appendicular Lean Mass and creatinine. GFR CKC = GFR estimated by Cockcroft’s algorithm. GFR MDRD = GFR estimated by MDRD (Modification of Diet in Renal Disease) algorithm. |
|
Table 4: Percentage of KDOQI CKD class change [25] obtained correcting the results of the estimations with the gold standard (GFR Inulin). |
|
KDOQI Class change
|
GFR BTP
|
GFR MDRD
|
GFRALM
|
GRFR CYS
|
GFR CKC
|
| Total class change % |
65.3 |
56.5 |
75.5 |
49.3 |
52.3 |
| +1 class |
50.7 |
46.4 |
37.7 |
39.1 |
37.7 |
| –1 class |
1.5 |
7.2 |
|
1.5 |
5.8 |
| +2 classes |
11.6 |
2.9 |
31.9 |
7.2 |
5.8 |
| –2 classes |
1.5 |
|
1.5 |
1.5 |
1.5 |
| ± >2 classes |
|
|
4.4 |
|
1.5 |
| GFR CYS = GFR estimated by Cystatin C; GFR BTP = GFR estimated by Beta Trace Protein; GFR ALM = GFR estimated by Appendicular Lean Mass and creatinine. GFR CKC= GFR estimated by Cockcroft’s algorithm. GFR MDRD = GFR estimated by MDRD (Modification of Diet in Renal Disease) algorithm. |
Discussion
In this study, we compared 5 different equations designed to estimate kidney function, based on serum creatinine (Cockcroft [3] and MDRD [5]), cystatin C (Larsson [13]), creatinine combined with beta-trace protein (White [20]), and creatinine adjusted for muscle mass obtained by bioelectrical impedance analysis (MacDonald [30]), respectively. Inulin clearance measured by the single shot method was taken as the gold standard [34–36]. The population under study, entirely of European Caucasian ethnicity, was chosen amongst the inpatients admitted to the internal medicine wards of two secondary care hospitals in southern Switzerland. The only criteria for their selection were, an age of >70 years and a chronic compromised kidney function based on MDRD eGFR (CKD stages III–IV).
As suggested by previous studies [2, 32], all tested equations are on average significantly overestimating kidney function (+11.8 ml/min Cockcroft, +12.4 ml/min cystatin C, +14.1 ml/min MDRD, +19.5 ml/min beta-trace protein, +32.9 ml/min creatinine and muscle mass). In this respect, a considerable number of patients would have changed their KDOQI CKD severity classification by adjusting GFR for the results of inulin clearance: 49% in the estimation based on cystatin C, 56% by MDRD, 52% by Cockcroft, 65% by beta-trace protein and 75% by creatinine and muscle mass (table 4).
The inaccuracy of equations in this inpatient population with extreme characteristics related to old age and polymorbidity is not surprising and has been previously reported [32].
However, considering how some criticalities attributed to creatinine relate to the difficulty in estimating muscle mass, we would have expected a better result from the MacDonald formula, obtained by adjusting creatinine for body composition data measured by bioelectrical impedance analysis. Value dispersion was quite similar to that of other equations or actually even worse (see error dispersion in box plots, ROC curves and Bland-Altman analysis; figures 1, 3 and 4 respectively). We therefore had to conclude that the determination of muscle mass by bioelectrical impedance analysis did not result in any significant added contribution in estimating GFR in the population under study.
However, taking into consideration the sound theoretical context in favour of the definition and use of such an equation, we wondered why the MacDonald formula proved to be imprecise. The small size of the population used to determine it, the lack of external validation [30], the extreme characteristics of the group which we tested, the possible loss of precision in the analysis of body composition in polymorbid elderly patients [42] and the use of a different software to determine body composition, could all have contributed to increased error dispersion.
The use of bioelectrical impedance analysis to reduce error in creatinine-related GFR estimation, still retains a theoretical attractiveness, and will have to be reassessed in studies based on a wider population representative of the in-hospital one, for which the interest in using a predictive equation is greater.
The second surprise was to observe that the MDRD formula did not offer significant advantages compared to Cockcroft and seems to be less effective when compared with the Larsson one.
The relative imprecision of the MDRD formula might be related to the selected population (American in MDRD and European in Cockcroft and Larsson) or, once again, to the clinical characteristics of the population such as advanced age and polymorbidities of the group in which we performed the evaluation.
The results of the present study once again suggest that the equations obtained from large clinical studies thus show fragility in the extremes – in this case, advanced age and polymorbidities [38]. This is particularly relevant as the group selected for the study (CKD stages III-IV based on eGFR MDRD) accounts for 53% of the patients admitted to the internal medicine wards of our hospitals.
Beta-trace protein does not seem to offer specific advantages against creatinine and cystatin C; while the White equation is the only one that does not generate outliers. Unfortunately this latter shows a greater error dispersion in GFR estimation than Cockcroft, Larsson and MDRD.
What are we supposed to do in the face of such a large margin of error? Assuming that the results were not generated by a bias related to the small group of patients analysed or to the single shot method used to measure inulin clearance (see intra-patient dispersion of the GFR determination in the results section); all the equations tested seem to be prone to considerably overestimate GFR. While we can imagine using the ones offering the best performance, we are not safe from either, the risk of intoxicating patients with medications eliminated mainly by the renal route characterised by a narrow therapeutic margin (e.g., some chemotherapics and antibiotics), and in a smaller subgroup, the risk of being, on the contrary, below the therapeutic range. Considering the relevance of the topic and the amount of in-hospital patients matching the selection criteria of the study, further investigation aimed to confirm and more extensively characterising patients with large GFR estimation errors, should be performed.
Therefore, it is of the utmost importance to closely monitor the onset of any toxicity signs; whenever serum concentrations of a medication used cannot be measured and to be ready to adjust its dose or, when necessary, to replace the drug with an alternative one. One important issue in elderly patients is the correction of GFR to a standard body surface area (1.73 m2) as for example in the MDRD formula. Patients in the extremes of weight do often not have a normal body surface area and in that case drug overdosing may occur as well. In this respect the Cockcroft formula, considering also the weight, could be the safest.
In conclusion, the Cockcroft, Larsson, MDRD, White and MacDonald equations are significantly overestimating kidney function in our CKD stage III–IV inpatient population (average overestimation ranging from 11.4 to 32.9 ml/min; the extremes being Cockcroft and Macdonald respectively). These results are important because the selected population represents at least half of all patients admitted in an internal medicine ward.
The best performance was obtained with the Larsson equation, based on cystatin C. The measurement by bioelectrical impedance analysis of muscle mass, introduced with creatinine in the MacDonald formula, does not allow more accurate results to be obtained, at least in our population of patients.
Clinicians must therefore use estimated GFR with prudence, being ready to discontinue medications with narrow therapeutic margins eliminated by the renal route in all cases of suspected toxicity. New studies designed to improve predictive equations to be used in elderly in-hospital populations should be conducted.
References
1 Brändström E, Grzegorczyk A, Jacobsson L, Friberg P, Lindahl A, Aurell M. GFR measurement with iohexol and 51Cr-EDTA. A comparison of the two favoured GFR markers in Europe. Nephrol Dial Transplant. 1998;13(5):1176–82.
2 Macunluoğlu B, Gökçe I, Atakan A, Demirci M, Arı E, Topuzoğlu A, Borazan A. A comparison of different methods for the determination of glomerular filtration rate in elderly patients with chronic renal failure. Int Urol Nephrol. 2011;43(1):257–63.
3 Cockcroft DW, Gault MH. Prediction of creatinine clearance from serum creatinine. Nephron. 1976;16(1):31–41.
4 Levey AS, Bosch JP, Lewis JB, Greene T, Rogers N, Roth D. A more accurate method to estimate glomerular filtration rate from serum creatinine: a new prediction equation. Modification of Diet in Renal Disease Study Group. Ann Intern Med. 1999;130(6):461–70.
5 Levey AS, Greene T, Kusek JW, Beck GJ and MDRD Study Group. A simplified equation to predict glomerular filtration rate from serum creatinine. American Society of Nephrology Renal Week, A0828. 2000.
6 Lin J, Knight EL, Hogan ML, Singh AK. A comparison of prediction equations for estimating glomerular filtration rate in adults without kidney disease. J Am Soc Nephrol. 2003;14(10):2573–80.
7 Fesler P, Mimran A. Estimation of glomerular filtration rate: what are the pitfalls? Curr Hypertens Rep. 2011;13(2):116–21.
8 Nicoll SR, Sainsbury R, Bailey RR, King A, Frampton C, Elliot JR, et al. Assessment of creatinine clearance in healthy subjects over 65 years of age. Nephron. 1991;59(4):621–5.
9 White CA, Huang D, Akbari A, Garland J, Knoll GA. Performance of creatinine-based estimates of GFR in kidney transplant recipients: a systematic review. Am J Kidney Dis. 2008;51(6):1005–15.
10 Poggio ED, Nef PC, Wang X, Greene T, Van Lente F, Dennis VW, et al. Performance of the Cockcroft-Gault and modification of diet in renal disease equations in estimating GFR in ill hospitalized patients. Am J Kidney Dis. 2005;46(2):242–52.
11 Poggio ED, Wang X, Greene T, Van Lente F, Hall PM. Performance of the modification of diet in renal disease and Cockcroft-Gault equations in the estimation of GFR in health and in chronic kidney disease. J Am Soc Nephrol. 2005;16(2):459–66.
12 Hoek FJ, Kemperman FA, Krediet RT. A comparison between cystatin C, plasma creatinine and the Cockcroft and Gault formula for the estimation of glomerular filtration rate. Nephrol Dial Transplant. 2003;18(10):2024–31.
13 Larsson A, Malm J, Grubb A, Hansson LO. Calculation of glomerular filtration rate expressed in mL/min from plasma cystatin C values in mg/L. Scand J Clin Lab Invest. 2004;64:25–30.
14 Tanaka A, Suemaru K, Otsuka T, Ido K, Nishimiya T, Sakai I, et al. Hoek’s formula, a cystatin C-based prediction formula for determining the glomerular filtration rate, is the most effective method for original adjusting the dosage of vancomycin. Int J Clin Pharmacol Ther. 2007;45(11):592–7.
15 White C, Akbari A, Hussain N, Dinh L, Filler G, Lepage N, et al. Estimating glomerular filtration rate in kidney transplantation: a comparison between serum creatinine and cystatin C-based methods. J Am Soc Nephrol. 2005;16(12):3763–70.
16 Stevens LA, Coresh J, Schmid CH, Feldman HI, Froissart M, Kusek J, et al. Estimating GFR using serum cystatin C alone and in combination with serum creatinine: a pooled analysis of 3,418 individuals with CKD. Am J Kidney Dis. 2008;51(3):395–406.
17 Perkins BA, Nelson RG, Ostrander BE, Blouch KL, Krolewski AS, Myers BD, et al. Detection of renal function decline in patients with diabetes and normal or elevated GFR by serial measurements of serum cystatin C concentration: results of a 4-year follow-up study. J Am Soc Nephrol. 2005;16(5):1404-12.
18 Coll E, Botey A, Alvarez L, Poch E, Quintó L, Saurina A, et al. Serum cystatin C as a new marker for noninvasive estimation of glomerular filtration rate and as a marker for early renal impairment. Am J Kidney Dis. 2000;36(1):29–34.
19 Pöge U, Gerhardt T, Woitas RP. Estimation of Glomerular Filtration Rate by Use of Beta-Trace Protein.Clinical Chemistry. 2008;54:1403–5.
20 White CA, Akbari A, Doucette S, Fergusson D, Hussain N, Dinh L, et al. A Novel Equation to Estimate Glomerular Filtration Rate Using Beta-Trace Protein. Clinical Chemistry. 2007;53:1965–8.
21 Knight EL, Verhave JC, Spiegelman D, Hillege HL, de Zeeuw D, Curhan GC, et al. Factors influencing serum cystatin C levels other than renal function and the impact on renal function measurement. Kidney Int. 2004;65(4):1416–21.
22 Keevil BG, Kilpatrick ES, Nichols SP, Maylor PW. Biological variation of cystatin C: implications for the assessment of glomerular filtration rate. Clin Chem. 1998;44:1535–9.
23 Cimerman N, Brguljan PM, Krasovec M, Suskovic S, Kos J. Twenty-four hour variations of cystatin C and total cysteine proteinase inhibitory activity in sera from healthy subjects. Clin Chim Acta. 2000;291:89–95.
24 Tan GD, Lewis AV, James TJ, Altmann P, Taylor RP, Levy JC. Clinical usefulness of cystatin C for the estimation of glomerular filtration rate in type 1 diabetes: reproducibility and accuracy compared with standard measures and iohexolclearance. Diabetes Care. 2002;25:2004–9.
25 National Kidney Foundation. K/DOQI clinical practice guidelines for chronic kidney disease: evaluation, classification, and stratification. Am J Kidney Dis. 2002;39:S1–S266.
26 Price CP, Finney H. Developments in the assessment of glomerular filtration rate. Clin Chim Acta. 2000;297(1-2):55–66.
27 Coresh J, Toto RD, Kirk KA, Whelton PK, Massry S, Jones C, et al. Creatinine clearance as a measure of GFR in screenees for the African-American Study of Kidney Disease and Hypertension pilot study. Am J Kidney Dis. 1998;32(1):32–42.
28 Donadio C, Consani C, Ardini M, Caprio F, Grassi G, Lucchesi A. Prediction of glomerular filtration rate from body cell mass and plasma creatinine. Curr Drug Discov Technol. 2004;1(3):221–8.
29 Donadio C, Lucchesi A, Tramonti G, Bianchi C. Creatinine clearance predicted from body cell mass is a good indicator of renal function. Kidney Int Suppl. 1997;63:S166–8.
30 Macdonald JH, Marcora SM, Jibani M, Roberts G, Kumwenda MJ, Glover R, et al. Bioelectrical impedance can be used to predict muscle mass and hence improve estimation of glomerular filtration rate in non-diabetic patients with chronic kidney disease. Nephrol Dial Transplant. 2006;21(12):3481–7.
31 Macdonald JH, Marcora SM, Kumwenda MJ, Jibani M, Roberts G, Glover R, et al. The relationship between estimated glomerular filtration rate, demographic and anthropometric variables is mediated by muscle mass in non-diabetic patients with chronic kidney disease. Nephrol Dial Transplant. 2006;21(12):3488–94.
32 Rolin HA 3rd, Hall PM, Wei R. Inaccuracy of estimated creatinine clearance for prediction of iothalamate glomerular filtration rate. Am J Kidney Dis. 1984;4(1):48–54.
33 Schmid P, Fischer AG, Wuillemin WA. Prevalence of impaired renal function in medical inpatients. Swiss Med Wkly. 2007;8;137(35-36):514.
34 Buclin T, Pechere-Bertschi A, Sechaud R, Decosterd LA, Munafo A, Burnier M, et al. Sinistrin clearance for determination of glomerular filtration rate: a reappraisal of various approaches using a new analytical method. J Clin Pharmacol. 1997;37:679–92.
35 Orlando R, Floreani M, Padrini R, Palatini P. Determination of inulin clearance by bolus intravenous injection in healthy subjects and ascitic patients: equivalence of systemic and renal clearances as glomerular filtration markers. Br J Clin Pharmacol. 1998;46(6):605–9.
36 Jung K, Henke W, Schulze BD, Sydow K, Precht K, Klotzek S. Practical approach for determining glomerular filtration rate by single-injection inulin clearance. Clin Chem. 1992;38(3):403–7.
37 Wright HK, Gann DS. An automatic anthrone method for the determination of inulin in plasma and urine. J Lab Clin Med. 1966;67:689–93.
38 Kotler DP, Burastero S, Wang J, Pierson RN Jr. Prediction of body cell mass, fat-free mass, and total body water with bioelectrical impedance analysis: effects of race, sex, and disease. Am J Clin Nutr. 1996;64(3 Suppl):489S–497S.
39 Segal KR, Van Loan M, Fitzgerald PI, Hodgdon JA, Van Itallie TB. Lean body mass estimation by bioelectrical impedance analysis: a four-site cross-validation study. Am J Clin Nutr. 1988;47(1):7–14.
40 Kyle UG, Bosaeus I, De Lorenzo AD, Deurenberg P, Elia M, Manuel Gómez J, et al; ESPEN. Bioelectrical impedance analysis-part II: utilization in clinical practice. Clin Nutr. 2004;23(6):1430–53.
41 Bland JM, Altman DG. Comparing methods of measurement: why plotting difference against standard method is misleading. Lancet. 1995;346:1085–7.
42 Völgyi E, Tylavsky FA, Lyytikäinen A, Suominen H, Alén M, Cheng S. Assessing body composition with DXA and bioimpedance: effects of obesity, physical activity, and age. Obesity (Silver Spring). 2008;16(3):700–5.