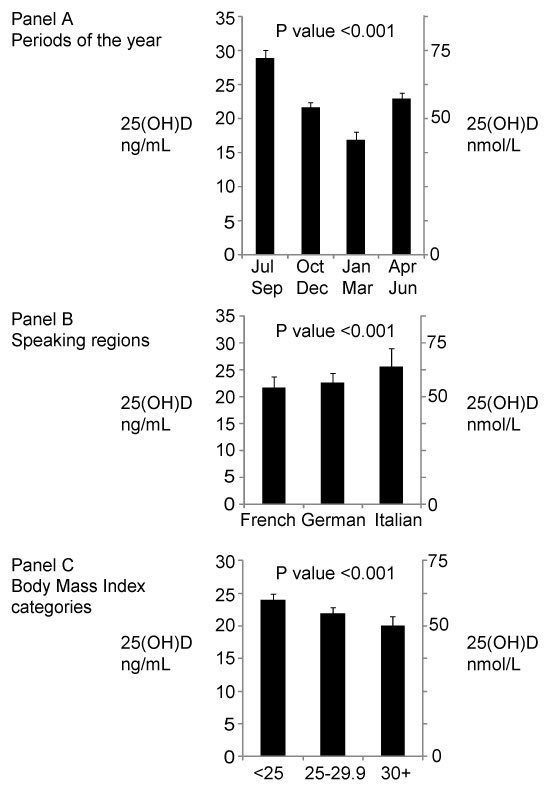
Figure 1
Adjusted mean 25(OH)D levels. A By period of the year. B By speaking region. C By BMI categories.
DOI: https://doi.org/10.4414/smw.2012.13719
Abbreviations:
BMI body mass index
CKD-EPI chronic kidney disease epidemiology collaboration equation
CVD cardiovascular disease
DEQAS vitamin D external quality assessment scheme
IS international standards
LC-MS/MS liquid chromatography-tandem mass spectrometry
NHANES National Health and Nutrition Examination Survey
SSS Swiss Study on Salt intake
25(OH)D 25-hydroxyvitamin D
UVB ultraviolet B
Vitamin D deficiency is associated with rickets and osteoporosis [1, 2]. More recently, epidemiological associations of vitamin D deficiency with other diseases such as cancers, multiple sclerosis, and rheumatoid arthritis have been reported [3]. There is also evidence from molecular, animal and human studies suggesting that vitamin D level is associated with cardiovascular disease (CVD) [4], diabetes [5, 6], and depression [7].
In humans, most of the circulating vitamin D is synthetised from cholesterol following exposure to sunlight ultraviolet B (UVB), whereas a smaller amount is derived from diet and dietary supplements. Diet contributes only between 10% to 20% to 25(OH)D levels, but becomes more important when sunshine exposure is low [8]. Fish is the major dietary source of vitamin D in humans. For example, 85 grams of cooked salmon provide 90% of the recommended daily vitamin D intake, whereas 85 grams of cooked beef provide only 4% of the recommended intake [9]. Other factors such as body mass index (BMI), skin pigmentation, and geographical factors (e.g., latitude, altitude, meteorological conditions) can influence circulating vitamin D levels [10].
Serum 25-hydroxyvitamin D [25(OH)D] is the major circulating form of vitamin D that is used to determine vitamin D status. Vitamin D deficiency and insufficiency are respectively defined as 25(OH)D levels <20 ng/ml (50 nmol/l) and 25(OH)D between 20 and 29 ng/ml (50 nmol/l and 75 nmol/l), although different definitions exist [11]. In Europe, the mean serum 25(OH)D levels reported in population-based studies vary from 18 ng/ml (29 nmol/l) in Italy to 30 ng/ml (75 nmol/l) in Norway [12]. While the definitions of adequate vitamin D levels differ, it is estimated that one billion people worldwide have vitamin D deficiency [13]. It affects more than 40% of U.S. and European men and women, and more than 50% of postmenopausal women [3]. In Switzerland, the last population-based estimation of vitamin D deficiency, based on 25-hydroxyvitamin D (25(OH)D) serum levels, was made more than 20 years ago (Swiss MONICA project) [14]. At this time, 6% of the population were clearly deficient (i.e., 25(OH)D ≤8 ng/ml [≤20 nmol/l]), and a further 34% had a low concentration of vitamin D (i.e., <15 ng/ml [<38 nmol/l]).
The aims of this study were (1.) to estimate the 25(OH)D distribution and to update the prevalence of vitamin D insufficiency (defined as 25(OH)D between 20 ng/ml and 29.9 ng/ml [50–75 nmol/l]) and deficiency (defined as 25(OH)D <20 ng/ml [<50 nmol/l]) in the Swiss adult population, and (2.) to identify factors, including linguistic regions, associated with vitamin D status in the Swiss adult population. Major known factors that influence 25(OH)D levels, such as sunshine hours, altitude, latitude, ethnicity, physical activity, diet and supplements were taken into account. Because there is no data on time trends in vitamin D levels in Switzerland, we also reported our results with those from three previous Swiss studies conducted in 1988, 2005, and 2009.
We used the data from the 2010–2011 Swiss Study on Salt intake (SSS) [15], its main objective was to estimate dietary salt/sodium intake using 24-hour urine collection in the Swiss population.
The SSS study is a multicentric population-based study including data in ten centres reflecting the geographical and cultural diversity of the Swiss adult population (≥15 years old). In the SSS study, the Italian region was oversampled to allow for a meaningful comparison with the two other major linguistic regions (i.e. French and German). Sampling was stratified using eight age- (15–29 years, 30–44 y, 45–59 y, ≥60 y) and -sex strata. Recruitment began in January 2010 and ended in August 2011. Information letters were followed by phone calls with up to 3 attempts on different days, including evening hours, during which people are more likely to be at home. Participation rate was low (10%). Because of important difficulties in recruiting young participants, we had to complete the study sample (aged 15–20 years old) by recruiting volunteers from schools and universities. Blood collection was not mandatory to participate in the study.
Subjects were identified by means of the Swiss Federal Statistical Office phone directory which is regularly updated by the major Swiss phone provider. We performed a two-stage sampling strategy. Stage 1 identified households (primary unit) and stage 2 identified a single individual per household (secondary unit). We determined household characteristics by phone (household size, age, sex and nationality of its members) to identify the target population, from which a random sample was then drawn. In the first stage, we contacted households by phone after having sent a letter of invitation to participate to the survey. A single person per household was randomly selected to respond to a first questionnaire by phone. In the second stage, the selected person came to the study centre on two consecutive mornings for measurement by a trained health professional from the survey team and for urine collection.
The phenotypes were collected and the urine samples were analysed centrally in the laboratory of Lausanne University Hospital. To minimise the non-response rate multiple attempts to contact participants including outside of regular working hours were made. The cost of the participants’ transportation was covered by the protocol.
The SSS complied with the Declaration of Helsinki and was approved by the local Institutional Ethics Committees. All participants gave written informed consent. For participants below age 18 years, written consent from one parent or a legal representative was obtained.
Weight and height were measured and BMI calculated as weight/height2. Diabetes was based on presence of antidiabetic drug treatment. Post-menopausal status, use of oral contraceptive or hormone replacement therapy, ethnicity, and smoking status were self-reported.
Information on diet (fish, meat, beer, and wine consumptions), physical activity and daily minutes of walk were collected using questionnaires.Participants were asked to report their medication and supplements. This list of reported medications/supplements was compared to the original medicines Compendium® of Switzerland database (http://www.compendium.ch/) to identify vitamin D supplements and treatments.
Total serum calcium was measured by O-cresolphtalein and albumin by bromocresol green; albumin-corrected calcium was then calculated. Creatinine was measured using Jaffe kinetic compensated method (Roche Diagnostics, Switzerland), kidney function was calculated using the Chronic Kidney Disease Epidemiology Collaboration (CKD-EPI) equation [16]. 24-hour urinary calcium excretion was used as a proxy of hormonal status (e.g., parathyroid hormone).
Participants were geocoded by merging information on the participant’s private address with latitude, longitude and altitude information using Python programming and Google Maps Find Altitude software (https://developers.google.com/maps/documentation/elevation/). Data on sunshine hours were obtained from Meteoswiss which collects sunshine hours using meteorological stations distributed throughout Switzerland (http://www.meteoswiss.admin.ch/web/en.html). For each participant, data on sunshine hours collected in the station nearest to the participants’s address was used. The exposure period considered in this study was starting from the month before the participant’s day of blood collection and was used to estimate the monthly mean sunshine hours.
Vitamin D (25(OH)D3 and 25(OH)D2) concentrations in serum were measured by liquid chromatography- tandem mass spectrometry (LC-MS/MS) in the laboratories of the Swiss Federal Office of Public Health. An in-house validated method with hexadeuterated 25(OH)D3 as internal standard (IS) was developed. This takes into account the difficulty of measuring the serum 25(OH)D level over a long period of time ensuring the comparability of results, as discussed for NHANES and for the UK national diet survey [17, 18]. The C-3 epimer of 25(OH)D3 was not chromatographically separated and hence added to the measured 25(OH)D concentration. NIST SRM 972 reference material [19] was used during validation of the method and again every sixth month during routine detection. Five different reference sera were used in each assay. During the whole measurement period the laboratory participated successfully in a quality control programme (DEQAS) [20]. The limits of quantification of the method were 1.5 ng/ml for 25(OH)D3 and 1.0 ng/ml for 25(OH)D2. Intra- and inter-assay coefficient of variation for 25(OH)D3 were 4% and 8%, respectively. If one of the reference sera showed more than 15% deviation from the target value the results were discarded and the assay repeated.
The stability of the frozen sera with respect to the measured parameters was tested over a period of 2 years. The effect of freezing thawing cycles on serum levels was also checked and we observed no difference with fresh serum for up to 5 cycles. The sera were stored frozen at –40 °C and were thawed just before analysis.
Samples for analysis were prepared as follows: 400 µl actonitrile and 50 µl IS in acetonitrile followed by 150 µl of serum were pipetted into a 96-well-protein-filtration-plate, adequately mixed and vacuum filtered into a 96-well-plate. 250 µl of the resulting solution was injected into the online-SPE-LC-MS/MS (online SPE: Symbiosis Pharma from Spark; LC-MS/MS: API5000 from ABSciex; SP-cartridge: Hysphere C8 EC-SE10; analytical column: BDS Hypersil C8 3 µm, 50×2.1 mm; elution with a water methanol gradient with 0.05% formic acid). Atmospheric pressure chemical ionisation in the positive ion mode was used. The following transitions were used for quantitation: 25(OH)D3, m/z 401 à 383; 25(OH)D2 m/z 395 à 269; IS m/z 407/263. For each considered molecule two additional transitions were used as qualifiers.
We compared current vitamin D levels in the Swiss population with previously available Swiss data from the Swiss MONICA project and from two cohort studies, the Swiss Red Cross study (Schweizerisches Rotes Kreuz, SRK) and the Selenium study. The Swiss MONICA project was conducted between October 1988 and June 1989 on a representative sample of the population from three Swiss cantons: Vaud, Fribourg, and Tessin (n = 3,466) [14]. Data were extracted from published results.
In the Selenium study, 1,847 samples were collected during the periods of May to July 2005 and May to September 2006. The study design and sampling procedure have been described previously [21].
In the SRK study (personal communication, manuscript in preparation), some 120 samples were obtained each month between December 2009 and November 2010 from the region of Bern (for a total of 1,582 samples). The sampling was designed to have a representative sample of blood donors with respect to sex and age. Serum samples in the SRK and Selenium studies were obtained from regular blood donors in blood bank centres of the Swiss Red Cross. In the SRK and the Selenium studies, 25(OH)D concentration was assessed by the same analytical method as the one used in the present study (i.e. Swiss Study on Salt Intake) while in the MONICA study vitamin D was measured by radioimmunoassay.
Statistical analyses were performed using Stata 11.0 (Stata Corp, College Station, USA). Continuous variables were expressed as mean ± standard deviation (s.d.) or 95% confidence intervals (95%CI). Categorical variables were expressed as number of subjects and percentage. Overall difference in means and frequencies across groups were tested (and p-values reported) using design-adjusted Student t-test and Χ 2 tests [22]. For these analyses, serum 25(OH)D was transformed using the square-root transformation and estimates were then back-transformed. Mean 25(OH)D levels were adjusted for age, sex, BMI, latitude, altitude, mean sunshine hours, weekly walking hours, period of the year, and speaking-regions, when appropriate. Adjusted 25(OH)D mean levels are reported by vitamin D supplements/treatment status. Vitamin D status was categorised into sufficiency, insufficiency, and deficiency defined respectively as 25(OH)D ≥30 ng/ml [75 nmol/l], 20–29.9 ng/ml [50–75 nmol/l], and <20 ng/ml [50 nmol/l] according to experts recommendations [3, 23]. To account for the stratified sampling method and Italian-speaking region oversampling, we used STATA survey procedures to estimate means and prevalences of vitamin D levels and status. To analyse the associations of covariates of interest with vitamin D status, we used monthly-specific tertiles of 25(OH)D as the dependant variable. For each month of the study period, the distribution of 25(OH)D is used to define the specific tertiles of 25(OH)D. The tertiles of the 25(OH) distribution restricted to blood samples conducted during the month of August were computed. Similarly, the tertiles of the 25(OH)D distribution were computed separately for each month of the year so that each month has specific tertiles of 25(OH)D. This approach is considered as the most valid measure of associations [24]. Multivariate linear and ordinal logistic regressions were conducted for vitamin D levels and vitamin D monthly-specific tertiles, respectively. We considered anthropometric, behavioural, biological, and environmental factors as variables of interest in the analyses. These variables were considered given their reported or potential influence on vitamin D level. To identify factors to be kept in multivariate models, univariate associations between vitamin D and attributes of interest were tested. Significances of p-values for keeping the attribute in the full model were set at <0.10. Regression diagnostics, including check for collinearity, were performed and the final models constructed accordingly. We considered oral contraceptive and hormone replacement therapy separately in sensitivity analyses. Significances of p-values for difference across groups and p-values for trends were set at <0.05. Conversion factor for 25(OH)D: 1 ng/ml = 2.496 nmol/l.
For the purpose of this analysis, BMI was categorised into <25.0 kg/m2, 25.0–29.9 kg/m2, ≥30 kg/m2; ethnicity was defined as Caucasian versus non-Caucasian; smoking status as never, current, and ex-smokers; high wine and fish consumptions were both defined as consumption of these items 3 or more days per week; physical activity was categorised as nearly never, <1×/month to 1×/week, and at least 2×/week, and tertiles of daily average minutes of walk were used.
The present analyses were restricted to participants with all variables of interest available (93%). A total of 1,309 subjects were included in the analysis. Characteristics by speaking region are detailed in table 1. The following characteristics statistically differed across regions: BMI (lower in the Italian-speaking region than in the other two regions), current smokers, albumin-corrected calcium, altitude, latitude, monthly sunshine hours, wine and fish consumptions, and times per week of physical exercise.
Figure 1
Adjusted mean 25(OH)D levels. A By period of the year. B By speaking region. C By BMI categories.
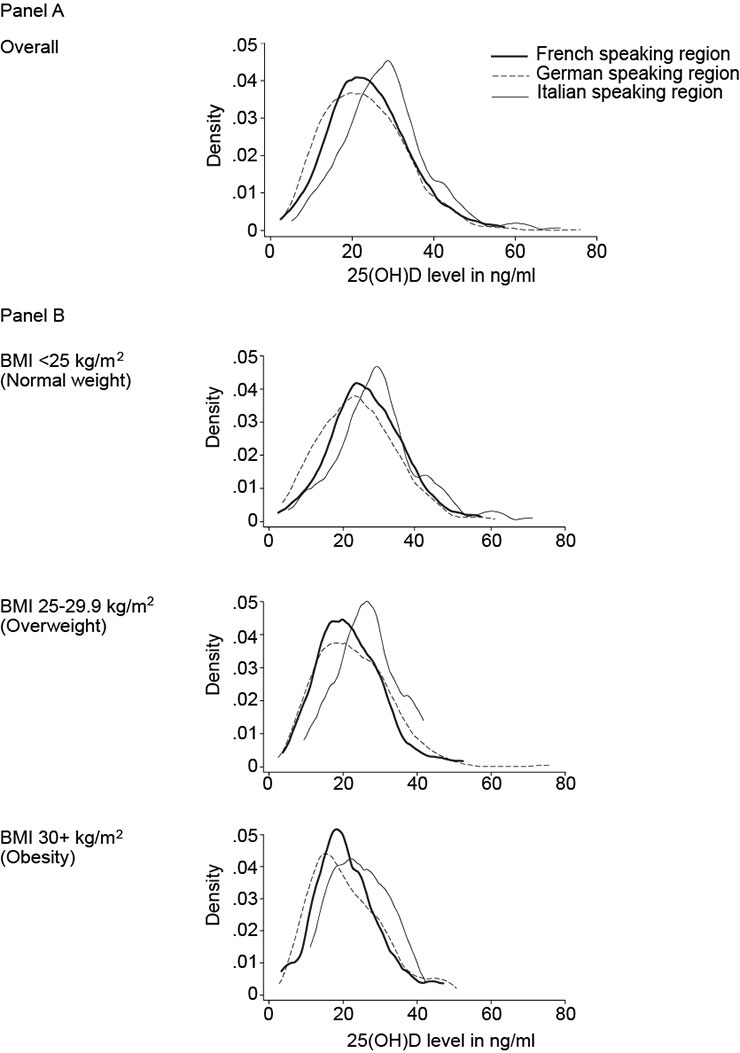
Figure 2
A 25(OH)D distribution by speaking regions. B 25(OH)D distribution by speaking regions, stratified by BMI categories.

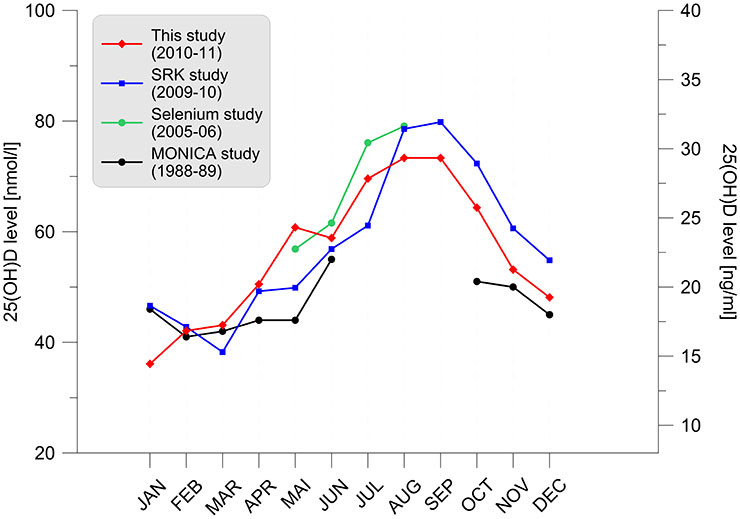
Figure 3
A Variation of the serum 25-hydroxyvitamin D distribution per month of examination for different studies. Lower and upper lines represent the 25th and 75th percentiles, respectively. The area between the 25th and 75th percentiles of our study is shaded (red) to enhance the readability of the data. Measured values are given in ng/ml (right axis) and nmol/l (left axis). Selenium and MONICA studies were not conducted over a full year and data points are therefore missing. B Variation of the serum 25-hydroxyvitamin D medians per month of examination for different studies.
The overall adjusted mean 25(OH)D level was 23.1 ng/ml (57.7 nmol/l) (95%CI: 22.6–23.6 [56.4–58.9]). The adjusted 25(OH)D mean was associated with the period of the year and speaking regions (fig. 1, panel A and B). Among all subjects, the adjusted 25(OH)D mean was 22.1 ng/ml (55.2 nmol/l) (20.3–24.1 ng/ml [50.7–60.2 nmol/l]), 22.9 ng/ml (57.2 nmol/l) (95%CI: 21.2–24.6 [52.9–61.4]), and 26.1 ng/ml (65.1 nmol/l) (95%CI: 23.2–29.1 [57.9–72.6]), respectively in the French-, German-, and Italian-speaking regions (p-value <0.001). The numbers (%) of participants not taking vitamin D supplementation or treatment by speaking regions were as follows: French-speaking n = 362 (95.3%), German-speaking n = 707 (96.2%), Italian-speaking n = 188 (96.9%). Differences across speaking regions remained significant when restricted to participants without vitamin D supplements or treatments: 21.7 ng/ml (54.2 nmol/l) (95%CI: 19.8‒23.7 [49.4–59.2]), 22.6 ng/ml (56.4 nmol/l) (95%CI: 20.9–24.4 [52.2–60.9]), and 25.6 ng/ml (63.9 nmol/l) (95%CI: 22.9–29.0 [57.2–72.4]), p-value <0.001.
Overall, the adjusted 25(OH)D mean was 29.0 ng/ml (72.4 nmol/l) (95%CI: 28.0–30.1 [69.9–75.1]), 22.1 ng/ml (55.2 nmol/l) (95%CI: 21.0–23.2 [52.4–57.9]), 17.2 ng/ml (42.9 nmol/l) (95%CI: 16.1–18.3 [40.2–45.7]), and 23.2 ng/ml (57.9 nmol/l) (95%CI: 22.3–24.1 [55.7–60.2]), respectively, in the July-September, October-December, January-March, and April-June periods (p-value <0.001). The numbers (%) of participants not taking vitamin D supplementation or treatment by period of the year were as follows: July-September n = 344 (95.6%), October-December n = 250 (94.3%), January-March n = 283 (96.9%), April–June n = 380 (96.9%). Differences across periods of the year remained significant when restricted to participants without vitamin D supplements or treatments: 28.9 ng/ml (72.1 nmol/l) (95%CI: 27.8–30.0 [69.4–74.9]), 21.6 ng/ml (53.9 nmol/l) (20.5–22.8 [51.2–56.9]), 16.9 ng/ml (42.2 nmol/l) (95%C)I: 15.8-18.0 [39.4–44.9]), and 22.9 ng/ml (57.2 nmol/l) (95%CI: 22.0–23.8 [54.9–59.4]), p-value <0.001.
Adjusted 25(OH)D means also differed by BMI categories (fig. 1, panel C). Among all subjects, the adjusted mean of 25(OH)D was 24.3 ng/ml (60.7 nmol/l) (95%CI: 23.6–25.1 [58.9–62.6]), 22.3 ng/ml (55.7 nmol/l) (95%CI: 21.3–23.2 [53.2–57.9]), and 20.3 ng/ml (50.7 nmol/l) (95%CI: 19.0–21.7 [47.4–54.2]), respectively in the normal, overweight, and obese categories (p-value <0.001). Differences across BMI categories remained significant when restricted to participants without vitamin D supplements or treatments (data not shown).
Figure 2 shows the distribution of 25(OH)D levels (ng/ml) by speaking region overall (panel A) and stratified by BMI categories (panel B). Overall and for each BMI categories, the distribution of 25(OH)D levels in the Italian-speaking region was shifted to higher values when compared with the French and German-speaking regions’ distributions.
Table 2 shows the prevalences of vitamin D sufficiency, insufficiency, and deficiency, by seasons, gender, and BMI categories. The prevalences of vitamin D insufficiency and deficiency were the highest in the January‒March period; 26.4% (21.6–31.7) and 61.6% (56.0–67.0), respectively. Restricted to non vitamin D supplements or treatment users, these prevalences were 25.4% (20.7–30.8) and 63.6% (57.8–69.0), respectively. The prevalence of vitamin D insufficiency or deficiency was highest among men throughout all period of the year; in the January‒March period, more than 9 of ten men were vitamin D insufficient or deficient. Among participants with obesity (i.e., BMI ≥30 kg/m2), the prevalences of vitamin D insufficiency and deficiency in the January‒March period were 21.3% (11.8–35.2) and 68.1% (53.6–79.8), respectively.
Prevalences of vitamin D sufficiency, insufficiency, and deficiency, by speaking regions, gender, and BMI categories are shown in table 3. The Italian-speaking region stood out with the lowest prevalence of vitamin D insufficiency or deficiency (74.2%, 76.4%, and 59.8% in the French-, German-, and Italian-speaking regions, respectively, p-value <0.001). Compared to the French and German-speaking regions, the prevalence of vitamin D insufficiency or deficiency in the Italian-speaking region remained lower in men, women, and in participants with BMI <25 kg/m2. There were no significant differences in vitamin D insufficiency or deficiency prevalences across speaking regions among participants who were overweight or obese.
Multivariate associations of characteristics with vitamin D monthly-specific tertiles are reported in table 4. An odds ratio greater than the null value (OR >1) in the table 4 suggests that the factor is associated with an increased likelihood of being in an upper 25(OH)D monthly-specific tertile than in the absence (otherwise mentioned) of the factor. Conversely, an odds ratio lower than the null value (OR <1) suggests that the factor is associated with a decreased likelihood of being in an upper 25(OH)D tertile than in the absence (otherwise mentioned) of the factor. BMI was negatively associated with vitamin D monthly-specific tertiles; each unit increase of BMI was associated with an 8% decreased likelihood of being in a higher vitamin D tertiles. Oral contraceptive, altitude, urinary excretion of calcium, use of vitamin D supplement or treatment, high wine consumption, physical activity were positively associated with vitamin D monthly-specific tertiles. In sensitivity analyses, oral contraceptive and not hormone replacement therapy drove the association (data not shown). Compared to the French-speaking region and after adjustment, the Italian-speaking region was associated with a higher likelihood of being in a higher vitamin D tertiles (OR: 1.66, 95%CI: 1.14–2.43).
The variation of 25(OH)D distribution during the examination year is depicted in figure 3across four Swiss studies. The winter nadir (February‒March) is almost identical in all studies whereas the fluctuation of summer apex (August-September) across studies is slightly larger. No major and systematic differences across studies are observed.
| Table 1:Characteristics of the 1,309 individuals from the Swiss Study on Salt Intake included in the analyses, by region. | |||||||||
| All regions (n = 1309) | French-speaking (n = 380) | German-speaking (n = 735) | Italian-speaking (n = 194) | p-value | |||||
| Mean or % | SD | Mean or % | SD | Mean or % | SD | Mean or % | SD | ||
| Age (years) | 48.8 | 18.2 | 48.1 | 17.3 | 49.4 | 17.3 | 46.9 | 28.4 | 0.18 |
| Women gender (%) | 51.3 | – | 51.8 | – | 51.0 | – | 51.5 | – | 0.93 |
| Body mass index (kg/m2) | 25.4 | 4.6 | 25.4 | 4.8 | 25.4 | 4.2 | 24.5 | 6.4 | 0.03 |
| Body mass index category (%) | 0.06 | ||||||||
| <25 kg/m2 | 52.2 | – | 53.8 | – | 50.3 | – | 61.9 | – | |
| 25.29.9 kg/m2 | 33.5 | – | 30.3 | – | 35.9 | – | 25.8 | – | |
| 30+ kg/m2 | 14.4 | – | 15.8 | – | 13.8 | – | 13.4 | – | |
| Diabetes (%) | 2.8 | – | 2.6 | – | 2.9 | – | 2.6 | – | 0.94 |
| Menopause (%) | 22.6 | – | 23.6 | – | 22.4 | – | 20.0 | 0.67 | |
| Oral contraceptive (%) | 17.2 | – | 20.0 | – | 15.7 | – | 17.5 | – | 0.11 |
| Caucasian ethnicity (%) | 98.3 | – | 97.6 | – | 98.4 | – | 100.0 | 0.31 | |
| Current smoker (%) | 16.7 | – | 20.8 | – | 14.8 | – | 14.9 | – | 0.014 |
| Albumin-corrected calcium (mmol/l) | 2.30 | 0.1 | 2.27 | 0.1 | 2.32 | 0.1 | 2.29 | 0.1 | <0.001 |
| Altitude (meters) | 487.6 | 188.6 | 545.1 | 233.7 | 470.3 | 125.7 | 367.5 | 237.5 | <0.001 |
| Latitude (degrees) | 47.0 | 0.5 | 46.4 | 0.2 | 47.4 | 0.2 | 46.1 | 0.2 | <0.001 |
| Mean monthly sunshine (hours) | 4.6 | 2.4 | 6.2 | 1.7 | 3.7 | 2.2 | 5.6 | 1.6 | <0.001 |
| Urinary excretion of calcium (mmol / 24 h) | 4.0 | 2.4 | 4.2 | 2.4 | 4.0 | 2.2 | 4.0 | 3.9 | 0.38 |
| Vitamin D supplement or treatment (%) | 4.1 | – | 4.7 | – | 3.8 | – | 3.1 | – | 0.56 |
| High wine consumption (%) | 35.6 | – | 42.6 | – | 32.8 | – | 28.4 | – | <0.001 |
| High fish consumption (%) | 5.8 | – | 9.8 | – | 4.0 | – | 4.2 | – | <0.001 |
| Daily average walk (minutes) | 58.3 | 73.0 | 53.1 | 53.5 | 60.9 | 76.8 | 58.9 | 111.0 | 0.16 |
| Tertiles of daily average walk (%) | 0.52 | ||||||||
| Lower tertile | 55.8 | – | 58.1 | – | 54.8 | – | 53.8 | – | |
| Middle tertile | 24.4 | – | 21.8 | – | 25.7 | – | 25.3 | – | |
| Upper tertile | 19.8 | – | 20.2 | – | 19.5 | – | 20.9 | – | |
| Times per week of physical activity (%) | <0.001 | ||||||||
| Nearly never | 16.6 | – | 25.1 | – | 11.7 | – | 21.5 | – | |
| <1×/month to 1×/week | 33.3 | – | 30.7 | – | 34.2 | – | 37.7 | – | |
| At least 2×/week | 50.1 | – | 44.1 | – | 54.1 | – | 40.8 | – | |
| Table 2:Prevalence of vitamin D sufficiency (30+ ng/ml), insufficiency (20–29.9 ng/ml), and deficiency (<20 ng/ml)*, by characteristics and period. | |||||||||||
| Analysis by season | |||||||||||
| All year (Jan‒Dec) | Jul‒Sept | Oct‒Dec | Jan‒Mar | Apr‒Jun | p-value | ||||||
| % | 95%CI | % | 95%CI | % | 95%CI | % | 95%CI | % | 95%CI | ||
| All subjects | <0.001 | ||||||||||
| 25(OH)-D 30+ ng/ml* | 25.3 | 23.0–27.8 | 44.0 | 38.7–49.4 | 22.0 | 17.4–27.6 | 12.0 | 8.7–16.2 | 22.8 | 18.8–27.3 | |
| 25(OH)-D 20–29.9 ng/ml | 36.5 | 33.9–39.2 | 39.1 | 33.9–44.5 | 35.5 | 29.8–41.6 | 26.4 | 21.6–31.7 | 43.2 | 38.3–48.3 | |
| 25(OH)-D <20 ng/ml | 38.2 | 35.5–40.9 | 16.9 | 13.2–21.4 | 42.5 | 36.5–48.7 | 61.6 | 56.0–67.0 | 34.0 | 29.4–39.0 | |
| Non-supplement users | <0.001 | ||||||||||
| 25(OH)-D 30+ ng/ml | 24.0 | 21.7–26.5 | 43.1 | 37.8–48.7 | 20.0 | 15.4–25.5 | 11.0 | 7.8–15.2 | 21.6 | 17.6–26.2 | |
| 25(OH)-D 20–29.9 ng/ml | 36.5 | 33.8–39.3 | 39.1 | 33.8–44.6 | 36.1 | 30.2–42.4 | 25.4 | 20.7–30.8 | 43.7 | 38.7–48.9 | |
| 25(OH)-D <20 ng/ml | 39.5 | 36.7–42.3 | 17.8 | 13.9–22.5 | 44.0 | 37.7–50.4 | 63.6 | 57.8–69.0 | 34.7 | 29.9–39.7 | |
| Men | <0.001 | ||||||||||
| 25(OH)-D 30+ ng/ml | 20.4 | 17.4–23.8 | 36.6 | 29.4–44.6 | 15.9 | 10.7–23.1 | 7.9 | 4.4–13.6 | 20.8 | 15.5–13.6 | |
| 25(OH)-D 20–29.9 ng/ml | 38.5 | 34.7–42.4 | 44.9 | 37.1–53.0 | 40.9 | 32.8–49.5 | 25.0 | 18.5–32.9 | 42.3 | 35.4–49.6 | |
| 25(OH)-D <20 ng/ml | 41.1 | 37.2–45.1 | 18.4 | 12.9–25.6 | 43.1 | 34.8–51.9 | 67.1 | 58.9–74.4 | 36.9 | 30.2–44.1 | |
| Women | <0.001 | ||||||||||
| 25(OH)-D 30+ ng/ml | 29.9 | 26.5–33.6 | 50.3 | 43.0–57.7 | 28.4 | 21.0–37.1 | 15.8 | 10.8–22.5 | 24.7 | 19.1–31.3 | |
| 25(OH)-D 20–29.9 ng/ml | 34.6 | 31.0–38.4 | 34.1 | 27.4–41.4 | 29.8 | 22.4–38.5 | 27.6 | 21.1–35.3 | 44.1 | 37.2–51.2 | |
| 25(OH)-D <20 ng/ml | 35.5 | 31.8–39.3 | 15.6 | 10.9–21.8 | 41.8 | 33.3–50.8 | 56.6 | 48.6–64.2 | 31.2 | 25.0–38.2 | |
| BMI <25 | <0.001 | ||||||||||
| 25(OH)-D 30+ ng/ml | 31.1 | 27.7–34.7 | 54.7 | 47.2–62.0 | 26.9 | 20.0–35.3 | 13.7 | 8.9–20.4 | 27.2 | 21.5–33.6 | |
| 25(OH)-D 20–29.9 ng/ml | 38.4 | 34.8–42.2 | 35.2 | 28.4–42.6 | 35.9 | 28.1–44.5 | 30.9 | 23.8–39.1 | 47.8 | 41.1–54.6 | |
| 25(OH)-D <20 ng/ml | 30.4 | 27.0–34.1 | 10.1 | 6.4–15.6 | 37.2 | 29.2–45.9 | 55.4 | 47.1–63.4 | 25.1 | 19.7–31.4 | |
| BMI 25–29.9 | <0.001 | ||||||||||
| 25(OH)-D 30+ ng/ml | 20.7 | 17.1–24.8 | 38.3 | 28.9–48.6 | 18.9 | 12.2–28.1 | 10.6 | 6.0–18.1 | 18.1 | 12.2–26.0 | |
| 25(OH)-D 20–29.9 ng/ml | 35.1 | 30.6–39.8 | 41.3 | 31.7–51.6 | 37.2 | 28.1–47.3 | 23.1 | 16.0–32.1 | 39.7 | 31.3–48.6 | |
| 25(OH)-D <20 ng/ml | 44.2 | 39.4–49.1 | 20.4 | 13.3–29.9 | 43.9 | 34.1–54.1 | 66.3 | 56.8–74.7 | 42.2 | 33.7–51.2 | |
| BMI 30+ | 0.010 | ||||||||||
| 25(OH)-D 30+ ng/ml | 15.7 | 11.1–21.8 | 22.7 | 14.0–34.6 | 10.8 | 3.5–28.6 | 10.6 | 4.5–23.2 | 15.2 | 7.0–29.9 | |
| 25(OH)-D 20–29.9 ng/ml | 32.8 | 26.3–40.1 | 46.7 | 34.4–59.3 | 28.0 | 14.8–46.5 | 21.3 | 11.8–35.2 | 30.2 | 18.4–45.4 | |
| 25(OH)-D <20 ng/ml | 51.5 | 44.1–58.8 | 30.6 | 20.2–43.5 | 61.2 | 42.7–77.0 | 68.1 | 53.6–79.8 | 54.6 | 39.5–68.8 | |
| * Expressed in nmol/l, these categories correspond to vitamin D sufficiency (>75 nmol/l), insufficiency (50‒75 nmol/l), and deficiency (<50 nmol/l) | |||||||||||
| Table 3:Prevalence of vitamin D sufficiency (30+ ng/ml), insufficiency (20‒29.9 ng/ml), and deficiency (<20 ng/ml)*, by characteristics and region. | |||||||||
| All regions | Analysis by region | p-value | |||||||
| French-speaking | German-speaking | Italian-speaking | |||||||
| % | 95%CI | % | 95%CI | % | 95%CI | % | 95%CI | ||
| All subjects | <0.001 | ||||||||
| 25(OH)-D 30+ ng/ml* | 25.3 | 23.0–27.8 | 25.8 | 21.6–30.4 | 23.5 | 20.6–26.7 | 40.2 | 33.5–47.3 | |
| 25(OH)-D 20–29.9 ng/ml | 36.5 | 33.9–39.2 | 38.2 | 33.4–43.2 | 35.2 | 31.9–38.7 | 40.2 | 33.5–47.3 | |
| 25(OH)-D <20 ng/ml | 38.2 | 35.5–40.9 | 36.0 | 31.4–41.0 | 41.2 | 37.7–44.8 | 19.6 | 14.6–25.8 | |
| Non-supplement users | <0.001 | ||||||||
| 25(OH)-D 30+ ng/ml | 24.0 | 21.7–26.5 | 24.3 | 20.2–29.0 | 22.2 | 19.3–25.4 | 39.9 | 33.1–47.1 | |
| 25(OH)-D 20‒29.9 ng/ml | 36.5 | 33.8–39.3 | 38.1 | 33.2–43.2 | 35.4 | 31.9–38.9 | 39.9 | 33.1–47.1 | |
| 25(OH)-D <20 ng/ml | 39.5 | 36.7–42.3 | 37.6 | 32.7–42.7 | 42.4 | 38.8–46.1 | 20.2 | 15.1–26.6 | |
| Men | 0.002 | ||||||||
| 25(OH)-D 30+ ng/ml | 20.4 | 17.4–23.8 | 18.0 | 13.1–24.3 | 19.7 | 15.9–24.2 | 39.4 | 30.0–49.6 | |
| 25(OH)-D 20-29.9 ng/ml | 38.5 | 34.7–42.4 | 38.2 | 31.5–45.5 | 38.1 | 33.2–43.2 | 43.6 | 33.9–53.8 | |
| 25(OH)-D <20 ng/ml | 41.1 | 37.1–45.1 | 43.7 | 36.7–51.0 | 42.2 | 37.2–47.4 | 17.0 | 10.7–26.0 | |
| Women | <0.001 | ||||||||
| 25(OH)-D 30+ ng/ml | 29.9 | 26.5–33.6 | 33.0 | 26.8–39.9 | 27.2 | 22.9–31.9 | 41.0 | 31.8–50.1 | |
| 25(OH)-D 20-29.9 ng/ml | 34.6 | 31.0–38.4 | 38.1 | 31.5–45.1 | 32.5 | 28.0–37.4 | 37.0 | 28.1–46.9 | |
| 25(OH)-D <20 ng/ml | 35.4 | 31.8–39.3 | 28.9 | 23.0–35.7 | 40.2 | 35.4–45.3 | 22.0 | 14.9–31.2 | |
| BMI <25 | <0.001 | ||||||||
| 25(OH)-D 30+ ng/ml | 31.1 | 27.7–34.7 | 35.3 | 29.0–42.1 | 26.9 | 22.6–31.7 | 45.8 | 37.1–54.8 | |
| 25(OH)-D 20–29.9 ng/ml | 38.4 | 34.8–42.2 | 40.2 | 33.7–47.1 | 37.5 | 32.7–42.6 | 38.3 | 30.1–47.3 | |
| 25(OH)-D <20 ng/ml | 30.4 | 27.0–34.1 | 24.5 | 19.2–30.9 | 35.6 | 30.9–40.6 | 15.8 | 10.3–23.5 | |
| BMI 25–29.9 | 0.121 | ||||||||
| 25(OH)-D 30+ ng/ml | 20.7 | 17.1–24.8 | 16.5 | 10.8–24.5 | 21.7 | 17.1–27.1 | 32.0 | 20.6–46.1 | |
| 25(OH)-D 20–29.9 ng/ml | 35.1 | 30.6–39.8 | 33.9 | 25.8–58.6 | 35.0 | 29.5–40.9 | 44.0 | 31.0–57.9 | |
| 25(OH)-D <20 ng/ml | 44.2 | 39.4–49.1 | 49.6 | 40.5–58.6 | 43.3 | 37.5–49.4 | 24.0 | 14.2–37.7 | |
| BMI 30+ | 0.141 | ||||||||
| 25(OH)-D 30+ ng/ml | 15.7 | 11.1–21.8 | 11.7 | 5.7–22.5 | 16.8 | 10.7–25.4 | 29.2 | 14.6–49.9 | |
| 25(OH)-D 20‒29.9 ng/ml | 32.8 | 26.3–40.1 | 40.0 | 28.4–52.8 | 27.7 | 19.9–37.2 | 41.7 | 24.1–61.6 | |
| 25(OH)-D <20 ng/ml | 51.5 | 44.1–58.8 | 48.3 | 36.0–60.8 | 55.4 | 45.6–64.8 | 29.2 | 14.6–49.9 | |
| * Expressed in nmol/l, these categories correspond to vitamin D sufficiency (>75 nmol/l), insufficiency (50–75 nmol/l), and deficiency (<50 nmol/l) | |||||||||
| Table 4:Multivariate association (ordinal logistic regression) of characteristics with monthly-specific tertiles of 25(OH)D. | |||
| OR* | 95%CI | p-value | |
| Age, per 1 year increase | 0.99 | 0.99–1.00 | 0.892 |
| Women vs men | 1.02 | 0.76–1.39 | 0.850 |
| Body Mass Index, per 1 unit increase | 0.92 | 0.89–0.95 | <0.001 |
| Diabetes | 0.64 | 0.27–1.50 | 0.306 |
| Menopause | 1.03 | 0.68–1.59 | 0.874 |
| Oral contraceptive | 1.77 | 1.22–2.56 | 0.003 |
| Caucasian ethnicity | 2.81 | 0.95–8.28 | 0.062 |
| Smoking status | |||
| Never smoker | Ref | – | – |
| Current smoker | 1.15 | 0.81–1.61 | 0.430 |
| Ex-smoker | 1.01 | 0.77–1.32 | 0.957 |
| Albumin-corrected calcium (mmol/l), per 0.1 mmol/l increase | 1.09 | 0.95–1.25 | 0.227 |
| Altitude, per 100 meters increase | 1.08 | 1.00–1.17 | 0.033 |
| Mean monthly sunshine hours, per 1 hour increase | 0.95 | 0.90–1.01 | 0.095 |
| Urinary excretion of calcium, per 1 mmol / 24 h increase | 1.10 | 1.04–1.16 | <0.001 |
| Vitamin D supplement or treatment (%) | 4.79 | 2.45–9.38 | <0.001 |
| High wine consumption | 1.37 | 1.07–1.76 | 0.013 |
| High fish consumption | 1.27 | 0.80–2.01 | 0.302 |
| Tertiles of daily average minutes of walk | |||
| Lower tertile | Ref | – | – |
| Middle tertile | 1.29 | 0.97–1.73 | 0.083 |
| Upper tertile | 1.19 | 0.88–1.59 | 0.249 |
| Times per week of physical activity (%) | |||
| Nearly never | Ref | – | – |
| <1×/month to 1×/week | 1.12 | 0.77–1.65 | 0.550 |
| At least 2×/week | 1.63 | 1.13–2.35 | 0.009 |
| Region | |||
| French-speaking | Ref | – | – |
| German-speaking | 1.34 | 0.98–1.83 | 0.068 |
| Italian-speaking | 1.66 | 1.14–2.43 | 0.009 |
| * Odds ratio of being in a higher tertiles of 25(OH)D than the reference group. | |||
In this population-based study, we show that the prevalence of vitamin D insufficiency or deficiency in the Swiss adult population is high and varies by period of the year, BMI categories, and speaking regions. The association of speaking-regions with vitamin D status was independent of major potential confounders.
The overall prevalence of vitamin D deficiency or insufficiency was 74.7% and increased to 76.0% among participants not taking vitamin D supplement or treatment. While the health impact of vitamin D insufficiency is debated [25], 39.5% of the participants not taking vitamin D supplement or treatment (95.9% of our overall sample) presented a vitamin D level <20 ng/ml (50 nmol/l) (i.e. vitamin D deficiency). Current evidence supports the notion that 25(OH)D concentrations of at least 20 ng/ml (50 nmol/l) are necessary to support bone health in all adults and muscle health in older adults [26].
Most of the vitamin D is produced in the skin from 7-dehydrocholesterol by sunlight UVB exposure. In a region such as Switzerland (latitude about 45 o) vitamin D effective UVB radiation is lower in the winter and fall periods than in the spring and summer periods [27]. The highest prevalence of vitamin D insufficiency and deficiency in our study were observed during the October‒December and January‒March periods. Thus, when there is ineffective exposition to sunlight, sufficient vitamin D levels are clearly not reached in the Swiss adult population. There is no evidence showing that adequate level throughout the seasons is essential for vitamin D to be beneficial, notably for bone or muscle health outcomes. Yet, given the central roles of vitamin D in regulating calcium absorption, promoting bone resorption and maintaining calcium and phosphate levels for bone formation, it seems very unlikely that vitamin D deficiency during meaningful periods of the year is without any biological and health implications.
Vitamin D levels and prevalence were also clearly associated with BMI. This is in line with previous studies [28]. There are several mechanisms by which vitamin D levels could be inversely associated with BMI including the decrease of outdoor physical activity, the inadequate diet, and the sequestration of vitamin D in the cutaneous fat among people with overweight or obesity [29]. The reason for the increasing prevalence of vitamin D deficiency observed in the United States could be in part due to the increase of BMI [30].
The mean level of 25(OH)D in the Swiss adult population (about 23 ng/ml [57 nmol/l]) is similar to Western European countries (e.g., 20 ng/ml [50 nmol/l] in France), higher than Southern European countries (e.g., 18 ng/ml [45 nmol/l] in Italy), and lower than Northern European countries (e.g., 30 ng/ml [75 nmol/l] and 27 ng/ml [67 nmol/l] in Norway and Sweden, respectively) [12]. The higher and lower serum 25(OH)D levels in Northern and respectively Southern European countries, are probably mediated by the high intake of fish and cod liver oil in Northern countries, and by skin pigmentation and sunshine avoiding behaviors in Southern countries [12].
Reasons for the better status in vitamin D among subjects in the Italian-speaking region compared to subjects in the French- and German-speaking regions are not clear. One possible explanation is residual confounding. We adjusted for sunshine hours, altitude, and latitude because theoretically, persons living in regions with greater sunshine hours, higher altitude, and lower latitude should present higher levels of vitamin D than persons in regions without these characteristics [27]. In practice however, since more than 90% of vitamin D arises from sunlight (in the absence of supplementation), vitamin D levels also depend on cultural behaviours such as clothing, time spent outdoor, sunbathing habits [31]. Although we adjusted for physical activity and weekly hours of walking to account for the time spent outdoors, we missed information on other behaviours that might influence vitamin D levels. It is unlikely that differences in skin pigmentation explain the highest vitamin D levels in the Italian-speaking region. While we cannot exclude residual confounding, the strong association of vitamin D status with speaking regions in Switzerland deserve attention and should be further explored.
Our analyses show that vitamin D is independently associated with BMI, altitude, and vitamin D supplements/medications, which is consistent with previous reports [30, 32, 33]. We also report associations of vitamin D levels with oral contraceptive/hormone replacement therapy and wine consumption. Oral contraceptive use increases circulating levels of 25OHD, likely because estrogen increases vitamin D binding protein expression and stimulates the renal 1,alpha-hydroxylase [34, 35]. We considered oral contraceptive and hormone replacement therapy separately in sensitivity analyses and found that oral contraceptive and not hormone replacement therapy drove the association. Molecular evidence suggests that phytoestrogens such as the resveratrol present in red wine may regulate the vitamin D receptor promoter and could enhance the effects of vitamin D [36]. Vitamin D could therefore mediate part of the effects and mechanisms of action of red wine consumption on the risk of CVD [37]. Our results confirmed that information on contraceptive use and wine consumption should be considered when interpreting 25OHD values.
Although limited, data from the literature suggest that the prevalence of vitamin D deficiency has increased this past decade. For example, age-adjusted mean serum 25(OH)D concentrations were 5–20 nmol/l lower in NHANES 2000–2004 than in NHANES III (1988–1994) [30, 38]. Reasons for increasing prevalence of vitamin D deficiency are not clear but include the increase in BMI [30]. Trends data on 25(OH)D levels based on a same source population in Switzerland are currently lacking. When comparing the 25(OH)D levels of the 2010–2011 SSS study to those of the 1988–1989 Swiss MONICA project and the 2009–2010 SRK and 2005–2006 Selenium studies for identical periods of the year, we observed no major change in the last two decades. We acknowledge the limitation of this comparison given the difference in methodologies and study designs. These comparisons must therefore be interpreted with caution.
These results should be interpreted in the light of the study’s strengths and limitations. This is the first population-based study covering the three linguistic regions of Switzerland, taking into account geographical and meteorological information. We measured vitamin D status (25(OH)D) by the gold standard technique (LC-MS/MS). Information on major known potential confounders was available. However, despite these efforts, information is still incomplete. For example, information on the darkness of the skin was missing and we used self-reported ethnicity to categorise participants into Caucasians and non-Caucasians. In fact, the packaging and size of melanosomes in the keratocytes influence darkness of the skin, and dark pigment does reduce the skin’s ability to synthesise vitamin D from sunlight by up to 95% [33, 39]. However, the proportion of non-Caucasians was very low in the studied population, so this aspect is very unlikely to explain the observed low levels of vitamin D.
We did not use a comprehensive food frequency questionnaire. Diet however, contains only small amounts of vitamin D (i.e., vitamin D3 or vitamin D2), and information on fish consumption was collected, which is the major dietary source of vitamin D in humans. We did not take air pollution, ozone, time of the day, reflectivity and cloud cover into account. These weather-related factors do influence vitamin D effective radiation and thus vitamin D photosynthesis [27], although the impact is likely to be minor.
The prevalence of vitamin D deficiency and insufficiency depends on the definition used. We have based our analyses on the most recent definition of vitamin D deficiency by the 2011 US Report on Dietary Reference Intakes for Calcium and Vitamin D from the Institute of Medicine (IOM) [25]. The IOM committee concluded that a serum 25-hydroxyvitamin D level of 20 ng/ml (50 nmol/l) is desirable for bone and overall health. While vitamin D deficiency defined as a serum 25(OH)D of <20 ng/ml (50 nmol/l), and vitamin D insufficiency defined as a 25(OH)D of between 20 and 29 ng/ml (50–75 nmol/L) have been extensively used in epidemiological studies, the definition of vitamin D insufficiency is more controversial [25]. Of note, a 25(OH)D level of at least 20 ng/ml (50 nmol/l) was chosen by the IOM to define the vitamin D recommended dietary allowances of 600 IU/day for ages 1–70 years and 800 IU/day for ages 71 years and older, to meet the requirements of at least 97.5% of the population.
The low participation rate limits the external validity of our findings. We explain the low participation rate in the SSS study by the unattractiveness of 24-hour urine collection, which necessitates two visits to the health centre, together with the two-stage sampling strategy, which implies that the person we contacted by phone was not automatically the one randomly selected to enter the study. As a consequence, the contact letter was not directly addressed to the person who subsequently took part in the study.
Low levels of blood vitamin D are common among Swiss adults, in particular during winter months, in overweight and obese adults, and outside the Italian-speaking region. This is of potential concern considering the role of vitamin D in key biological processes.
Further epidemiological studies should assess the impact of vitamin deficiency on the key chronic and degenerative diseases, and further assess the impact of dietary supplements on the improvement of levels of vitamin D. If considered as substantial, an experimental introduction of vitamin supplement in a population-wide experiment should be developed, implemented and carefully monitored.
Funding / potential competing interests: The Swiss Study on Salt Intake was supported by the Swiss Federal Office of Public Health (contracts N09.004165/404.0101/-2 and 09.005791/414.0000/-74). The Service of Nephrology and Hypertension and the Institute of Social and Preventive Medicine, both of the Lausanne University Hospital, Switzerland provided additional logistical support. MBo is supported by the Swiss School of Public Health Plus. IG is supported by a grant from the Swiss Foundation for Science (33CM30-124087). DC received research grants from the Swiss Foundation for Science (PP00P3_133681). No other potential conflict of interest relevant to this article was reported.
Correspondence:Professor Murielle Bochud, MD, PhD, Community Prevention Unit, Institute of Social and Preventive Medicine (IUMSP), Lausanne University Hospital, 10, Rte de la Corniche, CH-1010 Lausanne, Switzerland, murielle.bochud[at]chuv.ch
Acknowledgment:The authors are grateful to all study participants and study collaborators.
1 Holick MF. Vitamin D: important for prevention of osteoporosis, cardiovascular heart disease, type 1 diabetes, autoimmune diseases, and some cancers. South Med J. 2005;98(10):1024–7.
2 Holick MF. The vitamin D epidemic and its health consequences. J Nutr. 2005;135(11):2739S–48S.
3 Holick MF. Vitamin D deficiency. N Engl J Med. 2007;357(3):266–81.
4 Guessous I, Bochud M, Bonny O, Burnier M. Calcium, vitamin D and cardiovascular disease. Kidney Blood Press Res. 2011;34(6):404–17.
5 Penckofer S, Kouba J, Wallis DE, Emanuele MA. Vitamin D and diabetes: let the sunshine in. Diabetes Educ. 2008;34(6):939–40.
6 Holick MF. Diabetes and the vitamin d connection. Curr Diab Rep. 2008;8(5):393–8.
7 Bertone-Johnson ER. Vitamin D and the occurrence of depression: causal association or circumstantial evidence? Nutr Rev. 2009;67(8):481–92.
8 Holick MF. Evolution, biologic functions, and recommended dietary allowance for vitamin D. Vitamin D: physiology, molecular biology and clinical applications. New Jersey: Human Press; 1999. p. 1–16.
9 U.S. Department of Agriculture ARS. USDA National Nutrient Database for Standard Reference. 2011, [cited 2012 October 08]. Available from: http://www.ars.usda.gov/ba/bhnrc/ndl.
10 Holick MF. Vitamin D: a millenium perspective. J Cell Biochem. 2003;88(2):296–307.
11 Rosen CJ. Clinical practice. Vitamin D insufficiency. N Engl J Med. 2011;364(3):248–54.
12 van Schoor NM, Lips P. Worldwide vitamin D status. Best Pract Res Clin Endocrinol Metab. 2011;25(4):671–80.
13 Holick MF, Chen TC. Vitamin D deficiency: a worldwide problem with health consequences. Am J Clin Nutr. 2008;87(4):1080S–6S.
14 Burnand B, Sloutskis D, Gianoli F, Cornuz J, Rickenbach M, Paccaud F, et al. Serum 25-hydroxyvitamin D: distribution and determinants in the Swiss population. Am J Clin Nutr. 1992;56(3):537–42.
15 Chappuis A, Bochud M, Glatz N, Vuistiner P, Paccaud F, Burnier M. Swiss survey on salt intake: main results. 2011 [cited 2012 Jun 03]. Available from: http://www.bag.admin.ch/themen/ernaehrung_bewegung/05190/05294/12869/index.html.
16 Levey AS, Stevens LA, Schmid CH, Zhang YL, Castro AF 3rd, Feldman HI, et al. A new equation to estimate glomerular filtration rate. Ann Intern Med. 2009;150(9):604–12.
17 Yetley EA, Pfeiffer CM, Schleicher RL, Phinney KW, Lacher DA, Christakos S, et al. NHANES monitoring of serum 25-hydroxyvitamin D: a roundtable summary. J Nutr. 2010;140(11):2030S–45S.
18 de la Hunty A, Wallace AM, Gibson S, Viljakainen H, Lamberg-Allardt C, Ashwell M. UK Food Standards Agency Workshop Consensus Report: the choice of method for measuring 25-hydroxyvitamin D to estimate vitamin D status for the UK National Diet and Nutrition Survey. Br J Nutr. 104(4):612–9.
19 National Institute of Standards and Technology. Certificate of analysis, standard reference material 972, vitamin D in human serum. Gaithersburg (MD): NIST; 2009 [cited 2012 Jun 03]. Available from: https://www-s.nist.gov/srmors/certificates/972.pdf.
20 Norman PE, Powell JT. Vitamin D, shedding light on the development of disease in peripheral arteries. Arterioscler Thromb Vasc Biol. 2005;25:39–46.
21 Burri J, Haldimann M, Dudler V. Selenium status of the Swiss population: assessment and change over a decade. J Trace Elem Med Biol. 2008;22(2):112–9.
22 Heeringa S, West B, Berglund P. Applied Survey Data Analysis. Sciences SitSaB, editor: Chapman & Hall/CRC; 2010.
23 Ross AC, Manson JE, Abrams SA, Aloia JF, Brannon PM, Clinton SK, et al. The 2011 report on dietary reference intakes for calcium and vitamin D from the Institute of Medicine: what clinicians need to know. J Clin Endocrinol Metab. 2011;96(1):53–8.
24 Wang Y, Jacobs EJ, McCullough ML, Rodriguez C, Thun MJ, Calle EE, et al. Comparing methods for accounting for seasonal variability in a biomarker when only a single sample is available: insights from simulations based on serum 25-hydroxyvitamin d. Am J Epidemiol. 2009;170(1):88–94.
25 Ross AC, Manson JE, Abrams SA, Aloia JF, Brannon PM, Clinton SK, et al. The 2011 report on dietary reference intakes for calcium and vitamin D from the Institute of Medicine: what clinicians need to know. J Clin Endocrinol Metabo. 2011;96(1):53–8.
26 Nutrition FFCf. Vitamin D deficiency: evidence, safety and recommendations for the Swiss population – summary. 2012 [cited 2012 October 08]. Available from: http://www.bag.admin.ch/themen/ernaehrung_bewegung/05207/13246/index.html?lang=en.
27 Kimlin MG. Geographic location and vitamin D synthesis. Mol Aspects Med. 2008;29(6):453–61.
28 Earthman CP, Beckman LM, Masodkar K, Sibley SD. The link between obesity and low circulating 25-hydroxyvitamin D concentrations: considerations and implications. Int J Obes (Lond). 2012;36(3):387–96.
29 Wortsman J, Matsuoka LY, Chen TC, Lu Z, Holick MF. Decreased bioavailability of vitamin D in obesity. Am J Clin Nutr. 2000;72(3):690–3.
30 Looker AC, Pfeiffer CM, Lacher DA, Schleicher RL, Picciano MF, Yetley EA. Serum 25-hydroxyvitamin D status of the US population: 1988-1994 compared with 2000-2004. Am J Clin Nutr. 2008;88(6):1519–27.
31 Hagenau T, Vest R, Gissel TN, Poulsen CS, Erlandsen M, Mosekilde L, et al. Global vitamin D levels in relation to age, gender, skin pigmentation and latitude: an ecologic meta-regression analysis. Osteoporos Int. 2009;20(1):133–40.
32 Scragg R, Thadhani R, Camargo CA, Jr. Association between altitude and mortality in incident dialysis patients. JAMA. 2009;301(23):2442–3.
33 Holick MF, Chen TC, Lu Z, Sauter E. Vitamin D and skin physiology: a D-lightful story. J Bone Miner Res. 2007;22(Suppl 2):V28–33.
34 Harris SS, Dawson-Hughes B. The association of oral contraceptive use with plasma 25-hydroxyvitamin D levels. J Am Coll Nutr. 1998;17(3):282–4.
35 Aarskog D, Aksnes L, Markestad T, Rodland O. Effect of estrogen on vitamin D metabolism in tall girls. J Clin Endocrinol Metab. 1983;57(6):1155–8.
36 Wietzke JA, Welsh J. Phytoestrogen regulation of a Vitamin D3 receptor promoter and 1,25-dihydroxyvitamin D3 actions in human breast cancer cells. J Steroid Biochem Mol Biol. 2003;84(2–3):149–57.
37 Wollin SD, Jones PJ. Alcohol, red wine and cardiovascular disease. J Nutr. 2001;131(5):1401–4.
38 Looker AC, Lacher DA, Pfeiffer CM, Schleicher RL, Picciano MF, Yetley EA. Data advisory with regard to NHANES serum 25-hydroxyvitamin D data. Am J Clin Nutr. 2009.
39 Clemens TL, Adams JS, Henderson SL, Holick MF. Increased skin pigment reduces the capacity of skin to synthesise vitamin D3. Lancet. 1982;1(8263):74–6.