Acute respiratory health effects of urban air pollutants in adults with different patterns of underlying respiratory disease
DOI: https://doi.org/10.4414/smw.2012.13681
Amar J
Mehta, Christian
Schindler, Laura
Perez, Nicole
Probst-Hensch, Joel
Schwartz, Otto
Brändl, Werner
Karrer, Jean Marie
Tschopp, Thierry
Rochat, Nino
Künzli
Summary
OBJECTIVE: Whether underlying chronic respiratory diseases are susceptible factors for symptomatic episodes, which lead to primary-level care, in association with air pollutant exposures is unknown. We evaluated and compared association lag structures between daily ambient levels of nitrogen dioxide (NO2) and total suspended particulates (TSP) and respiratory symptom-related doctor visits in adults with different patterns of underlying chronic respiratory disease.
METHODS: In a time-stratified case-crossover analysis nested within a diary panel study, 459 Swiss adult participants with asthma, chronic bronchitis, chronic obstructive pulmonary disease (COPD) and healthy participants recorded occurrence of respiratory-symptom related doctor visits (n = 1,048) in one to six four-week intervals over two years. For each disease subgroup, odds ratios (ORs) for doctor visit were estimated as a function of NO2 or TSP concentrations (per 10 micrograms per cubic meter [µg/m3]) lagged between 0–13 days in a polynomial distributed lag model.
RESULTS: Higher ORs for NO2 in participants with COPD (OR: 1.17, 95%CI: 1.02–1.35) and asthma (OR: 1.15, 95%CI: 1.02–1.30) occurred at exposure lags of two and five days, respectively. Doctor visits increased by 9.1% (95%CI: 3.2–15.4%) and 4.2% (95%CI: 1.2–7.2%) over the first week following a 10 µg/m3 increase in NO2 concentration in the COPD and chronic bronchitis subgroups, respectively. The percent increase in the COPD subgroup was significantly greater (p <0.05) when compared with the healthy subgroup. Observed findings were similar for TSP.
CONCLUSIONS: Respiratory problems leading to a doctor visit, associated with an increase in exposure to NO2 and TSP, may have a faster dynamic in individuals with COPD.
Abbreviations
95% CI Ninety-five percent confidence interval
AP Atmospheric pressure
AUC Area under the curve
CLR Conditional logistic regression
COPD Chronic obstructive pulmonary disease
FEV1/FVC Forced expiratory volume in 1 second over forced vital capacity
FEV1 Forced expiratory volume in one second
µg/m3 Microgram per cubic meter
NO2 Nitrogen dioxide
OR Odds ratio
PM2.5 Particulate matter of 2.5 micrometers in diameter
PM10 Particulate matter of 10 micrometers in diameter
RH Relative humidity
SAPALDIA Swiss Cohort Study on Air Pollution and Lung Diseases in Adults
T Temperature
TSP Total suspended particulates
Introduction
The effect of air pollution on respiratory morbidity and mortality in adults is well documented in epidemiologic studies which examine severe outcomes including emergency room visits or hospitalisations. There is also evidence to suggest that individuals with underlying chronic respiratory disease including asthma or chronic obstructive pulmonary disease (COPD) are more susceptible to the acute effects of air pollutants including aggravation of respiratory symptoms, hospitalisations, and mortality [1–4].
Less is known about the effect of air pollution on respiratory outcomes in the context of a primary healthcare setting, such as visits to the doctor for general consultation or doctors’ house calls in relation to respiratory symptoms or disease [5–8]. Symptomatic respiratory episodes leading to subsequent primary care are likely to be less severe than those that lead to emergency care, but they may also be more common, resulting in time off from work for the doctor visit or for home recuperation, suggesting a large impact in terms of public health and societal costs. Doctor visits may serve as a useful indicator for the health effects of air pollution in the acute time domain. Whether adults with underlying chronic respiratory diseases are more susceptible to respiratory symptom-related doctor visits in association with air pollutant exposure is unknown.
The purpose of this study was to investigate the effects of current levels of ambient nitrogen dioxide (NO2) and total suspended particulates (TSP), as markers of traffic-related particulate matter, on doctor visits for respiratory problems in a large diary panel study of adults that was conducted in 1992 and 1993 as part of the Swiss Cohort Study on Air Pollution and Lung and Heart Diseases in Adults (SAPALDIA). While the data from the SAPALDIA diary study was collected nearly 20 years ago, the size of the diary panel study is unprecedented, and the time patterns of exposure-response over a long duration have not been addressed in the literature. Furthermore, while air quality in Switzerland may have changed over time, air quality in Switzerland from the early 1990’s is still a reasonable proxy of air quality in many other places in the world. Many of the diary study participants were also present with symptoms consistent with asthma, chronic bronchitis, and COPD, thus providing a unique opportunity to evaluate association lag structures in short-term effects of air pollutant levels related to primary care in adults with different patterns of underlying chronic disease.
Methods
Study population and design
SAPALDIA is a multicenter and population based prospective cohort study consisting of a random sample of 9,561 adults between the ages of 18–60 recruited from eight regions (Aarau, Basel, Davos, Geneva, Lugano, Montana, Payerne, and Wald) in Switzerland. Baseline examination occurred in 1991 where participants were administered a detailed respiratory health questionnaire and underwent allergy, lung function, and methacholine challenge testing [9, 10]. A subset of the study population at baseline (n = 5,383) was invited to enrol in a longitudinal diary study spanning 1992 and 1993 [11, 12]. Participants with a higher probability of reporting respiratory symptoms in the baseline survey were over-sampled for inclusion in the diary study to enhance the study's statistical power to detect associations between air pollution and lung diseases. Accordingly, meeting one of the following criteria assessed in the baseline survey was sufficient for a subject to be eligible for participation in the diary study: (1.) an affirmative answer to at least one of a set of 10 questions on respiratory symptoms; (2.) a ratio between forced expiratory volume in 1 second (FEV1) and forced vital capacity that was less than 80% of the value predicted by European Community Coal and Steel norms; (3.) a decline in FEV1, of at least 20% from baseline during the bronchochallenge test; and (4.) satisfying none of the above criteria and being a non-smoker. All participants fulfilling at least one of the first three criteria at the baseline survey were invited to enroll in the diary study. Participants fulfilling the fourth criterion were restricted to a random sample of 150 non-symptomatic non-smokers per area [11]. Of the 5,383 individuals invited to enrol, 3,279 participated (60.9%) [11, 12]. Ethical approval for this study was given by the ethics committees of the participating cantons in each study region.
The diary study participants completed up to 6 diary periods of 4 weeks in duration, in 1992 and 1993, during which they recorded daily occurrence of respiratory symptoms and visits to the doctor for respiratory symptoms. Of the 3,279 diary study participants, we included the 459 individuals in this analysis who reported at least one doctor visit for a total of 1,048 visits. A time-stratified case-crossover analysis was developed, where for each participant a day with a reported doctor visit (case-day) was matched with all days absent of a doctor visit (control-day) that occurred in the diary period by weekday [13]. Case and control-days were excluded from the analysis if the participant did not report being present in the study area on that day. For this analysis, there was complete information on NO2 exposure and other covariates in 914 case-days (i.e., reported doctor visits) and 2,362 control-days; for TSP, there were 892 case-days and 2,230 control-days with complete information.
Definition of subgroups
Of the 459 participants, 374 were divided into subgroups of having asthma (n = 78), chronic bronchitis (n = 189) or COPD (n = 54), or who were healthy (n = 116). Presence of asthma was derived from positive responses to the following questions, “Have you ever had asthma?’’ and ‘‘was this confirmed by a doctor?’’. Chronic bronchitis was defined as self-report of cough or phlegm during the day or at night on most days for as much as 3 months each year for ≥2 years. COPD was defined as a ratio of forced expiratory volume in 1 second over forced vital capacity (FEV1/FVC) less than 70% and no previous history of asthma or current asthma medication use. Thus, while participants overlapped between the asthma and chronic bronchitis subgroups, the asthma and COPD subgroups were mutually exclusive. For this analysis, participants were defined as healthy if they did not meet the criteria for inclusion for asthma, chronic bronchitis, or COPD and if they were not present with bronchial hyper-responsiveness at the baseline survey; 14 of the 116 participants in the healthy subgroup were current smokers.
Definition of doctor visit for respiratory symptoms
Doctor visits for respiratory symptoms were divided into two subcategories: lower respiratory symptoms (wheezing or tightness of chest ortrouble breathing orcough or phlegm during the day or the preceding night), and upper respiratory symptoms (sore throat or hoarseness or runny nose during the day or the preceding night and no lower respiratory symptoms).
Air pollution exposure assessment
Additional details on exposure measurements are provided in Monn et al. [14]. NO2 and TSP were monitored at fixed sites by local authorities in the eight SAPALDIA regions, and 24-hour means of NO2 (µg/m3) and half-hourly means of TSP (µg/m3) were used in this analysis. Particulate matter of 2.5 nor 10 micrometers in diameter (PM2.5and PM10, respectively) were not monitored on a daily basis at the time of the diary study, but a previous exposure assessment study demonstrated a high correlation between weekly averages of TSP and PM10 in the SAPALDIA regions [15]. In the same study, a high correlation was also observed between PM10 and NO2 in the urban regions. At the time of the diary study, emission sources for NO2 in Switzerland were predominately automobile traffic [15, 16].
Meteorological parameters including 24-hour means of temperature (T), relative humidity (RH), and atmospheric pressure (AP), were also collected for each SAPALDIA region. For chronological gaps of ≤2 consecutive days in the diary period with missing data for NO2, TSP, T, RH, or AP, linear interpolation between the day before and the day after was used to impute the missing data. Of the 3,276 person-days of observation with complete information specific to the NO2 analysis, 465 person-days consisted of imputed pollutant or meteorological data; 356 of the 3,122 person-days specific to the TSP analysis consisted of imputed pollutant or meteorological data.
Statistical analysis
Conditional logistic regression (CLR), performed with the PROC PHREG procedure in SAS V 9.2 (SAS Institute, Cary, NC, 2008), was used to estimate odds ratios (OR) and 95% confidence intervals for doctor visits for respiratory symptoms (combination of upper and lower respiratory symptoms) as a function of NO2 or TSP concentration (per 10 µg/m3) in a polynomial distributed lag model. The polynomial distributed lag model was derived from NO2 and TSP concentrations on the respective case or control-day of observation and the previous 13 days to account for substantial correlation between air pollution concentrations on days close together [17, 18], including terms up to the 5th degree order constrained in such a way that the resulting function had linear tails between lags 0 and 1 and between lags 12 and 13. Longer lag structures up to two weeks were also developed in this analysis to enhance stability of the distributed lag estimates, and because the previous literature demonstrates that lags beyond one week have some influence on respiratory mortality and morbidity [19, 20].
All models were adjusted for time-varying covariates including quadratic polynomial distributed lag function of T, RH, AP, T2, RH2,and RH*T on the respective day and the 6 preceding days (i.e., lag 0 to 6) up to ≤2 degrees for each term, and average T, RH, and AP from lag 7 to lag 13 days. Finally, there was additional adjustment for weekly average influenza incidence at the regional level, which was provided by the Federal Office of Public Health. All models were stratified by gender and smoking status (current smoker, former or never smoker); there was insufficient power to distinguish the effect of exposure between former and never smokers, particularly in the COPD subgroup, so we chose to combine former and never smokers. Doctor visits were also limited to lower respiratory symptoms in a secondary analysis.
For each subgroup, the average percent change in doctor visits for respiratory symptoms was estimated over 1 or 2 weeks following a 10 µg/m3 increase in NO2 and TSP concentration on a given day by computing the area under the curve (AUC), which was derived from summing logits lag 0 to 6 or lag 0 to 13 days from the CLR models and then exponentiating their sum. The difference in AUC between mutually exclusive subgroups was estimated to evaluate whether time patterns were distinguishable between the subgroups.
Results
Different patterns of characteristics emerged between the subgroups as shown in table 1. Participants with COPD were more likely to be male, considerably older, report more than one doctor visit, and be a current smoker compared with participants with asthma and healthy participants. The majority of doctor visits were for lower rather than upper respiratory symptoms, but healthy participants had the highest proportion of doctor visits for upper respiratory symptoms.
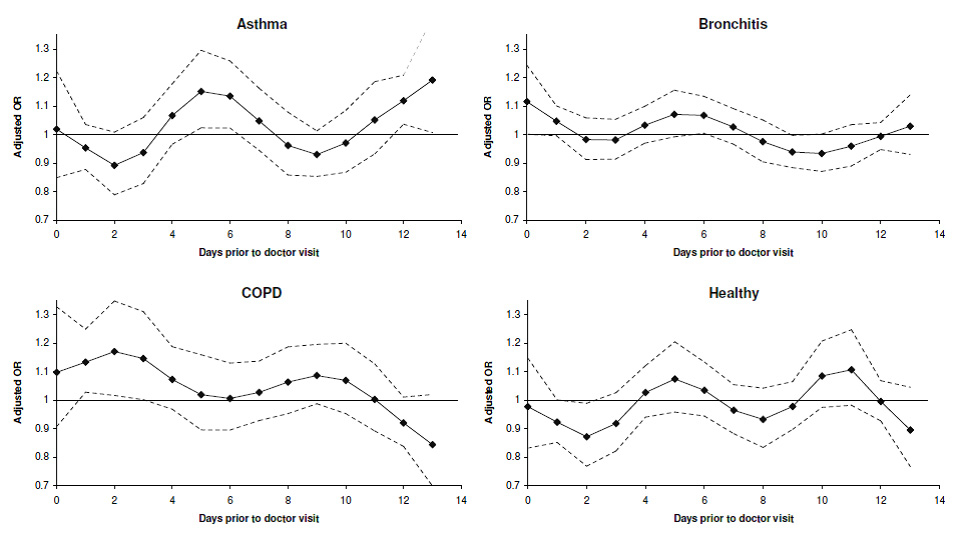
Figure 1
Adjusted OR’s* for doctor’s visit for respiratory symptoms per 10 µg/m3 increase in NO2.
* As estimated in separate conditional logistic regression models in the asthma, chronic bronchitis, COPD, and healthy subgroups, and adjusted for flu prevalence, polynomial distributed lags of T, RH, AP, T2, RH2, and T*RH from lag 0–6 days at up to 2 degrees of freedom, and average T, RH, AP, and T2 from lag 7–13 days.
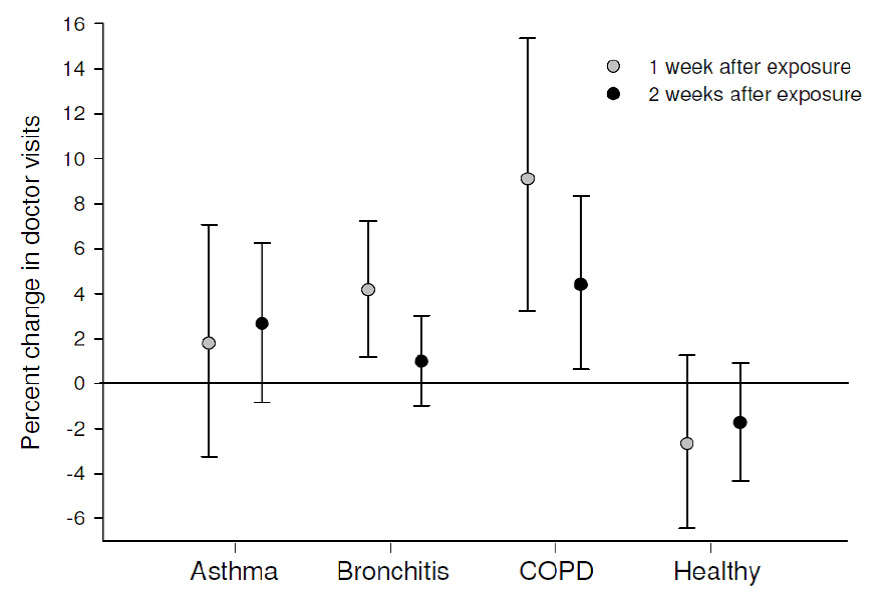
Figure 2
Average percent change* in number of doctor visits following a 10 µg/m3 increase in NO2 concentration.
* For each subgroup, areas under the curve were estimated from adjusted conditional logistic regression models to approximate the average percent change in number of doctor visits over 1 and 2 week periods following a 10 µg/m3 increase in exposure to NO2 concentration on a given day.
Comparison of characteristics at the baseline SAPALDIA survey between participants who reported or did not report doctor visits was also evaluated within the asthma and COPD subgroups (supplementary file table 1). Among participants with COPD, the distributions of age, current smoking status, symptoms consistent with chronic bronchitis, and percent predicted FEV1 were not considerably different between those who reported and did not report doctor visits. Asthmatics who reported doctor visits had significantly lower percent predicted forced expiratory volume in one second (FEV1) and a significantly higher prevalence of self-reported asthma medication use.
NO2 and doctor visits
The mean NO2 concentration observed on case and control-days, and the differences between them from the same risk set are summarised in table 2. On average, higher NO2concentrations were observed on case-days relative to control-days (i.e., at an exposure lag of 0 days). From an exposure lag of 1 day onward, the difference in NO2 concentration, relative to control-days, continued to rise and peaked at an exposure lag of 4 days, before trending downward into negative territory by a lag of 8 days. A high correlation was observed between NO2 and TSP concentrations (Pearson correlation r2 = 0.72) at exposure lag of 0 days.
The maximum OR for a doctor visit related to respiratory symptoms per 10 µg/m3 increase in NO2 in all participants occurred at an exposure lag of 4 days (OR: 1.038, 95%CI: 0.999–1.077), indicating a small increase in doctor visits. A bimodal lag distribution of peak effects of NO2 occurred in all subgroups, but the timing and strength of the peak effects varied by condition (fig. 1, table 3). In the asthma subgroup, the peak effects occurred at exposure lags of 5 and 13 days, but at shorter lags for participants with chronic bronchitis and COPD, all of which were statistically significant (p <0.05). In the healthy subgroup, the peak effects occurred at exposure lags of 5 and 10 days. Statistically significant inverse associations were also observed in the healthy and chronic bronchitis subgroups at lags of 2 and 9 days, respectively. Exposure lag patterns were broadly similar when doctor visits were limited to lower respiratory symptoms (data not shown).
Transformation of the AUC’s from the CLR models into average percent changes in doctor visits following an increase NO2 exposure is illustrated in figure 2. The largest increase in doctor visits was observed in the COPD subgroup; a 10 µg/m3 increase in NO2 concentration on a given day was associated with a 9.1% increase (95%CI: 3.2–15.4%) in doctor visits for respiratory symptoms on average over the first week following exposure. The increase in doctor visits for the COPD subgroup was reduced to 4.4% over two weeks following exposure, but remained statistically significant (95%CI: 0.6–8.3%). Average increases in doctor visits in both time periods were also observed in the asthma and chronic bronchitis subgroups, but were only statistically significant for those with chronic bronchitis over one week following an increase in exposure (4.2%, 95%CI: 1.2–7.2%). Average decreases in doctor visits were observed in the healthy subgroup for both time periods, but these changes were not statistically significant. The differences in average change in doctor visits were statistically significant in both time periods between the COPD and healthy subgroups, and over the first week between the COPD and asthma subgroups.
The peak effects of NO2 occurring with shorter exposure lags in the COPD subgroup, as shown in figures 1 and 2, were largely observed in current smokers (supplementary file table 2). There was little difference in effect lag patterns observed between current and non-smokers with chronic bronchitis. For participants with asthma, the peak effects of NO2 in both groups occurred at exposure lags of approximately 5–6 days and 13 days.
Differences in exposure lag patterns by gender also varied between subgroups (supplementary file table 3). In the COPD subgroup, the peak effects of NO2 occurred at exposure lags between 0 and 3 days in females and between 2 and 4 days in males. For the chronic bronchitis subgroup, elevated ORs were observed mainly in males at exposure lags between 0 and 1 days and between 4 and 6 days. Exposure lag patterns were similar between males and females with asthma.
TSP and doctor visits
The results for TSP and doctor visits (see supplementary file) were broadly similar to those observed for NO2. The adjusted OR for doctor visits in all subjects was highest at an exposure lag of 4 days (OR: 1.038, 95%CI: 1.010–1.065). In comparison with the asthma and healthy subgroups, the peak effect of TSP occurred at a shorter exposure lag in the COPD subgroup (supplementary file fig. 1A–1D, table 5), and the effect was largely apparent in smokers and females of this subgroup (supplementary file tables 6 and 7).
|
Table 1: Characteristics of participants who reported doctor visits for respiratory symptoms in the SAPALDIA diary study. |
| |
Participants with at least one visit to the doctor
|
|
Characteristics
|
Asthma
|
Bronchitis
|
COPD
|
Healthy
|
|
Number of subjects
|
78 |
189 |
54 |
116 |
|
|
n (%)* |
n (%) |
n (%) |
n (%) |
|
Sex
|
|
|
|
|
| Male |
31 (39.7) |
81 (42.9) |
29 (53.7) |
34 (29.3) |
| Female |
47 (60.3) |
108 (57.1) |
25 (46.3) |
82 (70.7) |
|
Age
|
|
|
|
|
| <35 |
17 (21.8) |
39 (20.6) |
7 (13.0) |
33 (28.5) |
| 35–45 |
24 (30.8) |
50 (26.5) |
10 (18.5) |
41 (35.3) |
| >45 |
37 (47.4) |
100 (52.9) |
37 (68.5) |
42 (36.2) |
| mean (SD) |
43.6 (10.1) |
44.3 (9.9) |
48.2 (9.9) |
41.5 (10.2) |
|
Smoking status
|
|
|
|
|
| Current smoker |
14 (17.3) |
80 (42.3) |
24 (46.0) |
14 (10.4) |
| Former smoker |
24 (30.8) |
37 (19.6) |
13 (24.1) |
29 (25.0) |
| Never smoker |
40 (51.3) |
72 (38.1) |
17 (31.5) |
73 (63.0) |
|
Medication**
|
|
|
|
|
| Current use of asthma medication |
35 (44.9) |
22 (11.6) |
|
|
| Use of inhalation steroids in last 12 months |
18 (23.1) |
12 (6.4) |
|
|
|
Lung function
|
|
|
|
|
| Percent predicted FEV1, mean (SD) |
88.9 (21.9) |
100.2 (20.3) |
91.9 (16.2) |
112.1 (13.7) |
| FEV1/FVC, %, mean (SD) |
71.7 (11.8) |
75.5 (10.3) |
63.4 (6.2) |
81.3 (5.6) |
| PEF***, %, mean (SD) |
6.77 (2.33) |
7.04 (2.46) |
6.47 (2.55) |
7.63 (2.40) |
|
Visits to the doctor
|
|
|
|
|
| 1 |
43 (55.1) |
95 (50.3) |
24 (44.4) |
65 (56.0) |
| >1 |
35 (44.9) |
94 (49.7) |
30 (55.6) |
51 (44.0) |
| |
Visits to the doctor
|
|
Type
|
Asthma
|
Bronchitis
|
COPD
|
Healthy
|
| All visits |
201 |
478 |
166 |
231 |
| Visits for upper respiratory symptoms |
20 |
63 |
42 |
86 |
| Visits for lower respiratory symptoms |
181 |
415 |
124 |
145 |
| * Summarised in n (%) unless noted otherwise.
** Self-reported medication use ascertained from SAPALDIA 1 survey (1991).
*** Peak expiratory flow variability expressed as amplitude as a percent of mean. |
|
Table 2: Distribution of 24-hr mean concentrations of NO2 (µg/m3) for case and control-days from all participants (n = 457). |
|
Lag
|
Case/Control-days*
|
Mean
|
SD
|
10th
|
25th
|
50th
|
75th
|
90th
|
|
Case |
34.4 |
22.2 |
8.5 |
15.4 |
31.1 |
49.7 |
63.3 |
| Control |
33.4 |
20.1 |
8.4 |
15.8 |
31.8 |
48.5 |
59.1 |
| Difference |
0.9 |
13.9 |
–14.2 |
–5.6 |
0.5 |
7.2 |
17.1 |
| 1 |
Case |
33.0 |
22.3 |
7.9 |
14.8 |
29.3 |
47.3 |
62.2 |
| Control |
32.4 |
19.8 |
8.1 |
14.7 |
30.0 |
46.3 |
58.3 |
| Difference |
0.6 |
14 |
–14.6 |
–6.1 |
0.6 |
7.2 |
17 |
| 2 |
Case |
32.8 |
22.1 |
7.5 |
14.1 |
30.1 |
46.8 |
63.4 |
| Control |
32.2 |
19.7 |
7.6 |
14.7 |
30.4 |
46.4 |
57.3 |
| Difference |
0.7 |
13.9 |
–14.2 |
–5.4 |
0.6 |
7.6 |
17.1 |
| 3 |
Case |
33.3 |
22.0 |
8.2 |
15.4 |
30.3 |
47.1 |
62.3 |
| Control |
32.7 |
19.5 |
7.9 |
15.2 |
31.8 |
46.9 |
58.2 |
| Difference |
0.8 |
13.5 |
–14.9 |
–5.5 |
0.4 |
7.2 |
15.5 |
| 4 |
Case |
33.6 |
22.5 |
8.2 |
15.4 |
31.1 |
47.2 |
61.8 |
| Control |
32.7 |
19.3 |
8.3 |
15.9 |
32.5 |
46.1 |
59.3 |
| Difference |
1.0 |
13.6 |
–14.7 |
–4.9 |
0.8 |
6.7 |
16.6 |
| 5 |
Case |
33.7 |
22.5 |
7.9 |
15.3 |
30.7 |
47.1 |
61.9 |
| Control |
33.0 |
19.8 |
8.2 |
15.1 |
31.9 |
47.3 |
59.3 |
| Difference |
0.7 |
13.6 |
–14.1 |
–5.5 |
0.2 |
6.8 |
16.3 |
| 6 |
Case |
34.5 |
23.1 |
8.1 |
15.3 |
31.6 |
48.4 |
63.0 |
| Control |
34.0 |
20.3 |
8.4 |
16.0 |
33.8 |
48.8 |
60.6 |
| Difference |
0.6 |
13.5 |
–14.5 |
–6.0 |
-0.2 |
6.8 |
15.4 |
| 7 |
Case |
34.1 |
22.4 |
8.3 |
15.2 |
31.5 |
47.8 |
62.1 |
| Control |
34.0 |
20.2 |
8.5 |
16.3 |
33.0 |
49.0 |
60.1 |
| Difference |
0.0 |
13.3 |
–15.0 |
–6.3 |
–0.3 |
6.6 |
15.8 |
| 8 |
Case |
32.5 |
21.7 |
8.0 |
14.4 |
30.0 |
46.2 |
59.9 |
| Control |
32.7 |
19.9 |
7.9 |
15.1 |
31.0 |
47.6 |
60.3 |
| Difference |
–0.2 |
14.1 |
–16.2 |
–6.8 |
–0.1 |
6.2 |
15.5 |
| 9 |
Case |
32.3 |
21.6 |
7.4 |
14.5 |
29.2 |
45.8 |
59.4 |
| Control |
32.7 |
19.7 |
7.6 |
15.1 |
32.1 |
47.6 |
57.2 |
| Difference |
–0.3 |
14.2 |
–16.3 |
–6.5 |
–0.2 |
6.1 |
15.1 |
| 10 |
Case |
33.0 |
21.7 |
7.8 |
14.7 |
30.3 |
47.6 |
62.0 |
| Control |
33.2 |
19.8 |
8.2 |
15.9 |
32.5 |
47.1 |
58.8 |
| Difference |
–0.3 |
13.9 |
–16.7 |
–6.3 |
0.0 |
6.0 |
16.0 |
| 11 |
Case |
33.0 |
21.2 |
8.2 |
15.1 |
31.3 |
46.9 |
60.8 |
| Control |
33.4 |
20.2 |
8.5 |
15.9 |
33.2 |
47.2 |
59.2 |
| Difference |
–0.5 |
13.6 |
–17.2 |
–6.6 |
–0.3 |
6.2 |
15.8 |
| 12 |
Case |
33.0 |
21.3 |
8.0 |
14.7 |
31.2 |
47.1 |
59.9 |
| Control |
33.6 |
20.4 |
8.1 |
15.7 |
33.2 |
47.4 |
60.7 |
| Difference |
–0.5 |
13.1 |
–16.3 |
–6.6 |
–0.3 |
5.6 |
14.6 |
| 13 |
Case |
34.3 |
22.1 |
8.0 |
15.9 |
32.1 |
49.9 |
62.2 |
| Control |
34.3 |
20.5 |
8.5 |
16.1 |
34.0 |
48.5 |
60.7 |
| Difference |
0.0 |
13.0 |
–15.9 |
–6.9 |
–0.2 |
6.1 |
16.0 |
| * There were 914 case-days and 2,362 control days with complete information on NO2 concentration and other covariates. The difference in NO2 concentration was estimated from concentration measured on case-day minus the mean concentration measured on control-days occurring in the diary period. |
|
Table 3: Adjusted OR's* for doctor’s visit for respiratory symptoms per 10 µg/m3 increase in NO2. |
| |
Asthma
|
Bronchitis
|
COPD
|
Healthy
|
|
N doctor visits
|
167
|
407
|
150
|
207
|
| |
OR** |
95%CI** |
OR |
95%CI |
OR |
95%CI |
OR |
95%CI |
|
Lag 0
|
1.019 |
0.849 |
1.223 |
1.116
|
1.001
|
1.244
|
1.098 |
0.908 |
1.328 |
0.978 |
0.832 |
1.148 |
|
Lag 1
|
0.953 |
0.878 |
1.036 |
1.047 |
0.996 |
1.101 |
1.134
|
1.029
|
1.250
|
0.924 |
0.852 |
1.001 |
|
Lag 2
|
0.892 |
0.789 |
1.009 |
0.983 |
0.913 |
1.059 |
1.171
|
1.017
|
1.348
|
0.873
|
0.769
|
0.990
|
|
Lag 3
|
0.937 |
0.828 |
1.060 |
0.981 |
0.914 |
1.053 |
1.146
|
1.002
|
1.311
|
0.919 |
0.822 |
1.027 |
|
Lag 4
|
1.067 |
0.966 |
1.178 |
1.033 |
0.970 |
1.099 |
1.073 |
0.969 |
1.188 |
1.027 |
0.941 |
1.122 |
|
Lag 5
|
1.152
|
1.024
|
1.295
|
1.071 |
0.992 |
1.156 |
1.020 |
0.896 |
1.160 |
1.075 |
0.959 |
1.205 |
|
Lag 6
|
1.135
|
1.023
|
1.258
|
1.067
|
1.004
|
1.134
|
1.006 |
0.896 |
1.131 |
1.035 |
0.945 |
1.134 |
|
Lag 7
|
1.048 |
0.945 |
1.162 |
1.027 |
0.967 |
1.091 |
1.028 |
0.929 |
1.138 |
0.965 |
0.883 |
1.055 |
|
Lag 8
|
0.962 |
0.858 |
1.079 |
0.975 |
0.905 |
1.051 |
1.064 |
0.954 |
1.188 |
0.933 |
0.835 |
1.043 |
|
Lag 9
|
0.930 |
0.853 |
1.013 |
0.939
|
0.884
|
0.997
|
1.087 |
0.988 |
1.196 |
0.978 |
0.898 |
1.066 |
|
Lag 10
|
0.970 |
0.868 |
1.085 |
0.934 |
0.871 |
1.002 |
1.070 |
0.953 |
1.200 |
1.085 |
0.975 |
1.208 |
|
Lag 11
|
1.051 |
0.932 |
1.185 |
0.959 |
0.889 |
1.035 |
1.004 |
0.893 |
1.128 |
1.107 |
0.983 |
1.248 |
|
Lag 12
|
1.119
|
1.036
|
1.208
|
0.994 |
0.948 |
1.042 |
0.921 |
0.838 |
1.012 |
0.996 |
0.928 |
1.069 |
|
Lag 13
|
1.191
|
1.007
|
1.409
|
1.029 |
0.930 |
1.139 |
0.845 |
0.700 |
1.021 |
0.896 |
0.768 |
1.046 |
| * As estimated in conditional logistic regression at different lags and adjusted for flu prevalence, polynomial distributed lags of T, RH, AP, T2, RH2, and T*RH from lag 0–6 days up to 2 degrees of freedom, and average T, RH, AP, and T2 from lag 7–13 days.
** Bold font indicates p-values <0.05. |
Discussion
We observed positive associations between ambient exposures to NO2 and visits to the doctor for respiratory symptoms on days following exposure, but the timing and magnitude in the effect of NO2varied by the underlying respiratory condition. Participants in the COPD subgroup were more vulnerable during the first week following an increase in exposure to NO2 compared with those in the asthma and healthy subgroups. The results for TSP were broadly similar to those observed for NO2.
Few studies have examined effects of ambient air pollutants on respiratory morbidity outcomes in adults in primary care rather than emergency care settings. Previous studies of air pollution and general practice consultations for asthma or lower respiratory tract diseases in London [5], and doctors’ house calls for upper or lower respiratory tract diseases in the greater Paris area [4] observed no significant associations with NO2. The former study did not consider exposure lags more than 3 days, but the latter study evaluated up to 15 days and also found that the effects of PM10 on house calls for lower respiratory diseases persisted until 4 days after exposure followed by a steady decrease.
The studies cited in the previous paragraph did not evaluate the susceptibility to respiratory health effects of air pollutants by pre-existing chronic respiratory disease. There is evidence from both epidemiologic and laboratory studies to suggest that adults with asthma and COPD are particularly sensitive to air pollutants using a wide range of outcomes that include aggravation of respiratory symptoms, emergency room visits, and hospital admissions [1, 2, 21, 22]. Evaluation of susceptibility factors may also help redefine exposure limits. The findings from our study indicate that the number of doctor visits for respiratory symptoms among individuals with COPD would increase by 9.1% over the course of one week following an increase of 10 µg/m3 of exposure to NO2. COPD is a common disease in most countries, with a reported prevalence in Europe and United States falling between 4 and 10% [23]. Thus, the present findings re-emphasise that air quality improvements would represent considerable medical and other societal savings, and should be included in general strategies for disease prevention [24].
The variation in lag distribution of effects between the disease subgroups is also of particular interest. The observed findings suggest that the time to doctor visit following increase in exposure to NO2 is more immediate for individuals who have at least mild COPD than for those with asthma. Both diseases are characterised by chronic inflammatory processes, but the general features are distinct with different pathophysiology. Airflow obstruction is poorly reversible for COPD in comparison with asthma, whose exacerbations can be managed more effectively with the use of bronchodilators and inhaled steroids. Thus, the variation in lag distribution of effects may reflect a comparison of disease severity between COPD and asthma. However, there may be alternative explanations for the observed findings. First, differences in lag time and associations with doctor visits observed between the subgroups may be attributable to differences in smoking and gender. Lagged effect patterns of NO2 exposure were similar for asthma and COPD when the analysis was limited to former and never smokers, but the effects were more immediate and higher for COPD than asthma in current smokers. Although it is known that there are gender differences in treatment seeking behaviour, the lagged effects of NO2 exposure on doctor visits were more immediate for COPD than for asthma in both males and females. Secondly, peak effects may have occurred at shorter exposure lags for participants with COPD and chronic bronchitis because they are less likely to take medication compared with participants with asthma. It is possible that the use of bronchodilators or inhaled steroids in asthma exacerbations may delay (or postpone) the decision to visit the doctor. However, effects of NO2 exposure did not differ considerably between asthmatics who reported use of asthma medication in the 1991 baseline survey and those who did not (data not shown). Molecular and genetic epidemiology may help to elucidate the biological mechanisms of susceptibility to respiratory health effects in air pollution, which has important links with systemic inflammation and oxidative stress, in individuals with COPD and asthma [25].
Furthermore, we observed a bimodal lag distribution of peak effects of NO2 and TSP in all subgroups, although there was variation in timing and magnitude by condition. For the COPD subgroup, the development of respiratory symptoms leading to a doctor visit on the second or third day after exposure to NO2 may reflect a more rapid mechanism of airway irritation in individuals with more severe obstruction, or with presence of other susceptibility factors including older age and co-morbidities. The second wave of doctor visits on 9–10 days following exposure may be due to delayed or slower effects of a similar mechanism in milder cases of obstruction but might also be an artefact. The presence of such a second peak would need to be confirmed with other data.
This study has multiple strengths and limitations that are inherent to its design. The subjects of the SAPALDIA diary study participated one to two years earlier in the baseline survey of SAPALDIA, which included information on spirometry and methacholine challenge testing, and respiratory symptoms. Many of the diary study participants were selected on the basis of presenting with respiratory symptoms or poor lung function at the baseline survey, which enabled us to make comparisons between subgroups [11, 12]. However, misclassification of subgroup is a possibility, particularly for COPD. While the prevalence of COPD in the younger age demographic of the general population is rare, 9 of the 54 participants (16.7%) in the COPD subgroup were less than 40 years of age, although the higher prevalence may reflect the selection of those who reported doctor visits. Bronchodilator tests were also not performed in the SAPALDIA baseline survey, so it was not possible to adhere to the more strict definition of COPD. Instead, validated questions for history of physician diagnosed asthma, current asthma, and asthma medication use in combination with lung function testing were used to minimise the inclusion of participants with potential asthma in the COPD subgroup. Furthermore, lag structures were similar between asthmatics who reported or didn’t report asthma medication use in the 1991 baseline survey (data not shown); if unrecognised and untreated asthmatics were excluded from the COPD subgroup, the lagged effect patterns between the COPD and asthma subgroups would be likely to differ even more. Finally, to ensure accurate classification of healthy participants, normal bronchial reactivity tests were required in addition to absence of asthma, bronchitis symptoms, and airflow obstruction. The distinct patterns of time-related effects of NO2 effects observed between the asthma, COPD, and healthy subgroups suggest that misclassification is likely to be minimal.
The case-crossover analysis, in which the same participant was both a case and a control, prevented confounding by gender, age, smoking status and other individual factors that do not vary within time strata. However, there may be unmeasured confounding by time-varying factors, including daily medication use, which was not available in this analysis. Moderate prevalence of asthma medication or inhalation steroids, according to data collected at the baseline survey of SAPALDIA, was only observed in the asthma subgroup. As described in the previous paragraph, lag structures were also similar between treated and untreated participants in the asthma subgroup. Thus, unmeasured confounding by daily medication use in asthmatic participants may be rather minimal.
While referent time periods are individually matched to case time periods in case-crossover studies, there are several different strategies to select referent periods, and the risk estimates may vary by selection strategy [26, 27]. Based on review of this literature, we chose our referent periods using a time-stratified design, in which control and case-days were matched by weekday within the diary period, thus providing sufficient control for time trend biases including seasonal trends [27].
The observed associations between daily levels of NO2 and TSP and reported doctor visits were statistically significant at specific lags, but were mostly of smaller magnitude with confidence intervals indicating wide variation. The CLR models were adjusted for time-varying factors including weekly flu prevalence at the regional level and complex combinations of meteorological variables. Effect estimates of similar magnitude were also observed in CLR models that were unadjusted for meteorological covariates (data not shown). Furthermore, these models were stratified by presence of chronic respiratory disease, gender, and smoking to account for the hypothesised heterogeneity of effects between subgroups.
The assignment of daily exposure was also based on fixed site monitors that have rather limited precision to indicate exposure of a particular participant on a given day, so there is potential for exposure misclassification of NO2 and TSP. However, relevant to TSP, the spatial homogeneity of particulate concentrations was demonstrated to be quite high in one of the regions for this study [28]. Finally, other potential causal components, including ultrafine particles, were not addressed and may explain the observed effects in this study. Ambient NO2 was and still is a proxy for combustion, and nearly 20 years ago, it was strongly related to traffic; while ultrafine particle data was not collected in this study, we may consider NO2 a proxy of traffic related PM.
Conclusions
In summary, an increase in exposure to NO2 and TSP was associated with a visit to the doctor for a few days following exposure. Respiratory problems leading to a doctor visit may have a faster dynamic in individuals with underlying COPD.
Appendix: Supplementary file
|
Supplementary file: Table 1 Characteristics* of subjects with asthma and COPD who report or did not doctor visits for respiratory symptoms in the SAPALDIA diary study. |
|
|
Asthma
|
COPD
|
|
|
Did not report doctor visit |
Reported doctor visit |
Did not report doctor visit |
Reported doctor visit |
|
Number of subjects
|
251 |
78 |
296 |
54 |
| |
n (%)** |
n (%) |
n (%) |
n (%) |
|
Sex
|
|
|
|
|
| Male |
124 (49.4) |
31 (39.7) |
192 (64.9) |
29 (53.7) |
| Female |
127 (50.6) |
47 (60.3) |
104 (35.1) |
25 (46.3) |
| Age |
|
|
|
|
| <35 |
72 (28.7) |
17 (21.8) |
19 (6.4) |
7 (13.0) |
| 35–45 |
62 (24.7) |
24 (30.8) |
77 (26.0) |
10 (18.5) |
| >45 |
117 (46.6) |
37 (47.4) |
200 (67.6) |
37 (68.5) |
| mean (SD) |
42.3 (11.7) |
43.6 (10.1) |
49.0 (9.0) |
48.2 (9.9) |
|
Bronchitis symptoms
|
|
|
|
|
| Yes |
92 (36.7) |
40 (51.3) |
107 (36.2) |
23 (42.6) |
| No |
159 (63.4) |
38 (48.7) |
189 (63.9) |
31 (57.4) |
|
Smoking status
|
|
|
|
|
| Current smoker |
60 (23.9) |
14 (17.3) |
104 (35.1) |
24 (46.0) |
| Former or never smoker |
191 (76.1) |
64 (82.7) |
192 (64.9) |
30 (54.0) |
|
Current asthma medication use
|
|
|
|
|
| Yes |
72 (28.7) |
35 (44.9) |
|
|
| No |
179 (71.3) |
43 (55.1) |
|
|
|
Lung function
|
|
|
|
|
| Percent predicted FEV1, mean (SD) |
97.8 (18.3) |
88.7 (21.9) |
95.2 (16.1) |
91.9 (16.2) |
| * Characteristics summarised from the baseline survey of SAPALDIA (1991)
** Expressed as n (%) unless otherwise noted |
|
Supplementary file: Table 2 Adjusted OR's* for doctor’s visit for respiratory symptoms per 10 µg/m3 increase in NO2 after stratification by smoking status. |
|
Current smokers
|
| |
Asthma
|
Bronchitis
|
COPD
|
Healthy
|
|
N doctor visits
|
44
|
196
|
75
|
25
|
| |
OR** |
95%CI** |
OR |
95%CI |
OR |
95%CI |
OR |
95%CI |
|
Lag 0
|
1.207 |
0.743 |
1.962 |
1.110 |
0.943 |
1.307 |
1.284 |
0.881 |
1.872 |
N/A |
|
Lag 1
|
1.003 |
0.828 |
1.214 |
1.066 |
0.985 |
1.154 |
1.371
|
1.064
|
1.767
|
|
Lag 2
|
0.833 |
0.635 |
1.093 |
1.024 |
0.909 |
1.154 |
1.464
|
1.064
|
2.013
|
|
Lag 3
|
0.834 |
0.615 |
1.130 |
1.026 |
0.917 |
1.148 |
1.248 |
0.947 |
1.646 |
|
Lag 4
|
1.010 |
0.716 |
1.424 |
1.057 |
0.957 |
1.167 |
0.964 |
0.776 |
1.197 |
|
Lag 5
|
1.218 |
0.827 |
1.793 |
1.065 |
0.943 |
1.203 |
0.892 |
0.689 |
1.155 |
|
Lag 6
|
1.321 |
0.978 |
1.784 |
1.038 |
0.943 |
1.143 |
1.022 |
0.806 |
1.295 |
|
Lag 7
|
1.258 |
0.930 |
1.701 |
0.991 |
0.906 |
1.085 |
1.283 |
0.993 |
1.658 |
|
Lag 8
|
1.086 |
0.766 |
1.539 |
0.951 |
0.848 |
1.067 |
1.482
|
1.101
|
1.995
|
|
Lag 9
|
0.914 |
0.727 |
1.149 |
0.938 |
0.851 |
1.033 |
1.379
|
1.082
|
1.759
|
|
Lag 10
|
0.824 |
0.614 |
1.105 |
0.956 |
0.859 |
1.065 |
1.040 |
0.811 |
1.334 |
|
Lag 11
|
0.877 |
0.607 |
1.267 |
0.987 |
0.881 |
1.105 |
0.810 |
0.610 |
1.076 |
|
Lag 12
|
1.046 |
0.882 |
1.240 |
1.006 |
0.934 |
1.083 |
0.753
|
0.583
|
0.971
|
|
Lag 13
|
1.247 |
0.906 |
1.717 |
1.025 |
0.880 |
1.194 |
0.699 |
0.460 |
1.062 |
|
Former or never smokers
|
| |
Asthma
|
Bronchitis
|
COPD
|
Healthy
|
|
N doctor visits
|
123
|
210
|
75
|
182
|
| |
OR |
95%CI |
OR |
95%CI |
OR |
95%CI |
OR |
95%CI |
|
Lag 0
|
1.060 |
0.846 |
1.327 |
1.146 |
0.975 |
1.346 |
1.219 |
0.865 |
1.717 |
1.005 |
0.836 |
1.209 |
|
Lag 1
|
0.954 |
0.855 |
1.064 |
1.024 |
0.949 |
1.106 |
1.012 |
0.861 |
1.190 |
0.937 |
0.855 |
1.026 |
|
Lag 2
|
0.859 |
0.730 |
1.011 |
0.916 |
0.821 |
1.021 |
0.840 |
0.642 |
1.099 |
0.873 |
0.758 |
1.004 |
|
Lag 3
|
0.901 |
0.768 |
1.056 |
0.917 |
0.827 |
1.017 |
0.855 |
0.659 |
1.109 |
0.920 |
0.812 |
1.043 |
|
Lag 4
|
1.055 |
0.939 |
1.185 |
1.017 |
0.932 |
1.109 |
1.011 |
0.852 |
1.199 |
1.046 |
0.949 |
1.154 |
|
Lag 5
|
1.159
|
1.009
|
1.333
|
1.106 |
0.993 |
1.232 |
1.112 |
0.898 |
1.378 |
1.115 |
0.980 |
1.269 |
|
Lag 6
|
1.142 |
0.999 |
1.304 |
1.124
|
1.027
|
1.229
|
1.081 |
0.893 |
1.309 |
1.087 |
0.976 |
1.210 |
|
Lag 7
|
1.044 |
0.906 |
1.202 |
1.070 |
0.980 |
1.169 |
0.979 |
0.832 |
1.151 |
1.015 |
0.917 |
1.124 |
|
Lag 8
|
0.955 |
0.822 |
1.109 |
0.989 |
0.891 |
1.098 |
0.908 |
0.758 |
1.088 |
0.974 |
0.861 |
1.102 |
|
Lag 9
|
0.937 |
0.841 |
1.044 |
0.928 |
0.856 |
1.006 |
0.930 |
0.797 |
1.084 |
1.006 |
0.913 |
1.110 |
|
Lag 10
|
1.006 |
0.873 |
1.160 |
0.915 |
0.828 |
1.010 |
1.039 |
0.857 |
1.259 |
1.095 |
0.968 |
1.238 |
|
Lag 11
|
1.098 |
0.944 |
1.277 |
0.951 |
0.853 |
1.060 |
1.082 |
0.882 |
1.327 |
1.091 |
0.954 |
1.247 |
|
Lag 12
|
1.143
|
1.031
|
1.266
|
1.005 |
0.939 |
1.075 |
0.982 |
0.828 |
1.164 |
0.956 |
0.880 |
1.039 |
|
Lag 13
|
1.189 |
0.948 |
1.490 |
1.062 |
0.918 |
1.229 |
0.890 |
0.636 |
1.247 |
0.838 |
0.701 |
1.003 |
| * As estimated in conditional logistic regression per 10 µg/m3 increase in NO2 at different lags and adjusted for flu prevalence, polynomial distributed lags of T, RH, AP, T2, RH2, and T*RH from lag 0-6 days up to 2 degrees of freedom, and average T, RH, AP, and T2 from lag 7–13 days.
** Bold font indicates p-values <0.05. |
|
Supplementary file: Table 3
Adjusted OR's* for doctor’s visit for respiratory symptoms per 10 µg/m3 increase in NO2 after stratification by gender. |
|
Males
|
| |
Asthma
|
Bronchitis
|
COPD
|
Healthy
|
|
N doctor visits
|
81
|
168
|
93
|
59
|
| |
OR** |
95%CI** |
OR |
95%CI |
OR |
95%CI |
OR |
95%CI |
|
Lag 0
|
1.106 |
0.803 |
1.524 |
1.272
|
1.055
|
1.535
|
1.053 |
0.824 |
1.347 |
1.051 |
0.646 |
1.710 |
|
Lag 1
|
0.985 |
0.860 |
1.128 |
1.099
|
1.008
|
1.197
|
1.129 |
0.987 |
1.292 |
0.792 |
0.589 |
1.064 |
|
Lag 2
|
0.878 |
0.714 |
1.079 |
0.949 |
0.826 |
1.090 |
1.210
|
1.003
|
1.459
|
0.597
|
0.374
|
0.954
|
|
Lag 3
|
0.957 |
0.771 |
1.187 |
0.986 |
0.867 |
1.122 |
1.247
|
1.041
|
1.494
|
0.740 |
0.517 |
1.057 |
|
Lag 4
|
1.166 |
0.972 |
1.399 |
1.164
|
1.041
|
1.302
|
1.209
|
1.037
|
1.410
|
1.197 |
0.936 |
1.530 |
|
Lag 5
|
1.252
|
1.016
|
1.541
|
1.263
|
1.096
|
1.456
|
1.135 |
0.942 |
1.368 |
1.410 |
0.998 |
1.990 |
|
Lag 6
|
1.139 |
0.964 |
1.347 |
1.192
|
1.070
|
1.329
|
1.065 |
0.903 |
1.256 |
1.124 |
0.903 |
1.398 |
|
Lag 7
|
0.960 |
0.821 |
1.123 |
1.030 |
0.934 |
1.135 |
1.025 |
0.894 |
1.176 |
0.765
|
0.593
|
0.986
|
|
Lag 8
|
0.855 |
0.710 |
1.029 |
0.894 |
0.783 |
1.021 |
1.026 |
0.885 |
1.188 |
0.620
|
0.425
|
0.906
|
|
Lag 9
|
0.891 |
0.774 |
1.027 |
0.852
|
0.760
|
0.954
|
1.058 |
0.925 |
1.210 |
0.754
|
0.582
|
0.979
|
|
Lag 10
|
1.079 |
0.896 |
1.299 |
0.909 |
0.805 |
1.028 |
1.086 |
0.928 |
1.270 |
1.270 |
0.879 |
1.833 |
|
Lag 11
|
1.247
|
1.003
|
1.551
|
0.985 |
0.863 |
1.123 |
1.032 |
0.887 |
1.200 |
1.633
|
1.053
|
2.532
|
|
Lag 12
|
1.241
|
1.061
|
1.450
|
0.996 |
0.914 |
1.086 |
0.912 |
0.799 |
1.040 |
1.272 |
0.995 |
1.625 |
|
Lag 13
|
1.234 |
0.933 |
1.632 |
1.008 |
0.845 |
1.204 |
0.806 |
0.616 |
1.054 |
0.990 |
0.563 |
1.742 |
|
Females
|
| |
Asthma
|
Bronchitis
|
COPD
|
Healthy
|
|
N doctor visits
|
86
|
239
|
57
|
148
|
| |
OR |
95%CI |
OR |
95%CI |
OR |
95%CI |
OR |
95%CI |
|
Lag 0
|
0.913 |
0.699 |
1.191 |
1.038 |
0.894 |
1.206 |
2.330 |
0.989 |
5.486 |
0.966 |
0.795 |
1.172 |
|
Lag 1
|
0.902 |
0.788 |
1.032 |
1.021 |
0.952 |
1.096 |
1.958
|
1.215
|
3.156
|
0.933 |
0.845 |
1.031 |
|
Lag 2
|
0.891 |
0.738 |
1.075 |
1.005 |
0.911 |
1.108 |
1.646 |
0.947 |
2.864 |
0.902 |
0.775 |
1.049 |
|
Lag 3
|
0.957 |
0.797 |
1.149 |
0.986 |
0.896 |
1.086 |
1.307 |
0.814 |
2.098 |
0.935 |
0.819 |
1.068 |
|
Lag 4
|
1.091 |
0.941 |
1.264 |
0.977 |
0.899 |
1.061 |
1.051 |
0.806 |
1.370 |
1.018 |
0.916 |
1.130 |
|
Lag 5
|
1.191
|
1.002
|
1.415
|
0.982 |
0.890 |
1.083 |
0.948 |
0.638 |
1.408 |
1.071 |
0.932 |
1.231 |
|
Lag 6
|
1.198
|
1.023
|
1.403
|
0.995 |
0.917 |
1.080 |
0.970 |
0.689 |
1.366 |
1.069 |
0.954 |
1.199 |
|
Lag 7
|
1.122 |
0.949 |
1.326 |
1.004 |
0.923 |
1.091 |
1.074 |
0.801 |
1.441 |
1.034 |
0.929 |
1.150 |
|
Lag 8
|
1.018 |
0.851 |
1.217 |
0.998 |
0.904 |
1.101 |
1.194 |
0.823 |
1.734 |
1.002 |
0.878 |
1.143 |
|
Lag 9
|
0.941 |
0.826 |
1.072 |
0.974 |
0.901 |
1.053 |
1.242 |
0.917 |
1.682 |
1.000 |
0.899 |
1.112 |
|
Lag 10
|
0.928 |
0.775 |
1.110 |
0.945 |
0.859 |
1.040 |
1.168 |
0.832 |
1.639 |
1.024 |
0.902 |
1.161 |
|
Lag 11
|
0.994 |
0.825 |
1.198 |
0.942 |
0.852 |
1.043 |
1.028 |
0.694 |
1.522 |
1.012 |
0.881 |
1.164 |
|
Lag 12
|
1.107 |
0.995 |
1.231 |
0.970 |
0.909 |
1.036 |
0.907 |
0.687 |
1.197 |
0.947 |
0.869 |
1.033 |
|
Lag 13
|
1.233 |
0.952 |
1.598 |
0.999 |
0.868 |
1.149 |
0.800 |
0.466 |
1.374 |
0.886 |
0.742 |
1.059 |
| * As estimated in conditional logistic regression per 10 µg/m3 increase in NO2 at different lags and adjusted for flu prevalence, polynomial distributed lags of T, RH, AP, T2, RH2, and T*RH from lag 0-6 days up to 2 degrees of freedom, and average T, RH, AP, and T2 from lag 7–13 days.
** Bold font indicates p-values <0.05. |
|
Supplementary file: Table 4 Distribution of 24-mean concentrations of TSP (µg/m3) for case and control-days. |
|
Lag
|
Case/Control*
|
Mean
|
SD
|
10th
|
25th
|
50th
|
75th
|
90th
|
|
Case-days |
35.7 |
27.2 |
10.9 |
17.0 |
27.3 |
45.3 |
72.0 |
| Control-days |
33.9 |
21.5 |
12.7 |
17.7 |
12.7 |
44.5 |
62.0 |
| 1 |
Case-days |
34.3 |
26.0 |
10.0 |
15.6 |
26.4 |
45.0 |
70.0 |
| Control-days |
33.4 |
20.3 |
12.3 |
18.5 |
28.5 |
43.8 |
62.7 |
| 2 |
Case-days |
34.2 |
26.0 |
9.8 |
14.8 |
26.0 |
47.0 |
73.0 |
| Control-days |
32.7 |
20.0 |
12.3 |
17.5 |
28.0 |
42.4 |
63.0 |
| 3 |
Case-days |
34.9 |
26.7 |
10.4 |
15.8 |
25.9 |
48.0 |
72.0 |
| Control-days |
33.1 |
20.0 |
12.0 |
17.3 |
28.7 |
44.1 |
61.5 |
| 4 |
Case-days |
35.4 |
27.1 |
10.0 |
16.2 |
27.0 |
48.0 |
72.0 |
| Control-days |
33.1 |
20.1 |
12.0 |
17.3 |
28.5 |
44.3 |
62.7 |
| 5 |
Case-days |
35.7 |
27.6 |
9.8 |
15.6 |
28.0 |
46.2 |
74.1 |
| Control-days |
33.9 |
21.0 |
12.2 |
17.3 |
29.0 |
46.0 |
65.6 |
| 6 |
Case-days |
36.2 |
28.4 |
10.4 |
16.0 |
28.0 |
47.0 |
75.0 |
| Control-days |
34.7 |
21.2 |
12.5 |
18.7 |
30.4 |
45.0 |
63.8 |
| 7 |
Case-days |
35.3 |
28.1 |
10.0 |
16.0 |
27.0 |
45.0 |
72.0 |
| Control-days |
34.9 |
21.5 |
12.5 |
18.7 |
31.0 |
45.3 |
64.0 |
| 8 |
Case-days |
33.9 |
25.9 |
9.4 |
16.0 |
26.5 |
45.0 |
68.0 |
| Control-days |
33.8 |
20.5 |
12.5 |
18.1 |
29.4 |
44.8 |
62.3 |
| 9 |
Case-days |
33.4 |
25.2 |
9.8 |
15.6 |
26.0 |
44.0 |
66.0 |
| Control-days |
33.7 |
20.7 |
12.5 |
17.9 |
28.5 |
46.0 |
61.0 |
| 10 |
Case-days |
33.9 |
25.4 |
9.7 |
15.4 |
27.2 |
45.8 |
67.0 |
| Control-days |
34.0 |
21.1 |
12.5 |
17.9 |
28.6 |
46.0 |
64.5 |
| 11 |
Case-days |
34.0 |
25.1 |
10.0 |
15.0 |
27.0 |
46.0 |
69.2 |
| Control-days |
34.5 |
21.0 |
13.0 |
18.1 |
28.3 |
46.1 |
64.3 |
| 12 |
Case-days |
33.9 |
26.8 |
10.0 |
15.0 |
26.2 |
42.9 |
70.0 |
| Control-days |
35.2 |
21.7 |
12.8 |
18.7 |
29.3 |
47.3 |
65.3 |
| 13 |
Case-days |
34.8 |
27.1 |
9.8 |
15.5 |
27.0 |
45.0 |
69.7 |
| Control-days |
35.7 |
22.0 |
12.7 |
19.1 |
30.3 |
47.7 |
66.0 |
| * There were 892 case-days and 2,230 control days with complete information on TSP concentration and other covariates. |
|
Supplementary file: Table 5Adjusted OR's* for doctor's visit for respiratory symptoms per 10 µg/m3 increase in TSP at separate lags in major subcategories of participants as estimated in conditional logistic regression. |
|
All subjects
|
| |
Asthma diagnosis
|
Bronchitis
|
COPD
|
Healthy
|
|
n visits
|
170
|
414
|
148
|
181
|
| |
OR |
95%CI |
OR |
95%CI |
OR |
95%CI |
OR |
95%CI |
|
Lag 0
|
0.977 |
0.875 |
1.091 |
1.016 |
0.957 |
1.079 |
1.001 |
0.894 |
1.120 |
0.966 |
0.885 |
1.054 |
|
Lag 1
|
0.979 |
0.930 |
1.031 |
1.013 |
0.984 |
1.042 |
1.032 |
0.976 |
1.092 |
0.966 |
0.930 |
1.003 |
|
Lag 2
|
0.981 |
0.912 |
1.057 |
1.009 |
0.965 |
1.055 |
1.065 |
0.984 |
1.152 |
0.966 |
0.901 |
1.035 |
|
Lag 3
|
1.020 |
0.947 |
1.099 |
1.011 |
0.970 |
1.054 |
1.051 |
0.978 |
1.131 |
0.991 |
0.928 |
1.059 |
|
Lag 4
|
1.068
|
1.003
|
1.137
|
1.013 |
0.976 |
1.052 |
1.006 |
0.944 |
1.072 |
1.025 |
0.974 |
1.079 |
|
Lag 5
|
1.073
|
1.002
|
1.150
|
1.009 |
0.964 |
1.055 |
0.981 |
0.905 |
1.063 |
1.033 |
0.970 |
1.101 |
|
Lag 6
|
1.036 |
0.981 |
1.093 |
0.999 |
0.965 |
1.035 |
0.986 |
0.924 |
1.052 |
1.015 |
0.964 |
1.068 |
|
Lag 7
|
0.988 |
0.932 |
1.047 |
0.991 |
0.956 |
1.027 |
1.013 |
0.959 |
1.070 |
0.990 |
0.944 |
1.039 |
|
Lag 8
|
0.965 |
0.899 |
1.035 |
0.989 |
0.945 |
1.035 |
1.040 |
0.972 |
1.111 |
0.983 |
0.925 |
1.045 |
|
Lag 9
|
0.985 |
0.932 |
1.041 |
0.995 |
0.960 |
1.032 |
1.045 |
0.985 |
1.108 |
1.007 |
0.954 |
1.062 |
|
Lag 10
|
1.037 |
0.967 |
1.113 |
1.004 |
0.962 |
1.048 |
1.022 |
0.947 |
1.102 |
1.051 |
0.989 |
1.117 |
|
Lag 11
|
1.049 |
0.974 |
1.130 |
0.997 |
0.952 |
1.045 |
0.990 |
0.917 |
1.068 |
1.065
|
1.001
|
1.133
|
|
Lag 12
|
0.996 |
0.952 |
1.042 |
0.974 |
0.946 |
1.002 |
0.969 |
0.920 |
1.021 |
1.031 |
0.990 |
1.074 |
|
Lag 13
|
0.946 |
0.855 |
1.046 |
0.950 |
0.895 |
1.009 |
0.949 |
0.843 |
1.068 |
0.999 |
0.914 |
1.091 |
| * All models were adjusted for flu prevalence, polynomial distributed lags of T, RH, AP, T2, RH2, and T*RH from lag 0–6 days up to 2 degrees of freedom, and average T, RH, AP, and T2 from lag 7–13 days.
** Bold font indicates p-values <0.05. |
|
Supplementary file: Table 6
Adjusted OR's* for doctor's visit per 10 µg/m3 increase in TSP at separate lags in major subcategories of participants after stratification by smoking status as estimated in conditional logistic regression. |
|
Current smokers
|
Former or never smokers
|
| |
Asthma
|
Bronchitis
|
COPD
|
Asthma
|
Bronchitis
|
COPD
|
Healthy
|
|
n visits
|
48
|
198
|
78
|
122
|
215
|
70
|
153
|
| |
OR** |
95%CI** |
OR |
95%CI |
OR |
95%CI |
OR |
95%CI |
OR |
95%CI |
OR |
95%CI |
OR |
95%CI |
|
Lag 0
|
1.062 |
0.749 |
1.506 |
1.030 |
0.941 |
1.126 |
1.043 |
0.871 |
1.250 |
0.974 |
0.853 |
1.111 |
1.003 |
0.916 |
1.098 |
1.002 |
0.808 |
1.242 |
0.910 |
0.808 |
1.024 |
|
Lag 1
|
0.934 |
0.787 |
1.109 |
1.025 |
0.980 |
1.073 |
1.089 |
0.984 |
1.205 |
0.998 |
0.937 |
1.062 |
1.003 |
0.959 |
1.048 |
0.981 |
0.880 |
1.093 |
0.944
|
0.899
|
0.991
|
|
Lag 2
|
0.821 |
0.658 |
1.025 |
1.021 |
0.953 |
1.093 |
1.137 |
0.996 |
1.298 |
1.022 |
0.931 |
1.122 |
1.002 |
0.937 |
1.073 |
0.960 |
0.813 |
1.133 |
0.979 |
0.899 |
1.066 |
|
Lag 3
|
0.847 |
0.680 |
1.056 |
1.017 |
0.955 |
1.082 |
1.071 |
0.956 |
1.200 |
1.050 |
0.955 |
1.154 |
1.012 |
0.950 |
1.078 |
0.967 |
0.826 |
1.133 |
1.022 |
0.940 |
1.110 |
|
Lag 4
|
0.993 |
0.799 |
1.234 |
1.013 |
0.956 |
1.074 |
0.953 |
0.860 |
1.056 |
1.058 |
0.981 |
1.141 |
1.021 |
0.967 |
1.077 |
1.004 |
0.880 |
1.147 |
1.051 |
0.986 |
1.119 |
|
Lag 5
|
1.113 |
0.876 |
1.416 |
1.009 |
0.940 |
1.082 |
0.906 |
0.789 |
1.040 |
1.036 |
0.954 |
1.125 |
1.016 |
0.951 |
1.084 |
1.043 |
0.889 |
1.224 |
1.049 |
0.970 |
1.135 |
|
Lag 6
|
1.127 |
0.946 |
1.343 |
1.001 |
0.950 |
1.054 |
0.939 |
0.838 |
1.052 |
0.999 |
0.933 |
1.069 |
1.002 |
0.951 |
1.056 |
1.069 |
0.939 |
1.217 |
1.026 |
0.964 |
1.092 |
|
Lag 7
|
1.053 |
0.870 |
1.275 |
0.989 |
0.938 |
1.042 |
1.018 |
0.930 |
1.115 |
0.973 |
0.902 |
1.049 |
0.995 |
0.942 |
1.050 |
1.079 |
0.967 |
1.203 |
1.003 |
0.945 |
1.064 |
|
Lag 8
|
0.965 |
0.753 |
1.238 |
0.973 |
0.909 |
1.042 |
1.081 |
0.970 |
1.205 |
0.978 |
0.894 |
1.070 |
1.004 |
0.940 |
1.073 |
1.078 |
0.943 |
1.232 |
0.998 |
0.924 |
1.079 |
|
Lag 9
|
0.922 |
0.759 |
1.121 |
0.958 |
0.906 |
1.012 |
1.068 |
0.970 |
1.177 |
1.019 |
0.951 |
1.092 |
1.032 |
0.979 |
1.088 |
1.075 |
0.944 |
1.223 |
1.022 |
0.955 |
1.094 |
|
Lag 10
|
0.940 |
0.762 |
1.159 |
0.951 |
0.889 |
1.017 |
0.985 |
0.875 |
1.110 |
1.073 |
0.989 |
1.165 |
1.059 |
0.994 |
1.128 |
1.076 |
0.915 |
1.266 |
1.059 |
0.981 |
1.143 |
|
Lag 11
|
0.967 |
0.769 |
1.217 |
0.964 |
0.897 |
1.036 |
0.934 |
0.831 |
1.051 |
1.062 |
0.973 |
1.160 |
1.032 |
0.964 |
1.106 |
1.084 |
0.923 |
1.273 |
1.059 |
0.980 |
1.145 |
|
Lag 12
|
0.957 |
0.836 |
1.095 |
0.994 |
0.955 |
1.036 |
0.956 |
0.876 |
1.044 |
0.982 |
0.929 |
1.039 |
0.955 |
0.912 |
1.001 |
1.092 |
0.959 |
1.244 |
1.012 |
0.966 |
1.061 |
|
Lag 13
|
0.946 |
0.702 |
1.275 |
1.026 |
0.938 |
1.122 |
0.979 |
0.805 |
1.190 |
0.908 |
0.806 |
1.023 |
0.884
|
0.802
|
0.974
|
1.101 |
0.853 |
1.421 |
0.968 |
0.870 |
1.076 |
| * All models were adjusted for flu prevalence, polynomial distributed lags of T, RH, AP, T2, RH2, and T*RH from lag 0–6 days up to 2 degrees of freedom, and average T, RH, AP, and T2 from lag 7–13 days.
** Bold font indicates p-values <0.05. |
|
Supplementary file: Table 7Adjusted OR's* for doctor's visit per 10 µg/m3 increase in TSP at separate lags in major subcategories of participants after stratification by gender as estimated in conditional logistic regression. |
|
Males
|
| |
Asthma
|
Bronchitis
|
COPD
|
Healthy
|
|
n visits
|
81
|
173
|
92
|
42
|
| |
OR** |
95%CI** |
OR |
95%CI |
OR |
95%CI |
OR |
95%CI |
|
Lag 0
|
1.140 |
0.929 |
1.399 |
1.014 |
0.896 |
1.147 |
1.016 |
0.882 |
1.170 |
0.764 |
0.486 |
1.202 |
|
Lag 1
|
1.052 |
0.956 |
1.159 |
1.020 |
0.961 |
1.082 |
1.032 |
0.960 |
1.109 |
0.896 |
0.753 |
1.067 |
|
Lag 2
|
0.971 |
0.850 |
1.111 |
1.025 |
0.951 |
1.105 |
1.048 |
0.949 |
1.158 |
1.051 |
0.715 |
1.545 |
|
Lag 3
|
0.986 |
0.864 |
1.126 |
1.044 |
0.971 |
1.123 |
1.057 |
0.964 |
1.158 |
1.331 |
0.885 |
2.002 |
|
Lag 4
|
1.061 |
0.944 |
1.193 |
1.056 |
0.988 |
1.129 |
1.048 |
0.965 |
1.138 |
1.505
|
1.089
|
2.080
|
|
Lag 5
|
1.087 |
0.946 |
1.250 |
1.041 |
0.962 |
1.126 |
1.028 |
0.927 |
1.139 |
1.303 |
0.932 |
1.824 |
|
Lag 6
|
1.043 |
0.936 |
1.161 |
1.005 |
0.946 |
1.066 |
1.008 |
0.929 |
1.094 |
0.942 |
0.728 |
1.219 |
|
Lag 7
|
0.972 |
0.883 |
1.070 |
0.969 |
0.916 |
1.025 |
1.001 |
0.934 |
1.073 |
0.698
|
0.541
|
0.901
|
|
Lag 8
|
0.931 |
0.822 |
1.056 |
0.953 |
0.885 |
1.026 |
1.013 |
0.932 |
1.102 |
0.653
|
0.477
|
0.894
|
|
Lag 9
|
0.954 |
0.859 |
1.060 |
0.966 |
0.909 |
1.027 |
1.041 |
0.966 |
1.121 |
0.847 |
0.678 |
1.059 |
|
Lag 10
|
1.030 |
0.926 |
1.145 |
0.996 |
0.930 |
1.068 |
1.060 |
0.960 |
1.172 |
1.328
|
1.031
|
1.712
|
|
Lag 11
|
1.054 |
0.940 |
1.183 |
0.995 |
0.926 |
1.070 |
1.025 |
0.931 |
1.128 |
1.544
|
1.139
|
2.093
|
|
Lag 12
|
0.986 |
0.905 |
1.074 |
0.952 |
0.904 |
1.003 |
0.943 |
0.882 |
1.009 |
1.175 |
0.945 |
1.461 |
|
Lag 13
|
0.922 |
0.773 |
1.099 |
0.910 |
0.814 |
1.019 |
0.869 |
0.739 |
1.020 |
0.894 |
0.572 |
1.400 |
|
Females
|
| |
Asthma
|
Bronchitis
|
COPD
|
Healthy
|
|
n visits
|
89
|
241
|
56
|
139
|
| |
OR |
95%CI |
OR |
95%CI |
OR |
95%CI |
OR |
95%CI |
|
Lag 0
|
0.947 |
0.803 |
1.116 |
1.041 |
0.959 |
1.130 |
1.038 |
0.588 |
1.832 |
0.983 |
0.868 |
1.114 |
|
Lag 1
|
0.971 |
0.900 |
1.047 |
1.017 |
0.976 |
1.061 |
1.315 |
0.943 |
1.833 |
0.973 |
0.919 |
1.030 |
|
Lag 2
|
0.995 |
0.887 |
1.116 |
0.994 |
0.935 |
1.058 |
1.667
|
1.031
|
2.694
|
0.962 |
0.879 |
1.054 |
|
Lag 3
|
1.029 |
0.918 |
1.154 |
0.985 |
0.930 |
1.044 |
1.350 |
0.948 |
1.923 |
0.975 |
0.893 |
1.066 |
|
Lag 4
|
1.065 |
0.966 |
1.175 |
0.989 |
0.939 |
1.043 |
0.870 |
0.668 |
1.133 |
1.012 |
0.949 |
1.080 |
|
Lag 5
|
1.084 |
0.971 |
1.210 |
0.996 |
0.937 |
1.059 |
0.761 |
0.519 |
1.116 |
1.047 |
0.967 |
1.133 |
|
Lag 6
|
1.078 |
0.981 |
1.185 |
1.001 |
0.954 |
1.050 |
0.968 |
0.754 |
1.242 |
1.063 |
0.993 |
1.139 |
|
Lag 7
|
1.052 |
0.948 |
1.169 |
1.004 |
0.954 |
1.056 |
1.443
|
1.027
|
2.027
|
1.057 |
0.993 |
1.125 |
|
Lag 8
|
1.018 |
0.906 |
1.143 |
1.008 |
0.946 |
1.073 |
1.850
|
1.081
|
3.167
|
1.032 |
0.958 |
1.111 |
|
Lag 9
|
0.987 |
0.908 |
1.073 |
1.012 |
0.964 |
1.063 |
1.640
|
1.051
|
2.558
|
1.002 |
0.938 |
1.070 |
|
Lag 10
|
0.972 |
0.858 |
1.101 |
1.015 |
0.956 |
1.077 |
1.067 |
0.815 |
1.397 |
0.982 |
0.907 |
1.064 |
|
Lag 11
|
0.982 |
0.860 |
1.122 |
1.005 |
0.940 |
1.073 |
0.861 |
0.632 |
1.172 |
0.992 |
0.916 |
1.074 |
|
Lag 12
|
1.007 |
0.941 |
1.078 |
0.982 |
0.944 |
1.022 |
1.073 |
0.871 |
1.321 |
1.023 |
0.976 |
1.073 |
|
Lag 13
|
1.032 |
0.877 |
1.215 |
0.960 |
0.887 |
1.040 |
1.337 |
0.848 |
2.107 |
1.056 |
0.949 |
1.174 |
| * All models were adjusted for flu prevalence, polynomial distributed lags of T, RH, AP, T2, RH2, and T*RH from lag 0–6 days up to 2 degrees of freedom, and average T, RH, AP, and T2 from lag 7–13 days.
** Bold font indicates p-values <0.05. |

Supplementary file: Figure 1
Adjusted OR’s for doctor visits for respiratory symptoms per 10 µg/m3 increase in TSP at separate lags in subjects with asthma (A), chronic bronchitis (B), COPD (C), and subjects who are healthy (D) as estimated in conditional logistic regression. All models were adjusted for flu prevalence, polynomial distributed lags of T, RH, AP, T2, RH2, and T*RH from lag 0–6 days up to 2 degrees of freedom, and average T, RH, AP, and T2 from lag 7–13 days.
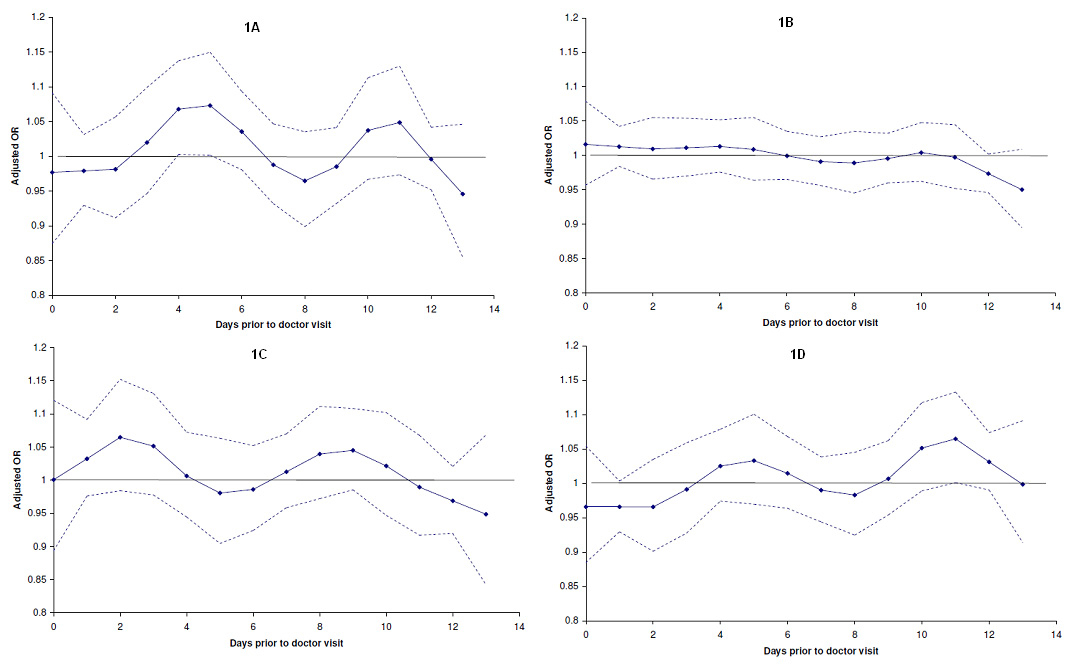
The SAPALDIA team:
Study directorate: T. Rochat (p), J. M. Gaspoz (c), N. Künzli (e/exp), N. M. Probst Hensch (e/g), C. Schindler (s).
Scientific team: U. Ackermann-Liebrich (e), J. C. Barthélémy (c), W. Berger (g), R. Bettschart (p), A. Bircher (a), G. Bolognini (p), O. Brändli (p), C. Brombach (n), M. Brutsche (p), L. Burdet (p), M. Frey (p), U. Frey (pd), M. W. Gerbase (p), D. Gold (e/c/p), E. de Groot (c), W. Karrer (p), R. Keller (p), B. Knöpfli (p), B. Martin (pa), D. Miedinger (o), U. Neu (exp), L. Nicod (p), M. Pons (p), F. Roche (c), T. Rothe (p), E. Russi (p), P. Schmid-Grendelmeyer (a), M. Tamm (P), A. Schmidt-Trucksäss (pa), A. Turk (p), J. Schwartz (e), D. Stolz (p), P. Straehl (exp), J.-M. Tschopp (p), A. von Eckardstein (cc), J. P. Zellweger (p), E Zemp Stutz (e).
Scientific team at coordinating centres: M. Adam (e/g), E. Boes (g), P. O. Bridevaux (p), D. Carballo (c), E. Corradi (e), I. Curjuric (e), J. Dratva (e), A. Di Pasquale (s), L. Grize (s), D. Keidel (s), S. Kriemler (pa), A. Kumar (g), M. Imboden (g), N. Maire (s), A. J. Mehta (e), F. Meier (e), H. Phuleria (exp), E. Schaffner (s), G. A. Thun (g) A. Ineichen (exp), M. Ragettli (e), M. Ritter (exp), T. Schikowski (e), G. Stern (pd), M. Tarantino (s), M. Tsai (e), M. Wanner (pa).
(a) allergology; (c) cardiology; (cc) clinical chemistry; (e) epidemiology; (exp) exposure; (g) genetic and molecular biology; (m) meteorology; (n) nutrition; (o) occupational health; (p) pneumology; (pa) physical activity; (pd) paediatrics; (s) statistics.
Local fieldworkers:
Aarau: S. Brun, G. Giger, M. Sperisen, M. Stahel; Basel: C. Bürli, C. Dahler, N. Oertli, I. Harreh, F. Karrer, G. Novicic, N. Wyttenbacher; Davos: A. Saner, P. Senn, R. Winzeler; Geneva: F. Bonfils, B. Blicharz, C. Landolt, J. Rochat; Lugano: S. Boccia, E. Gehrig, M.-T. Mandia, G. Solari, B. Viscardi, Montana: A. P. Bieri, C. Darioly, M. Maire, Payerne: F. Ding, P. Danieli A. Vonnez; Wald: D. Bodmer, E. Hochstrasser, R. Kunz, C. Meier, J. Rakic, U. Schafroth, A. Walder.
Administrative staff: C. Gabriel, R. Gutknecht.
Acknowledgement: We would like to thank the whole SAPALDIA team for their contribution to the study. Additionally, the study could not have been done without the help of the study participants, technical and administrative support and the medical teams and field workers at the local study sites.
References
1 Dominici F, Peng RD, Bell ML, Pham L, McDermott A, Zeger SL, Samet JM. Fine particulate air pollution and hospital admission for cardiovascular and respiratory diseases. JAMA. 2006;295:1127–34.
2 Koenig JQ, Air pollution and asthma. J Allergy Clin Immunol. 1999;104:717–22.
3 Sunyer J, Schwartz J, Tobías A, Macfarlane D, Garcia J, Antó JM, Patients with chronic obstructive pulmonary disease are at increased risk of death associated with urban particle air pollution: a case-crossover analysis. Am J Epidemiol. 2000;151:50–6.
4 Perez L, Rapp R, Künzli N. The Year of the Lung: outdoor air pollution and lung health. Swiss Med Wkly. 2010;140:w13129.
5 Chardon B, Lefranc A, Granados D, Grémy I. Air pollution and doctors’ house calls for respiratory diseases in the Greater Paris area (2000-3). Occup Environ Med. 2007;64:320–4.
6 Hajat S, Haines A, Goubet SA, Anderson H. Association of air pollution with daily GP consultations for asthma and other lower respiratory conditions in London. Thorax. 1999;54:597–605.
7 Hwang JS, Chan CC. Effects of air pollution on daily clinic visits for lower respiratory tract illness. Am J Epidemiol. 2002;155:1–10.
8 Wong TW, Tam W, Tak Sun Yu I, Wun YT, Wong AH, Wong CM. Association between air pollution and general practitioner visits for respiratory diseases in Hong Kong. Thorax. 2006;61:585–91.
9 Martin BW, Ackermann-Liebrich U, Leuenberger P, Künzli N, Stutz EZ, Keller R, et al. SAPALDIA: methods and participation in the cross-sectional part of the Swiss Study on Air Pollution and Lung Diseases in Adults. Soz Praventivmed. 1997;42:67–84.
10 Ackermann-Liebrich U, Kuna-Dibbert B, Probst-Hensch NM, Schindler C, Felber Dietrich D, Stutz EZ, et al. Follow-up of the Swiss Cohort Study on Air Pollution and Lung Diseases in Adults (SAPALDIA 2) 1991–2003: methods and characterization of participants. Soz Praventivmed. 2005;50:245–63.
11 Kaiser R, Schindler C, Künzli N, Ackermann-Liebrich U, Heeb D, Medici TC, et al. Use of transition probabilities to estimate the effect of smoking on the duration of episodes of respiratory symptoms in diary data: the Swiss Study on Air Pollution and Lung Diseases in Adults (SAPALDIA). Am J Epidemiol. 1998;148:600–8.
12 Künzli N, Stutz EZ, Perruchoud AP, Brändli O, Tschopp JM, Bolognini G, et al. Peak flow variability in the SAPALDIA study and its validity in screening for asthma-related conditions. Am J Respir Crit Care Med. 1999;160:427–34.
13 Lumley T, Levy D. Bias in the case-crossover design: implications for studies of air pollution. Environmetrics. 2000;11:689–704.
14 Monn C, Brändli O, Schindler C, Ackermann-Liebrich U, Leuenberger P. Personal exposure to nitrogen dioxide in Switzerland. Sci Total Environ. 1998;215:243–51.
15 Monn C, Braendli O, Schaeppi G, Schindler C, Ackermann-Liebrich U, Leuenberger P. Particulate matter <10 μm (PM10) and total suspended particulates (TSP) in urban, rural and alpine air in Switzerland. Atmos Environ. 1995;29:2565–73.
16 Hueglin C, Buchmann B, Weber RO. Long-term observation of real-world road traffic emission factors on a motorway in Switzerland. Atmos Environ. 2006;40:3696–709.
17 Pope CA 3rd, Schwartz J. Time series for the analysis of pulmonary health data. Am J Respir Crit Care Med. 1996;154:S229–33.
18 Schwartz J. The distributed lag between air pollution and daily deaths. Epidemiol. 2000;11:320–6.
19 Zanobetti A, Schwartz J, Samoli E, Gryparis A, Touloumi G, Peacock J, et al. The temporal pattern of respiratory and heart disease mortality in response to air pollution. Environ Health Perspect. 2003;111:1188–93.
20 Peel JL, Tolbert PE, Klein M, Metzger KB, Flanders WD, Todd K, et al. Ambient air pollution and respiratory emergency department visits. Epidemiology. 2005;16:164–74.
21 Mar TF, Larson TV, Stier RA, Claiborn C, Koenig JQ. An analysis of the association between respiratory symptoms in subjects with asthma and daily air pollution in Spokane, Washington. Inhal Toxicol. 2004;16:809–15.
22 Sint T, Donohue JF, Ghio AJ. Ambient air pollution particles and the acute exacerbation of chronic obstructive pulmonary disease. Inhal Toxicol. 2008;20:25–9.
23 Halbert RJ, Isonaka S, George D, Iqbal A. Interpreting COPD prevalence estimates: what is the true burden of disease? Chest. 2003;123:1684–92.
24 Probst-Hensch N, Tanner M, Kessler C, Burri C, Künzli N. Prevention – a cost-effective way to fight the non-communicable disease epidemic: an academic perspective of the United Nations High-level NCD Meeting. Swiss Med Wkly. 2011;141:w13266.
25 Probst-Hensch NM. Chronic age-related diseases share risk factors: do they share pathophysiological mechanisms and why does that matter? Swiss Med Wkly. 2010;140:w13072.
26 Carracedo-Martínez E, Taracido M, Tobias A, Saez M, Figueiras A. Case-crossover analysis of air pollution health effects: a systematic review of methodology and application. Environ Health Perspect. 2010;118:1173–82.
27 Janes H, Sheppard L, Lumley T. Case-crossover analyses of air pollution exposure data: referent selection strategies and their implications for bias. Epidemiol. 2005;16:717–26.
28 Fischer A, Gehrig R, Hofer P. Russmessungen in der Aussenluft-Methodik und Reultate. Bern: Bundesamt fur Umwelt, Wld und Landschaft (BUWAL); 1997.