DOI: https://doi.org/10.4414/smw.2012.13607
The World Health Organization reports that cancer, second (but only nearly) to cardiovascular disease, is the most important cause of morbidity (≥3 million new cases per year) and mortality (20% of all deaths, approximately 1.7 million cancer deaths per year) in Europe [1]. Over the past decades in developed countries, cancer incidence and mortality have consistently shown a greater burden in older (≥65 years) compared to younger adults [1–4].
Because cancer is a disease of aging, the interaction of age and cancer is of growing importance as the world’s population ages but of distinct concern for developed societies (i.e., greater numbers aging in developing countries but larger proportion aging in developed countries). Over the last century there have been remarkable changes in the developed world’s population. One hallmark of these changes is the rapid expansion of the older population with simultaneously low fertility rates. In Switzerland, with one of the developed world’s highest life expectancies (in 2009 women 84.4 and men 79.8 years) and lowest fertility rates, the inevitable shift in the population age structure (≥65 years 17% in 2009, projected 28% by 2050) foreshadows many public health challenges [5–8]. Although we cannot truly anticipate the changes that rapid population aging will bring, we can work to understand the epidemiologic patterns of aging, cancer, where they intersect, and their potential implications. Such understanding will provide a framework to address age-specific disparities in research, prevention, and treatment in the largest cancer population; older adults [9]. This is essential because demographic pressures assure the complex resource intensive management of cancer in older adults will be an increasingly burdensome problem for developed societies like Switzerland.
Age is the single most important risk factor for developing cancer [10]. Yet other factors such as socio-demographic and geo-cultural characteristics (seldom examined at the individual level in population-based epidemiological research) may also be related to cancer risk in older adults. Cancer mortality in Switzerland (from registration and mortality data) has been previously published but without attention to older age-groups or socio-demographic and geo-cultural factors [4, 11–15]. This study, a comprehensive look at cancer mortality risk factors, is an important step towards addressing this aging-cancer knowledge gap. Our objective utilising the Swiss National Cohort (SNC) Study, a census based national research platform, was to evaluate gender-age-specific cancer mortality risk factors in older adults in Switzerland with attention to the most common types of cancer [16, 17].
Study design and methods of the Swiss National Cohort Study (SNC) have been reported elsewhere [16, 17]. Briefly, using a set of available common key variables (e.g., sex, date of birth, place of residence, marital status) 1990 and 2000 census records were probabilistically linked to federal death or emigration records using the Generalized Record Linkage System (GRLS) [16, 18, 19]. Participation in the Swiss census is mandatory. Therefore, enumeration is virtually complete; 2000 census estimated coverage 98.6% [20, 21]. The current study population included all persons ≥65 years recorded in a census linked to mortality records through the end of 2008 (N = 2,253,378). For additional methods details see companion paper.
All-cause and cause-specific cancer deaths recorded on official Swiss death certificates between 1 January 1991 and 31 December 2008 were included in these analyses. Death certificates have been shown to be an accurate source of assigning cancer deaths [22, 23]. All-cause cancer deaths (N = 208,239) were coded as underlying cause of death by International Classification of Diseases version 8 (before 1995) and 10 (after 1994), ICD-8 codes 140-209 and ICD-10 codes C00-C97. Cause-specific cancer deaths included: breast cancer (N = 16,733) ICD-8 codes 174-175 and ICD-10 codes C50; colorectal cancer (N = 24,582) ICD-8 153-154 and ICD-10 C18-C21; lung cancer (N = 33,454) ICD-8 162 and ICD-10 C33-C34; prostate cancer (N = 22,740) ICD-8 185 and ICD-10 C61.
All socio-demographic variables were measured using variables from the census. Questionnaires (German, French, Italian, English) and variable lists (German, French) are available from the SNC website http://www.swissnationalcohort.ch/index.php?id=2991 [16]. Specifically included in these analyses were: sex; age at census (65–74, 75–84, ≥85, also ≥65 years); nationality (Swiss, non-Swiss); educational level (compulsory schooling or less, secondary education, tertiary education, not known); marital status (single, married, widowed, divorced); religion (Catholic, Protestant, no denomination, other/undeclared); urbanisation (urban, suburban, rural); household type (lives alone, two or more persons, institution); language region (German, French, Italian).
Cancer mortality was calculated using person years (PY) at risk; additional analytic details available in the companion paper. At risk time began on 1 January 1991 or 5 December 2000 (census date) if ≥65 years at census date otherwise on date of 65th birthday. It ended on (first occurrence of) date of death, date of emigration from Switzerland, 4 December 2000 for persons identified only in 1990 census, or 31 December 2008. Total at risk person-time (age 65-74, 75-84, ≥85 years respectively) was men 4,747,989 PY; 2,640,244 PY; 715,836 PY and women 5,826,815 PY; 4,211,652 PY; 1,769,929 PY. All unlinked death records were assigned an appropriately chosen (matched for sex, age within 1 year) census record to avoid underestimation of absolute mortality rates [24]. Although it has been previously shown that adjusting for unlinked deaths does not substantially change relative risks, we performed sensitivity analyses that verified differences were indeed negligible (supplementary table 1) [24].
We calculated gender-age-specific all-cancer and cancer-specific mortality hazard ratios (HR) with 95% confidence intervals using Cox proportional hazards regression models and incidence rate ratios (IRR) with 95% CI using Poisson regression models. Since results from both models were nearly identical (supplementary table 2) we report only HR. Models were adjusted for table 1 characteristics assessing both gender-age-specific and gender-specific (combined age ≥65 years) cancer mortality relative risk and included an indicator variable for ICD coding period (before/after ICD changes) and calendar year. All tabulated analyses were done using Stata version 11.1 [25].
Cancer mortality maps were plotted in ArcGIS using Poisson regression models with random effects to obtain smoothed standardised mortality ratios (SMR) for each community [26]. Estimates from small areas with zero or few deaths were shrunk to the weighted mean of neighbouring areas [27]. We obtained full Bayesian estimates of the spatial variability using the conditional auto-regressive distribution in WinBugs [28, 29].
| Table 1: Characteristics of the analytic study population (older Swiss adults ≥65 years old), 1991–2008. | ||
| Males | Females | |
| Total | 986,634 (43.8%) | 1,266,744 (56.2%) |
| Age at 1990 census <65 years1 65–74 years 75–84 years ≥85 years | 300,592 (30.5%) 231,609 (23.5%) 130,688 (13.2%) 28,774 (2.9%) | 345,094 (27.2%) 296,476 (23.4%) 221,246 (17.5%) 74,971 (5.9%) |
| Age at 2000 census <65 years1 65–74 years 75–84 years ≥85 years | 281,521 (28.5%) 263,056 (26.7%) 146,993 (14.9%) 41,109 (4.2%) | 302,211 (23.9%) 324,726 (25.6%) 234,578 (18.5%) 103,008 (8.1%) |
| Nationality Swiss Non-Swiss | 869,840 (88.2%) 116,794 (11.8%) | 1,169,358 (92.3%) 97,386 (7.7%) |
| Educational attainment Compulsory schooling or less Secondary education Tertiary education Not known | 272,837 (27.7%) 483,990 (49.0%) 211,761 (21.5%) 18,046 (1.8%) | 662,961 (52.3%) 501,777 (39.6%) 69,617 (5.5%) 32,389 (2.6%) |
| Marital status Single Married Widowed Divorced | 76,507 (7.8%) 778,765 (78.9%) 73,345 (7.4%) 58,017 (5.9%) | 136,867 (10.8%) 675,448 (53.3%) 361,231 (28.5%) 93,198 (7.4%) |
| Household type Single person Multi-person Institution | 135,712 (13.8%) 818,364 (82.9%) 32,558 (3.3%) | 396,031 (31.3%) 790,671 (62.4%) 80,042 (6.3%) |
| Religion Protestant Roman Catholic No denomination Other / unknown | 456,793 (46.3%) 412,358 (41.8%) 79,404 (8.0%) 38,079 (3.9%) | 617,559 (48.8%) 539,006 (42.5%) 66,342 (5.2%) 43,837 (3.5%) |
| Language region German French Italian | 712,950 (72.3%) 226,029 (22.9%) 47,655 (4.8%) | 907,334 (71.6%) 294,272 (23.2%) 65,138 (5.2%) |
| Urbanisation Urban Peri-urban Rural | 305,133 (30.9%) 419,611 (42.5%) 261,890 (26.6%) | 443,788 (35.0%) 509,519 (40.2%) 313,437 (24.8%) |
| 1 Study entry after census date on 65th birthday. | ||
| Table 2: Relative risks for cancer mortality in Swiss men ≥65 years old, 1991–2008. | |||||
| Characteristic | Category | Cancer mortality – HR (95% CI) | |||
| All-cancer | Lung cancer | Colorectal cancer | Prostate cancer | ||
| Nationality | Swiss Non-Swiss | 1 0.98 (0.96, 1.00) | 1 1.06 (1.01, 1.11) | 1 1.00 (0.93, 1.08) | 1 0.78 (0.73, 0.83) |
| Educational attainment | Compulsory or less Secondary education Tertiary education | 1.09 (1.07, 1.10) 1 0.84 (0.82, 0.85) | 1.27 (1.24, 1.31) 1 0.65 (0.62, 0.67) | 1.00 (0.96, 1.05) 1 0.88 (0.84, 0.92) | 0.99 (0.96, 1.03) 1 0.95 (0.92, 0.99) |
| Marital status | Single Married Widowed Divorced | 1.00 (0.97, 1.03) 1 1.10 (1.08, 1.13) 1.19 (1.16, 1.23) | 0.91 (0.86, 0.96) 1 1.17 (1.11, 1.24) 1.41 (1.33, 1.50) | 1.02 (0.94, 1.11) 1 1.09 (1.02, 1.17) 1.06 (0.96, 1.17) | 0.90 (0.85, 0.96) 1 1.01 (0.96, 1.07) 0.98 (0.91, 1.07) |
| Household type | Single person Multi persons Institutions | 1.00 (0.97, 1.02) 1 0.95 (0.92, 0.98) | 1.01 (0.96, 1.06) 1 0.82 (0.75, 0.89) | 1.02 (0.95, 1.09) 1 0.95 (0.86, 1.05) | 0.99 (0.94, 1.04) 1 0.99 (0.92, 1.06) |
| Religion | Protestant Roman Catholic No affiliation Other / unknown | 1 1.04 (1.03, 1.05) 1.00 (0.98, 1.03) 0.90 (0.87, 0.93) | 1 1.04 (1.01, 1.07) 1.05 (1.00, 1.11) 0.87 (0.81, 0.93) | 1 1.04 (1.00, 1.08) 1.05 (0.97, 1.13) 0.96 (0.87, 1.05) | 1 0.95 (0.92, 0.98) 0.89 (0.84, 0.95) 0.82 (0.76, 0.88) |
| Language region | German French Italian | 1 1.03 (1.02, 1.05) 1.08 (1.05, 1.11) | 1 1.07 (1.04, 1.10) 1.10 (1.04, 1.16) | 1 0.98 (0.94, 1.02) 1.01 (0.93, 1.10) | 1 0.96 (0.93, 0.99) 0.84 (0.78, 0.90) |
| Urbanisation | Urban Peri-urban Rural | 1 0.96 (0.95, 0.98) 0.97 (0.95, 0.98) | 1 0.92 (0.89, 0.94) 0.96 (0.93, 0.99) | 1 0.99 (0.95, 1.04) 0.99 (0.95, 1.04) | 1 1.01 (0.98, 1.04) 1.04 (0.98, 1.04) |
| CI =confidence interval; HR = Hazard ratio. Based on multivariable Cox proportional hazard model adjusted for age, nationality, educational attainment, marital status, household type, religion, language region, urbanisation, calendar year, and ICD coding period. | |||||
Due to the comprehensiveness of our analyses (number of cancer sites, age categories, and independent variables) we have included only the most important results. Full results are available upon request from the authors. Because there was little variation across older age-groups we primarily present results from combined age (≥65 years) analyses.
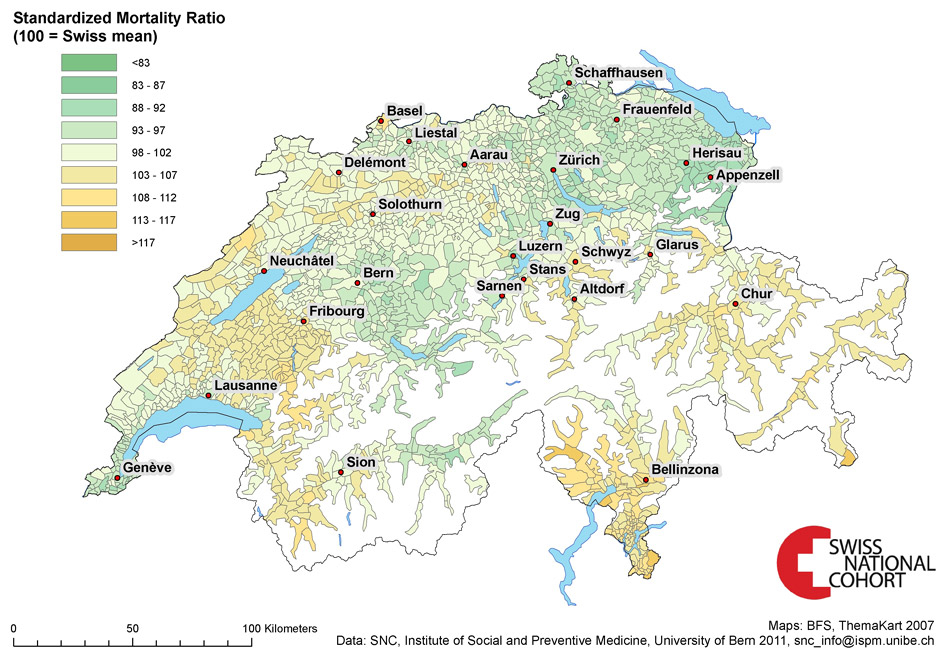
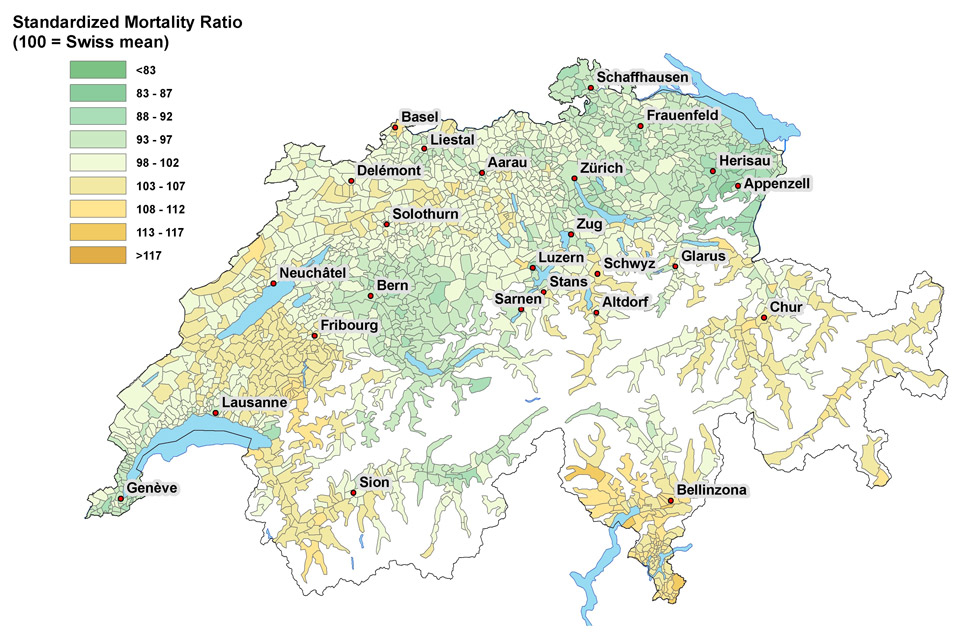
Figure 1
A Map of Switzerland showing standardised cancer mortality ratios for older Swiss men (≥65 years old).
B Map of Switzerland showing standardised cancer mortality ratios for older Swiss women (≥65 years old).
© BFS. Reprinted with permission.
The characteristics of the study population are listed in table 1. Consistent with older adult populations, more women than men were included. Approximately one-third were age 65–74 years at census and nearly 40% turned 65 years old after census date. The population was overwhelmingly Swiss (>90%), well educated (majority secondary or tertiary education), married (>60%), and lived in a multi-person households (>65%). The population reflected expected Swiss language distributions, while only one-quarter lived in rural communities. The population was similar across gender, except (characteristically of older populations) men were younger, more educated, and more often married living in multi-person households.
Table 2 lists the relative cancer mortality risk for older Swiss men by socio-demographic and regional characteristics. Cancer mortality risk decreased with increased educational attainment; all-cancer HR = 0.84 (95%CI 0.82, 0.85) tertiary, HR = 1.09 (95%CI 1.07, 1.10) ≤compulsory. For older men being divorced or widowed was also related to increased all-cancer, lung and colorectal cancer mortality risk; lung cancer HR = 1.17 (95%CI 1.11, 1.24) widowed, HR = 1.41 (95%CI 1.33, 1.50) divorced. On the other hand, older men living in institutions and with other/unknown religious affiliation had lower all-cancer and lung cancer mortality risks than those in single or multi-person households. We found that the association of cancer mortality risk for older Swiss men varied by cancer type across language regions. All-cancer and lung cancer mortality risk was up to 10% lower in German-speaking areas yet prostate cancer mortality risk was reversed; prostate cancer HR = 0.96 (95%CI 0.93, 0.99) French, HR = 0.84 (95%CI 0.78, 0.90) Italian. However, figure 1A shows modest differences in SMR for older men not wholly by language region (Fribourg SMR = 107 and Lausanne SMR = 95 both French-speaking).
Relative all-cancer and cancer-specific mortality risks for older Swiss women are shown in table 3. The risk profile of dying from cancer in older women was similar to that in older men across most socio-demographic characteristics: higher cancer mortality risk with lower educational attainment (all-cancer HR = 0.95 [95%CI 0.92, 0.98] tertiary, HR = 1.03 [95%CI 1.02, 1.05] ≤compulsory) and unmarried marital status. Older women living in urban areas had slightly higher all-cancer and cancer-specific mortality risk when compared to those living in peri-urban or rural areas of Switzerland; all-cancer HR = 0.98 (95%CI 0.96, 0.99) peri-urban, HR = 0.95 (95%CI 0.93, 0.99) rural. Despite our findings of similar trends in absolute cancer mortality trends in all language regions over the study period (see companion publication) there were notable exceptions in relative cancer-specific mortality risks. For example, older women living in French- or Italian-speaking areas had almost 30% higher risk of lung cancer mortality while breast cancer mortality risk by language region was reversed; breast cancer HR = 0.92 (95%CI 0.89, 0.96) French, HR = 0.95 (95%CI 0.88, 1.02) Italian. Similar to older men SMR (fig. 1B) indicated regional variation in all-cancer mortality risk but not consistently within language regions (e.g., Fribourg SMR = 108, Lausanne SMR = 96).
The most important gender-age-specific relative all-cancer and cancer-specific mortality risks are listed in table 4. For both older men and women higher educational attainment was related to decreased all-cancer mortality risk but most pronounced in younger old persons; men 65–74 years HR = 1.15 (95%CI 1.13, 1.18) ≤compulsory, HR = 0.77 (95%CI 0.75, 0.79) tertiary versus 74–84 years HR = 1.08 (95%CI 1.05, 1.10), HR = 0.87 (95%CI 0.85, 0.90) respectively. Analogous to combined age analyses cancer mortality gender-age-specific cancer mortality risk also varied by marital status, language region but also by age with less variation in the oldest old. While non-Swiss oldest had considerably higher lung cancer mortality risk than younger older foreign nationals; non-Swiss women HR = 0.77 (95%CI 0.68, 0.87) 65–74 years, HR = 1.07 (95%CI 0.92, 1.24) 75–84 years, HR = 1.30 (95%CI 1.01, 1.67) ≥85 years.
| Table 3: Relative risks for cancer mortality in Swiss women ≥65 years old , 1991–2008. | |||||
| Characteristic | Category | Cancer mortality – HR (95% CI) | |||
| All-cancer | Lung cancer | Colorectal cancer | Breast cancer | ||
| Nationality | Swiss Non-Swiss | 1 0.98 (0.95, 1.01) | 1 0.92 (0.84, 1.01) | 1 1.10 (1.02, 1.20) | 1 0.96 (0.89, 1.03) |
| Educational attainment | Compulsory or less Secondary education Tertiary education | 1.03 (1.02, 1.05) 1 0.95 (0.92, 0.98) | 1.05 (1.00, 1.10) 1 0.79 (0.71, 0.88) | 0.97 (0.93, 1.01) 1 0.91 (0.83, 1.01) | 0.97 (0.93, 1.00) 1 1.03 (0.95, 1.11) |
| Marital status | Single Married Widowed Divorced | 1.16 (1.13, 1.19) 1 1.17 (1.14, 1.20) 1.23 (1.19, 1.27) | 1.11 (1.02, 1.22) 1 1.32 (1.23, 1.42) 1.84 (1.68, 2.01) | 1.08 (1.01, 1.17) 1 1.15 (1.08, 1.22) 1.12 (1.03, 1.23) | 1.25 (1.18, 1.33) 1 1.10 (1.05, 1.16) 1.13 (1.04, 1.21) |
| Household type | Single person Multi-person Institutions | 0.98 (0.96, 1.00) 1 0.98 (0.95, 1.01) | 1.07 (1.00, 1.14) 1 0.72 (0.63, 0.82) | 1.03 (0.97, 1.09) 1 1.01 (0.94, 1.09) | 0.97 (0.93, 1.02) 1 1.28 (1.20, 1.36) |
| Religion | Protestant Roman Catholic No denomination Other / unknown | 1 1.03 (1.02, 1.05) 1.08 (1.04, 1.11) 0.94 (0.91, 0.97) | 1 1.04 (0.99, 1.09) 1.51 (1.38, 1.64) 1.21 (1.09, 1.33) | 1 1.02 (0.98, 1.06) 1.06 (0.97, 1.16) 0.88 (0.80, 0.97) | 1 1.02 (0.99, 1.06) 1.09 (1.01, 1.18) 0.93 (0.86, 1.01) |
| Language region | German French Italian | 1 0.99 (0.98, 1.01) 1.03 (1.00, 1.06) | 1 1.29 (1.23, 1.36) 1.29 (1.17, 1.41) | 1 1.02 (0.98, 1.06) 0.95 (0.88, 1.04) | 1 0.92 (0.89, 0.96) 0.95 (0.88, 1.02) |
| Urbanisation | Urban Peri-urban Rural | 1 0.98 (0.96, 0.99) 0.95 (0.93, 0.99) | 1 0.90 (0.86, 0.95) 0.69 (0.65, 0.73) | 1 0.99 (0.95, 1.03) 0.96 (0.92, 1.01) | 1 0.97 (0.93, 1.00) 0.96 (0.92, 1.00) |
| CI = confidence interval; HR = hazard ratio. Based on multivariable Cox proportional hazard model adjusted for age, nationality, educational attainment, marital status, household type, religion, language region, urbanisation, calendar year, and ICD coding period. | |||||
| Table 4: Gender-age-specific relative risks for cancer mortality in older Swiss adults ≥65 years old, 1991–2008. | |||||||
| Males | Females | ||||||
| 65–74 years | 75–84 years | ≥85 years | 65–74 years | 75–84 years | ≥85 years | ||
| All-cancer | All-cancer | ||||||
| Educational attainment | ≤Compulsory Secondary Tertiary | 1.15 (1.13, 1.18) 1 0.77 (0.75, 0.79) | 1.08 (1.05, 1.10) 1 0.87 (0.85, 0.90) | 1.01 (0.98, 1.04) 1 0.96 (0.92, 1.00) | 1.05 (1.03, 1.08) 1 0.94 (0.90, 0.99) | 1.02 (1.00, 1.04) 1 0.95 (0.90, 1.00) | 1.03 (1.00, 1.06) 1 0.95 (0.87, 1.03) |
| Marital status | Single Married Widowed Divorced | 1.08 (1.04, 1.13) 1 1.12 (1.07, 1.18) 1.27 (1.21, 1.32) | 0.94 (0.90, 0.98) 1 1.13 (1.09, 1.17) 1.14 (1.08, 1.20) | 0.87 (0.82, 0.93) 1 1.07 (1.03, 1.12) 1.00 (0.91, 1.10) | 1.20 (1.15, 1.26) 1 1.18 (1.13, 1.23) 1.27 (1.21, 1.34) | 1.14 (1.10, 1.19) 1 1.17 (1.13, 1.21) 1.22 (1.16, 1.29) | 1.07 (1.02, 1.13) 1 1.11 (1.06, 1.16) 1.09 (1.01, 1.17) |
| Lung cancer | Lung cancer | ||||||
| Nationality | Swiss Non-Swiss | 1 1.03 (0.97, 1.09) | 1 1.10 (1.01, 1.19) | 1 1.27 (1.05, 1.52) | 1 0.77 (0.68, 0.87) | 1 1.07 (0.92, 1.24) | 1 1.30 (1.01, 1.67) |
| Prostate cancer | Breast cancer | ||||||
| Language region | German French Italian | 1 1.01 (0.94, 1.08) 0.84 (0.72, 0.97) | 1 1.01 (0.97, 1.06) 0.86 (0.77, 0.95) | 1 0.86 (0.81, 0.92) 0.82 (0.72, 0.92) | 1 0.84 (0.78, 0.89) 1.02 (0.91, 1.15) | 1 0.99 (0.93, 1.05) 0.98 (0.87, 1.10) | 1 0.94 (0.87, 1.01) 0.84 (0.72, 0.96) |
| CI = confidence interval; HR = hazard ratio. Based on multivariable Cox proportional hazard model adjusted for age, nationality, educational attainment, marital status, household type, religion, language region, urbanisation, calendar year, and ICD coding period. | |||||||
These results provide a comprehensive look at all-cause and cancer-specific mortality and describe (as never before) the socio-demographic risk factors specific of older Swiss adults. In this study, unlike the companion paper, cancer mortality risk factors did not vary as much as hypothesised across older age-groups. However, for outcomes and characteristics with age-specific variation the oldest-old (≥85 years) generally showed lower relative cancer mortality risk (except for non-Swiss lung cancer risk). Interestingly, the risk profile for older men and women was similar: educational attainment and marital status were related to gender-age-specific cancer risk. And incongruently, these findings showed moderate cancer-specific regional (language region) mortality relative effects unlike the gender-age-specific absolute trends of our companion paper.
Cancer is a disease of aging because it is known to be a multi-step process, and with longevity there is both increased opportunity for DNA damage and longer exposures to potential carcinogens [10]. If older adults have greater potential for accrued molecular damage coexisting with age-related decreased cellular repair activity; increased cancer risk should be expected. This and other older-age-specific population-based epidemiologic evidence (albeit more limited than all-age) demonstrating greater cancer burden in older adults support these proposed aging-cancer linked processes [1, 30–35]. However, as this work indicates in Switzerland (like other developed countries) age alone is not the only important cancer risk factor and risk is not necessarily the same across older age-groups.
Our findings that relative and absolute (from companion paper) all-cancer and cancer-specific mortality risk was inversely related to educational attainment is consistent with studies from other developed countries evaluating socioeconomic status (SES) and/or education as a proxy for SES (for example [36–38]). In Switzerland and other developed countries, persistent differences in cancer mortality risk across educational gradients and age-groups are both cause for concern (i.e., pervasiveness of their effect) and represent a chance to better understand SES-related risk factors and how they lead to better-or-worse cancer outcomes. The differences in cancer risk associated with education (or SES) likely reflect differences in financial resources, lifestyles (including carcinogenic exposures), and access to healthcare services that influence cancer mortality risk. Of interest in these findings are the attenuated effects of educational attainment in older women as compared with men. We surmise that the true education-cancer-mortality effect in older women is underestimated. We know that most Swiss older women were married, had compulsory or less education, were primarily housewives not working outside the home (birth cohort effect); but were often married to men with higher educational attainment [5]. The educational attainment of their spouses would influence available resources potentially associated with their cancer mortality risk. Likewise, we see that married older persons in this study had generally the lowest cancer mortality risk also indicating a mutual support system that likely includes both instrumental (i.e., resources) and emotional support components moderating cancer risk. Future research attempting to disentangle these SES older-age-specific cancer mortality effects should be conducted.
These findings showed fluctuating (for both older men and women) all-cancer and cancer-specific relative mortality effects by language region. Although these may represent possible cultural differences (i.e., lifestyle, diet, family support, etc.) they require further consideration given the lack of difference seen in absolute rates in the companion paper. In principle, differences in absolute rates that result in differences in relative risks may have very different meaning (e.g., 2/100,000 PY and 1/100,000 PY as well as 20,000/100,000 PY and 10,000/100,000 PY give the same relative risk but do not have the same absolute population impact). This is further emphasised by modest differences in SMR but not strictly by language region (e.g., Fribourg, Lausanne, Neuchâtel, Sion, and Geneva all French-speaking). By considering both absolute and relative cancer mortality risks in older adults by a broad set of socio-demographic characteristics this study provides a uniquely robust population-based epidemiological analysis. This is noteworthy because cancer is disease of aging that disproportionately affects older adults and often results in considerable consequences not just for aging individuals but simultaneously for healthcare systems, families, and caregivers providing for their needs. Socio-demographic age-specific information exposes opportunities for tailored public health interventions aimed ultimately at reducing cancer burden in developed societies. See companion paper for discussion of smoking and lung cancer mortality risk.
International studies based on EUROCARE data (European population-based registration data including limited Swiss cantons) demonstrated that cancer survival varied by age; European older adults had nearly 60% higher relative risk of death compared to younger adults [39]. In addition and more disturbingly, an increasing all-cancer and cancer-specific survival gap in older adults in Europe was also observed [40]. Although none of these findings were evaluated by socio-demographic or other important age-related factors. Since age is considered the most important risk factor for cancer and is also associated with increasing comorbidity, co-existing diseases are of substantial concern in older populations [41]. Indeed, cancer patients 70 years and older have on average three comorbidities [41, 42]. Comorbidities can drastically impact diagnosis, treatment, and/or recovery from cancer. Older cancer patients are more often diagnosed at later or with unknown stage, more likely to be undertreated, and receive less disease information than younger cancer patients [43–47]. Also of concern is that older adults with late stage diagnosis and/or severe multiple comorbidities might be under counted (due to deaths from comorbidities) and also more likely to have poor prognosis (unable to tolerate aggressive therapy). Although our work (and others’) was unable to evaluate age and stage at diagnosis and comorbidity they are essential pieces of the cancer story in older adults that require additional epidemiological research. Population-based studies that can include other health-related information are essential.
This study has strengths and weakness similar to those reported in our companion paper. First, it encompassed a very large population-based sample of older Swiss adults permitting with statistical precision generalisability to the older population in Switzerland. Moreover, it is one of the few broad investigations of population-based cancer mortality risk that is specific to older adults, includes exact person time with long follow-up (up to 18 years), and explores gender-age-specific variations across a number of socio-demographic characteristics. Unfortunately, even though these analyses were adjusted for many socio-demographic characteristics we cannot rule out potential confounding and/or interaction by other unavailable factors (e.g., health, lifestyle, genetic). Future analyses are planned to include additional risk factor information to enhance these results and address at least some of the limitations due to unmeasured variables. Finally, our study was based on probabilistic linkage and subject to its associated limitations [48]. Nevertheless, previous evaluations of the SNC have shown linkage is most successful in adults older than 25 years and no indication of selection bias [16].
In summary, this comprehensive epidemiological evaluation provides additional needed information about the aging-cancer nexus in developed countries. These results can help to identify which groups of Swiss older adults are at greatest risk for cancer mortality. This can be useful for cancer control programmes, specifically targeting interventions, healthcare resources, and tracking cancer disparities over time. Although additional and continually updated epidemiologic exploration of these factors, their associations with cancer burden, and their influence on growing aging populations in Switzerland and other developed countries is required. Future work with consideration of stage of disease, treatments received, and comorbidity are essential.
| Supplementary table 1 Sensitivity analysis results comparing all-cancer mortality risk adjusted and unadjusted for unlinked deaths from 1991 through 2008 in older Swiss adults ≥65 years old. | ||||
| Characteristic | Gender | Category | HR (95% CI) unadjusted for unlinked deaths | HR (95% CI) adjusted for unlinked deaths |
| Education | Males | Compulsory or less Secondary education Tertiary education | 1.17 (1.15, 1.20) 1 0.76 (0.74, 0.78) | 1.15 (1.13, 1.18) 1 0.77 (0.75, 0.79) |
| Females | Compulsory or less Secondary education Tertiary education | 1.06 (1.03, 1.08) 1 0.93 (0.88, 0.98) | 1.05 (1.03, 1.08) 1 0.94 (0.90, 0.99) | |
| Nationality | Males | Swiss Non-Swiss | 1 0.93 (0.90, 0.96) | 1 0.97 (0.94, 1.00) |
| Females | Swiss Non-Swiss | 1 0.90 (0.86, 0.94) | 1 0.95 (0.90, 0.99) | |
| Marital status | Males | Single Married Widowed Divorced | 1.05 (1.00, 1.09) 1 1.13 (1.07, 1.19) 1.23 (1.18, 1.29) | 1.08 (1.04, 1.13) 1 1.12 (1.07, 1.18) 1.27 (1.21, 1.32) |
| Females | Single Married Widowed Divorced | 1.18 (1.12, 1.24) 1 1.15 (1.10, 1.20) 1.27 (1.21, 1.33) | 1.20 (1.15, 1.26) 1 1.18 (1.13, 1.23) 1.27 (1.21, 1.34) | |
| Language region | Males | German French Italian | 1 1.06 (1.04, 1.09) 1.13 (1.08, 1.18) | 1 1.08 (1.05, 1.10) 1.14 (1.10, 1.19) |
| Females | German French Italian | 1 0.95 (0.92, 0.98) 0.99 (0.94, 1.04) | 1 0.96 (0.94, 0.99) 1.01 (0.96, 1.06) | |
| CI = confidence interval; HR = hazard ratio. Based on multivariable Cox proportional hazard model adjusted for age, nationality, educational attainment, marital status, household type, religion, language region, urbanisation, calendar year, and ICD coding period. | ||||
| Supplementary table 2 Comparison of all-cancer mortality risk from 1991 through 2008 in older Swiss adults ≥65 years old using Cox proportional hazards and Poisson regression models. | ||||
| Characteristic | Gender | Category | HR (95% CI) Cox regression | IRR (95% CI) Poisson regression |
| Education | Males | Compulsory or less Secondary education Tertiary education | 1.15 (1.13, 1.18) 1 0.77 (0.75, 0.79) | 1.16 (1.13, 1.18) 1 0.77 (0.75, 0.79) |
| Females | Compulsory or less Secondary education Tertiary education | 1.05 (1.03, 1.08) 1 0.94 (0.90, 0.99) | 1.05 (1.03, 1.08) 1 0.94 (0.90, 0.99) | |
| Nationality | Males | Swiss Non-Swiss | 1 0.97 (0.94, 1.00) | 1 0.97 (0.94, 1.00) |
| Females | Swiss Non-Swiss | 1 0.95 (0.90, 0.99) | 1 0.95 (0.91, 0.99) | |
| Marital status | Males | Single Married Widowed Divorced | 1.08 (1.04, 1.13) 1 1.12 (1.07, 1.18) 1.27 (1.21, 1.32) | 1.08 (1.04, 1.13) 1 1.12 (1.07, 1.18) 1.27 (1.21, 1.32) |
| Females | Single Married Widowed Divorced | 1.20 (1.15, 1.26) 1 1.18 (1.13, 1.23) 1.27 (1.21, 1.34) | 1.20 (1.15, 1.26) 1 1.18 (1.14, 1.23) 1.27 (1.21, 1.34) | |
| Language region | Males | German French Italian | 1 1.08 (1.05, 1.10) 1.14 (1.10, 1.19) | 1 1.08 (1.05, 1.10) 1.14 (1.10, 1.19) |
| Females | German French Italian | 1 0.96 (0.94, 0.99) 1.01 (0.96, 1.06) | 1 0.96 (0.93, 0.99) 1.01 (0.96, 1.06) | |
| CI = confidence interval; IRR = incidence rate ratio; HR = hazard ratio. Models adjusted for age, nationality, educational attainment, marital status, language region, religion, household type, urbanisation, calendar year, and ICD coding period. | ||||
Acknowledgements:This manuscript contains original material not previously published and made possible with support from the members of the SNC Study Group: Felix Gutzwiller (Chairman of the Executive Board), Matthias Bopp and David Faeh (Zurich, Switzerland); Matthias Egger (Chairman of the Scientific Board), Kerri Clough-Gorr, Kurt Schmidlin, Adrian Spoerri,, and Marcel Zwahlen (Bern, Switzerland); Nino Kuenzli (Basel, Switzerland); Fred Paccaud (Lausanne, Switzerland); and Michel Oris (Geneva, Switzerland). We also thank the Swiss Federal Statistical Office, whose support made the SNC and these analyses possible.
1 World Health Organization (WHO) Cancer Mortality Database. In Edition World Health Organization 2011.
2 Chiolero A, Gervasoni JP, Rwebogora A, Mkamba M, Waeber B, Paccaud F, et al. Discordant prevalence of hypertension using two different automated blood pressure measurement devices: a population-based study in Dar es Salaam (Tanzania). Blood Press Monit. 2004;9:59–64.
3 Switzerland Statistics of Cancer Incidence 1984–2008. In Edition Zurich, Switzerland: National Institute for Cancer Epidemiology and Registration 2010.
4 Switzerland Statistics of Cancer Mortality 1984–2008. In: Edition Zurich & Neuchâtel, Switzerland: National Institute for Cancer Epidemiology and Registration & Swiss Federal Statistics Office 2010.
5 The population of Switzerland 2009. In: Edition Neuchâtel, Switzerland: Federal Department of Home Affairs, Swiss Federal Statistical Office 2010.
6 Robine JM, Paccaud F. Nonagenarians and centenarians in Switzerland, 1860–2001: a demographic analysis. J Epidemiol Community Health. 2005;59:31–7.
7 UNDATA. In: Edition United Nations Statistics Division 2011.
8 Parsons A, Daley A, Begh R, Aveyard P. Influence of smoking cessation after diagnosis of early stage lung cancer on prognosis: systematic review of observational studies with meta-analysis. BMJ. 2010;340:b5569.
9 Pallis AG, Fortpied C, Wedding U, Van Nes MC, Penninckx B, Ring A, et al. EORTC elderly task force position paper: approach to the older cancer patient. Eur J Cancer. 46:1502–13.
10 Ershler WB. Cancer: a disease of the elderly. J Support Oncol. 2003;1:5–10.
11 Levi F, La Vecchia C, Randimbison L. Cancer mortality in Switzerland, 1990–1994. Soz Praventivmed. 1997;42:37–54.
12 Levi F, Lucchini F, La Vecchia C. Trends in cancer mortality in Switzerland, 1980–2001. Eur J Cancer Prev. 2006;15:1–9.
13 Levi F, Lucchini F, Negri E, La Vecchia C. Trends in mortality from major cancers in the European Union, including acceding countries, in 2004. Cancer. 2004;101:2843–50.
14 Karim-Kos HE, de Vries E, Soerjomataram I, Lemmens V, Siesling S, Coebergh JW. Recent trends of cancer in Europe: a combined approach of incidence, survival and mortality for 17 cancer sites since the 1990s. Eur J Cancer. 2008;44:1345–89.
15 Bray F, Sankila R, Ferlay J, Parkin DM. Estimates of cancer incidence and mortality in Europe in 1995. Eur J Cancer. 2002;38:99–166.
16 Bopp M, Spoerri A, Zwahlen M, Gutzwiller F, Paccaud F, Braun-Fahrländer C, et al. Cohort Profile: the Swiss National Cohort – a longitudinal study of 6.8 million people. Int J Epidemiol. 2009;38:379–84.
17 Spoerri A, Zwahlen M, Egger M, Bopp M. The Swiss National Cohort: a unique database for national and international researchers. Int J Public Health. 2010;55:239–42.
18 Fair M. Generalized record linkage system – Statistics Canada’s record linkage software. Austrian J Stat. 2004;33:37–53.
19 Fellegi IP, Sunter AB. A theory of record linkage. J Am Stat Assoc. 1969;64:1183–210.
20 Proceedings of the 4th Stromboli Conference on Aging and Cancer, June 6–11, 2005, Sicily, Italy. Ann N Y Acad Sci. 2005;1057:1–571.
21 Renaud A. Methodology Report – Coverage Estimation for the Swiss Population Census 2000. In Edition Neuchâtel, Switzerland: Swiss Federal Statistical Office 2004.
22 Doria-Rose VP, Marcus PM. Death certificates provide an adequate source of cause of death information when evaluating lung cancer mortality: an example from the Mayo Lung Project. Lung Cancer. 2009;63:295–300.
23 Doria-Rose VP, Marcus PM, Miller AB, Bergstralh EJ, Mandel JS, Tockman MS, Prorok PC. Does the source of death information affect cancer screening efficacy results? A study of the use of mortality review versus death certificates in four randomized trials. Clin Trials. 2010;7:69–77.
24 Schmidlin K, Clough-Gorr KM, Spoerri A, Egger M, Zwahlen M. Impact of unlimited deaths and coding changes on mortaliry estimates in the Swiss national Cohort. BMC Public Med Inform Decis. Submitted.
25 Data Analysis and Statistcial Software (STATA). In: Edition 11.1. College Station, TX: StataCorp LP 2009.
26 ArcGIS. In Edition 10. Redlands, CA: ESRI 2010.
27 Lawson AB, Browne WJ, Vidal Rodeiro CL. Disease Mapping with WinBUGS and MLwiN. Chichester, UK: John Wiley & Sons Ltd 2003.
28 WinBugs. In: Edition 1.4. Cambridge, UK: 2003.
29 Spiegelhalter DJ, Myles JP, Jones DR, Abrams KR. Methods in health service research. An introduction to bayesian methods in health technology assessment. BMJ. 1999;319:508–12.
30 Fast Stats: An interactive tool for access to SEER cancer statistics. In Edition Bathesda, MD: National Cancer Institute.
31 Vercelli M, Capocaccia R, Quaglia A, Casella C, Puppo A, Coebergh JW. Relative survival in elderly European cancer patients: evidence for health care inequalities. The EUROCARE Working Group. Crit Rev Oncol Hematol. 2000;35:161–79.
32 Balducci L, Beghe C. Cancer and age in the USA. Crit Rev Oncol Hematol. 2001;37:137–45.
33 Yang L, Fujimoto J, Qiu D, Sakamoto N. Trends in cancer mortality in the elderly in Japan, 1970–2007. Ann Oncol 2009.
34 Levi F, Lucchini F, Negri E, Boyle P, La Vecchia C. Changed trends of cancer mortality in the elderly. Ann Oncol. 2001;12:1467–77.
35 Franceschi S, La Vecchia C. Cancer epidemiology in the elderly. Crit Rev Oncol Hematol. 2001;39:219–26.
36 Braaten T, Weiderpass E, Kumle M, Lund E. Explaining the socioeconomic variation in cancer risk in the Norwegian Women and Cancer Study. Cancer Epidemiol Biomarkers Prev. 2005;14:2591–7.
37 Mouw T, Koster A, Wright ME, et al. Education and risk of cancer in a large cohort of men and women in the United States. PLoS One 2008;3:e3639.
38 Albano JD, Ward E, Jemal A, Anderson R, Cokkinides VE, Murray T, et al. Cancer mortality in the United States by education level and race. J Natl Cancer Inst. 2007;99:1384–94.
39 Berrino F, Verdecchia A, Lutz JM, Lombardo C, Micheli A, Capocaccia R; EUROCARE Working Group. Comparative cancer survival information in Europe. Eur J Cancer. 2009;45:901–8.
40 Quaglia A, Tavilla A, Shack L, Brenner H, Janssen-Heijnen M, Allemani C, et al. The cancer survival gap between elderly and middle-aged patients in Europe is widening. Eur J Cancer. 2009;45:1006–16.
41 Extermann M. Interaction between comorbidity and cancer. Cancer Control. 2007;14:13–22.
42 Extermann M, Overcash J, Lyman GH, Parr J, Balducci L. Comorbidity and functional status are independent in older cancer patients. J Clin Oncol. 1998;16:1582–7.
43 Biganzoli L, Goldhirsch A, Straehle C, Castiglione-Gertsch M, Therasse P, Aapro M, et al. Adjuvant chemotherapy in elderly patients with breast cancer: a survey of the Breast International Group (BIG). Ann Oncol. 2004;15:207–10.
44 Chouliara Z, Kearney N, Stott D, Molassiotis A, Miller M. Perceptions of older people with cancer of information, decision making and treatment: a systematic review of selected literature. Ann Oncol. 2004;15:1596–602.
45 Gagliese L. Aging and the management of cancer pain. Ann Oncol. 2009;20:1752.
46 Giacalone A, Blandino M, Spazzapan S, Tirelli U. Cancer and aging: are there any differences in the information needs of elderly and younger patients? Results from an Italian observational study. Ann Oncol. 2005;16:1982–3.
47 Bouchardy C, Rapiti E, Blagojevic S, Vlastos AT, Vlastos G. Older female cancer patients: importance, causes, and consequences of undertreatment. J Clin Oncol. 2007;25:1858–69.
48 Herzog TN, Scheuren FJ, Winkler WE. Data quality and record linkage techniques. NewYork, New York: Springer 2007.
Funding / potential competing interests: This work was supported by funding from the Swiss National Science Foundation (grant number 3347C0-108806) and Oncosuisse (grant number OCS-02288-08-2008). The sponsors had no role in the design, methods, subject recruitment, data collection, analysis, or paper preparation. None of the authors has a conflict of interest.