Cost of acute coronary syndrome in Switzerland in 2008
DOI: https://doi.org/10.4414/smw.2012.13655
Simon
Wieser, Isabelle
Rüthemann, Sylvia
De Boni, Klaus
Eichler, Mark
Pletscher, Dragana
Radovanovic, Tanja
Ulle, Holger
Auerbach
Summary
QUESTIONS UNDER STUDY: To perform a cost-of-illness study of acute coronary syndrome (ACS) in Switzerland from a societal perspective, evaluating direct costs, production losses and intangible costs in terms of quality adjusted life years (QALYs) lost.
METHODS: A bottom-up incidence-based approach was used. Data concerning patients with one or more ACS events were extracted from a national hospital database and from mortality statistics. Inpatient costs included acute care and rehabilitation. Outpatient costs included costs for ambulance, visits to GP and cardiologist, outpatient diagnostics, medication and rehabilitation. Production losses included absenteeism, permanent disability and premature death. Intangible costs were calculated on previously published QALY weights. Cost data were derived from official price lists, literature and experts. Future costs and QALYs lost were discounted.
RESULTS: In 2008 14,955 patients experienced a total of 16,815 ACS events; 2,752 died as a consequence of these. The resulting 19,064 hospital stays had an average across-hospital length of stay of 9.1 days per patient. Total direct costs of ACS amounted to 630 Mio Swiss Francs (CHF) for society and CHF 462 Mio for health insurers. Total direct costs were dominated by costs of myocardial infarction: ST-elevation 45.8%, non-ST-elevation 35.8%. Production losses were CHF 519 Mio and intangible costs resulted in 49,878 QALYs lost.
CONCLUSIONS: ACS causes considerable costs in terms of direct medical expenditures, lost production, suffering and premature death, even without taking into account costs for its chronic consequences such as congestive heart failure.
|
Glossary of health economic terms (in part based on Berger et al. [1] and Culyer [2]).
|
| AP-DRG |
A prospective payment system for inpatient care based on diagnosis and type of treatments. In 2008 approximately one third of Swiss hospitals employed AP-DRG for reimbursement. |
| Bottom-up approach |
Analysis based on information on costs borne by single patients in a sample of the population or the total population. |
| Cost-of-illness (COI) study |
Measures the total economic burden of a disease as the maximum amount that could be saved if the disease were to be eradicated. |
| Direct medical costs |
Costs occurring in the medical treatment of patients. |
| Discounting |
Method to adjust future costs and benefits to their present value. |
| GDP (gross domestic product) |
Total market value of all final goods and services produced in a country in a given year. Corresponds to total domestic income. |
| Intangible costs |
Amount of suffering and life years lost because of a disease or a health care intervention. Intangible cost corresponds to QALYs lost. |
| Perspective |
Viewpoint adopted which defines the costs considered in a study. The societal perspective includes all costs regardless of who bears them. |
| Production losses* |
Ability of patients to be part of the active working population temporarily reduced or permanently lost due to a disease. Production losses correspond to income losses. |
| QALY (quality adjusted life year) |
Universal health outcome measure applicable to all diseases. A QALY combines gains and losses of quantity of life (mortality) and quality of life (morbidity) in a single measure. A life year in full health has a QALY value of 1. |
| Sensitivity analysis |
Analysis of the impact of uncertainty on the results of a study. |
| * These costs are sometimes also called indirect costs or income losses. We prefer the term “production losses” because it best describes the type of economic loss intended and because it is least prone to misunderstandings. The use of this terminology is also recommended in the latest edition of a widely used handbook on economic evaluations in health care [3]. |
List of abbreviations
ACS Acute coronary syndrome
AMI Acute myocardial infarction
AMIS Acute Myocardial Infarction in Switzerland
AP-DRG All Patient Diagnosis Related Groups
CHF Swiss Francs
COI Cause of Death Statistics (Todesursachenstatistik)
DeathStat T-cell receptor
EUR Euro
FSO Federal Office of Statistics (Bundesamt für Statistik)
GDP Gross domestic product
GP General practitioner
ICU Intensive care unit
MedStat Medical Statistics of Hospitals (Medizinische Statistik der Krankenhäuser)
MI myocardial infarction
Mio Million
NSTEMI Non-ST-elevation myocardial infarction
PCI Percutaneous coronary intervention
QALY Quality adjusted life year
STEMI ST-elevation myocardial infarction
UAP Unstable angina pectoris
WHO World Health Organisation
Introduction
Coronary heart disease is the main cause of death in the world and in middle- and high-income countries [4]. Acute coronary syndrome (ACS), namely unstable angina pectoris (UAP) and myocardial infarction (MI), is the most important clinical consequence of coronary heart disease.
Previous studies estimated direct costs and production losses of ischaemic heart disease in Switzerland in 1987 [5] and 1993 [6]. The results of these studies included the costs of ACS without examining them separately. Moreover, the pharmacological and interventional treatments of ACS have changed substantially over the past two decades [7–9]. For example, the rate of patients with percutaneous coronary interventions (PCIs) has increased considerably compared to thrombolysis. Furthermore, a more successful secondary prevention of ACS may have resulted from the establishment of new anti-thrombotic drugs, a rigorous lipid management with statins and new pharmacological smoking cessation therapies. In addition, the length of stay of patients has decreased in hospitals.
The economic impact of modern coronary reperfusion therapies, quicker access to therapies and shorter hospital stays have not been well assessed for Switzerland. One might assume rising direct medical costs for ACS patients driven by modern reperfusion therapies. From a societal perspective, however, this cost rise might be smaller than expected due to reduced downstream costs and higher quality of life. Thus, up-to-date cost of illness data can contribute valuable information.
As the current total costs of ACS in Switzerland are not known, we designed a cost-of-illness (COI) study of ACS from a societal and a health insurance perspective including direct medical costs, production losses and intangible costs. A COI study is a descriptive analysis assessing the economic burden of a disease on the population [10]. A COI study can provide comparative health economic evaluations of new treatments (e.g. cost-effectiveness and cost-utility studies) with important inputs on the cost consequences of the disease. Assessing the benefits of new treatments however is not part of a COI study.
Methods
The main objective of the study was the assessment of the cost-of-illness of ACS in Switzerland occurring in 2008 (the most recent year for which the data was available) with a bottom-up (person-based) approach. Costs of ACS include the follow-up costs of monitoring and medication for the remaining lifetime of surviving ACS patients. All ACS events (with the exception of heart failure) were considered whether they were repeat or initial events. However, the treatment of heart failure was not included as we did not want to assess the cost of atherosclerosis as a whole. Production losses were calculated to the patient’s expected age of retirement, and intangible costs were calculated on life expectancy.
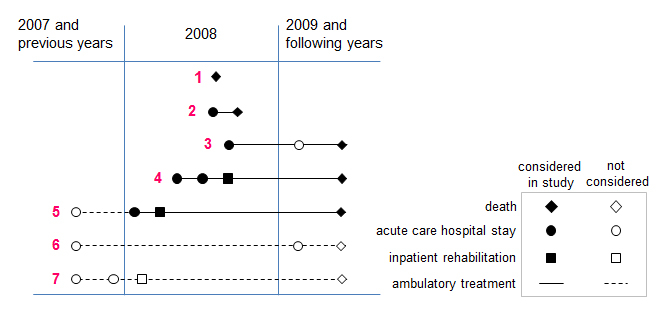
Figure 1
Overview of ACS events and outpatient treatments considered.
The figure gives an overview of ACS events occurring in 2008 and resulting treatments. All inpatient treatments in 2008 were considered as well as outpatient treatments from ACS in 2008 until death. Remaining life years of surviving patients were modelled on age, gender and life expectancy statistics adjusted by a factor for increased relative mortality risk after an ACS. Treatments considered in the study are represented by bold icons and continuous lines, treatments not considered by light icons and broken lines. The study did not consider inpatient care provided in 2009 and following years (example 3) or possible outpatient treatment before a 1st ACS event in 2008 (example 5).
Examples of sequences of ACS events:
1 – Death at 1st event in 2008 before reaching hospital.
2 – Hospital stay at 1st event in 2008 and death at 2nd event in 2008. Outpatient care between 1st event and death.
3 – Hospital stay at 1st event in 2008 and 2nd event in 2010 (not considered in study). Outpatient care until death.
4 – 1st event in 2008: Sequence of 2 hospital stays. Outpatient care until death.
5 – Hospital stay at 1st event in 2007 (not considered). Hospital stay at 2nd event in 2008. Outpatient care until 2nd event in 2008 not considered. Outpatient care until death.
6 – Hospital stay at 1st event in 2006 and 2nd event in 2009 (both not considered). Outpatient care from 1st event in 2006 until death in 2010 not considered.
The following sources were used to derive the relevant data: Patient numbers on hospitalisation and mortality, inpatient costs and information on production losses were provided by the Swiss Federal Office of Statistic [11–16]. They cover all patients or inhabitants in Switzerland. Patient numbers attending outpatient rehabilitation come from the Swiss ACS registry AMIS Plus [17]. Tariff data on cardiac rehabilitation are from the Swiss health insurer association [18]. Outpatient drug consumption was modelled according to AMIS plus registry data [17] and a German expert survey [19]. Use of other outpatient care resources was modelled according to the German survey [19] and adapted to the Swiss standard by expert interviews (a private practice general practitioner and a private practice cardiologists active in Winterthur, a mid-sized town in the German speaking part of Switzerland).
The number of ACS patients was calculated with an incidence-based approach consisting of two steps: 1) All patients with one or more ACS events were identified in the Medical Statistic of Hospitals (MedStat) [11] and the Cause of Death
Statistics(DeathStat) [12]. 2) Remaining life years were modelled on average life expectancy [13]. These two statistics cover all hospital stays and all deaths occurring in Switzerland and are thus highly representative. We assumed a factor for increased relative risk of mortality per year of 1.5 for the patients surviving an ACS. The all-cause mortality risk per year of 2% of a 68 year old man does for example increase to 3%. This assumption is based on studies exploring the survival rates of MI patients [20–25]. The consequences of variations of this assumption were tested in the sensitivity analysis (1.0 for same mortality risk as general population and 2.0 for twofold annual mortality risk).
Patients with ACS events were identified by their ICD-10 main diagnosis (UAP: I20.0; NSTEMI: I21.4; I21.9; I22.9; STEMI: I21.0; I21.1–3; I22.0–1; I22.8). Strokes which may occur as adverse events in the treatment of ACS were also considered (I60.1–9; I61.1–9; I62.0, 1,9; I63.1–9; I64) in patients with ACS as secondary diagnosis if the stroke event occurred during the ACS hospitalisation. According to the MedStat coding handbook [26], the diagnosis to be coded as main diagnosisin patients with several diagnoses is the diagnosis that required the largest amount of medical resources. As treatment of stroke requires more resources than treatment of ACS, ACS with stroke as a major complication should be coded with stroke as main diagnosis and ACS as a secondary diagnosis.
The distinction between ACS patients and hospital stays due to ACS is crucial in order to determine the true number of ACS patients, as single hospital stays in different hospitals are often part of the same ACS event. Fortunately, the MedStat makes it possible to attribute separate ACS events to a single patient. Figure 1 gives an overview of possible ACS events occurring in 2008 and subsequent treatments considered in this study.
Inpatient hospital costs were calculated by multiplying the number of AP-DRG cases [11] by the average costs of AP-DRG cases [14]. As AP-DRG cost weights do not cover total costs of hospitalisations (investments in hospital infrastructure and additional costs of patients with private and semi-private insurance coverage are not covered), we estimated a correction factor by dividing total AP-DRG costs by total costs of hospitalisations according to the Statistics on Costs and Financing of Health Care [27]. Cost of inpatient rehabilitation was calculated by multiplying the number of days of stay by the average daily tariff for cardiac rehabilitation [18].
Outpatient costs were costs incurred in 2008 as well as costs of surviving patients for the rest of their life. Costs leading to hospitalisation included transport by ambulance (van and helicopter [number and price of ambulance flights for patients with ACS were provided by Rega, Swiss Air Rescue, and are based on the Rega statistics for 2008. Costs of transport by ambulance van are based on sample invoices and interviews with the emergency services of the Zurich metropolitan area; Schutz und Rettung Zürich]) and the emergency services of the cantonal hospital of Winterthur (the second city in the canton of Zurich). The representativeness of these costs for the whole of Switzerland was verified by an expert of the national confederation of emergency services (Interverband für Rettungswesen)) and visits to a general practitioner (GP) or cardiologist. Costs after hospital discharge included visits to GPs and cardiologists, diagnostic interventions, medication and outpatient rehabilitation. The number of GP and cardiologist visits and annual ECGs was assessed in expert interviews. Types of drugs used were derived from a German Study [19]. The proportion of STEMI, NSTEMI and UAP patients who use these drugs was obtained from the AMIS plus registry [17]. Daily doses were assumed to be WHO defined daily doses [28]. A cardiologist and a GP gave advice on the selection of products for each type of drugs. The number of patients in outpatient rehabilitation programmes was based on AMIS Plus [17]. Prices of outpatient services were obtained from official price lists and through direct inquiry to service providers [18, 29, 30].
Production losses included absenteeism (temporary absence from work), permanent disability and premature death and the data were derived from relevant databases from the Swiss Federal Statistic Office as referenced. Losses were calculated for individuals of working age and considered degree of labour force participation [15], activity level [15] and median gross salary [16]. Production losses due to absenteeism were estimated on the basis of a previous Swiss study [5] and three studies carried out in similar countries [31–33]. Production losses due to permanent disability were estimated on the basis of statements by a cardiologist working centre specialised in medical examinations for the Swiss Disability Insurance Fund and a private practice cardiologist.
Intangible costs were calculated on the basis of the number of individuals affected by ACS (by age, gender, surviving or not) using quality of life weights of cardiovascular diseases recently estimated for England [34].
Future costs and QALY losses were discounted to present value at a 2% rate corresponding to the real interest rate on long term Swiss government bonds over the past 20 years [35, 36]. An extreme value sensitivity analysis was carried out with regard to the lower and upper bounds of prices and the discount rate.
Results
Number of patients with ACS events and type of ACS event
Table 1 gives an overview of the number of ACS events in 2008 by type of ACS event and sequence of hospital stays of patients. According to MedStat data a total of 13,231 patients had at least one hospital stay, including 102 patients with stroke as the primary diagnosis and ACS as the secondary diagnosis. A total of 2,752 patients died due to ACS according to DeathStat data. To avoid double counting we subtracted 1,028 patients who died in the course of a hospital stay and are thus included in the MedStat as well as in the DeathStat. This lead to a total number of 14,955 individuals who suffered from ACS in 2008. The 13,231 patients with at least one hospital stay had a total of 19,064 inpatient stays.
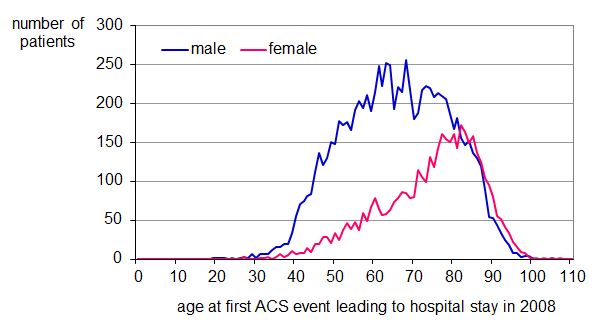
Figure 2
Age at ACS event leading to hospital stay in 2008. Own calculation on the basis of MedStat [11].
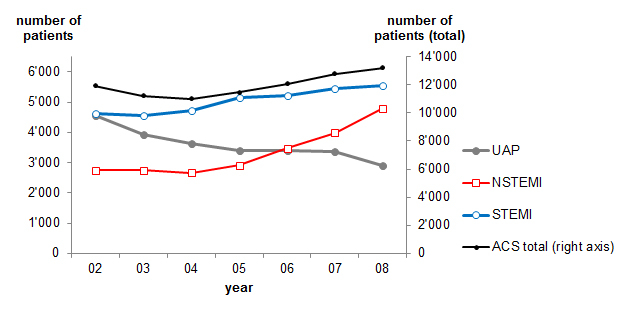
Figure 3
Average length of stay in acute care by single stay and by patient (2002–2008).
Own calculation on the basis of MedStat [11]. Average length of stay per patient is higher than average length of single stays as many patients have multiple stays in the course of their ACS treatment (e.g. when a patient is transferred from one hospital to another for specialised care).
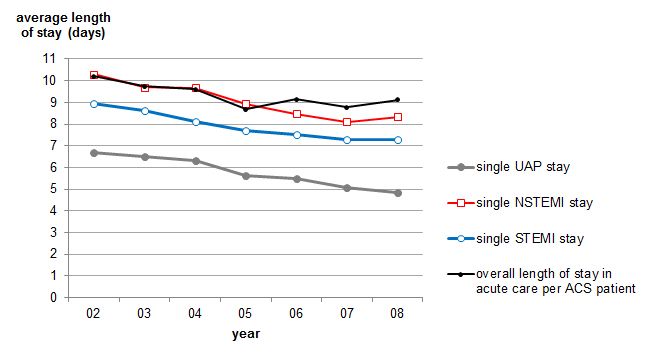
Figure 4
Number of ACS patients by main diagnosis at first hospital stay per year (2002–2008). Own calculation on the basis of MedStat [11].
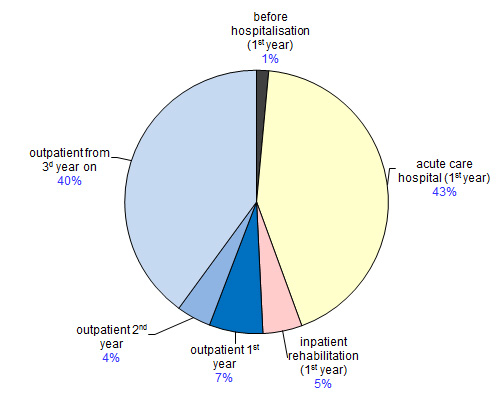
Figure 5
Total direct cost of ACS in Switzerland in 2008 – societal perspective (%). Own calculation on the basis of a variety of sources.
Figure 2 shows the age of patients treated in hospital. From the total number of patients, 8,885 were men (67.2%) and 4,346 were women (32.8%). The mean age was 68.4 years for the hospitalised patients (men 65.6, women 74.2) and 79.3 years for those who died in hospital (men 76.8, women 82.1). The mean age of all deaths was 77.9 years (men 74.3, women 82.8).
Table 2 shows the evolution of the number of patients in acute hospital care by type of ACS from 2002 to 2008 according to MedStat. The total number of patients increased by 10.9%, with UAP patients decreasing by 36.8% and NSTEMI patients increasing by 75.1%. These changes were probably due to the introduction of more accurate diagnostic procedures.
Figure 4 shows the evolution of the average length of stay of single acute care hospital stays and across-hospital length of stay by single ACS patients in a given year from 2002 to 2008 according to MedStat. Average across-hospital length of stay was higher than the average length of single stays as many patients have multiple stays in the course of their treatment, for example when a patient is transferred from one hospital to another for specialised care. While the average length of a single stay decreased by nearly 2 days in these 7 years (UAP: –1.8 days, NSTEMI –1.94 and STEMI –1.69) the average across-hospital length of stay decreased by only 1.08 days. This difference was probably due to an increased cooperation between hospitals in the treatment of ACS patients.
Figure 5 shows in-hospital mortality due to ACS per hospital stays and patients. As expected, mortality per patient increased with severity of ACS from 1.39% for UAP patients to 9.64% for STEMI patients. Mortality rates per patient were substantially higher than mortality rates per stay.
The average life expectancy for surviving patients was reduced by 2.8 years for men and by 2.3 years for women due to the increased relative risk of mortality (average age of survivors: men 64.8 years, women 73.3 years; average expected remaining life years: men 15.6 years, women 12.9 years).
Direct costs
The average length of hospital stays was 4.8 days for UAP patients, 8.3 days for NSTEMI patients, 7.3 days for STEMI patients and 7.19 days for all ACS patients (table 3). Considering the sequence of stays in different hospitals that may be part of a same treatment sequence, the average length of stay per patient was 5.6 days for UAP patients, 10.7 days for NSTEMI patients, 9.7 days for STEMI patients and 9.12 days for all ACS patients. Average hours in intensive care unit (ICU) per patient ranged from 7.0 hours for UAP patients to 26.3 hours for STEMI patients.
Inpatient hospital costs were calculated by multiplying the number of ACS patients associated to single AP-DRG codes by the average costs of these AP-DRG cases [14] (an example: 1,729 NSTEMI stays are linked to the AP-DRG code number 122 for “circulatory disturbance with acute MI without cardiovascular complications, without fatal consequences” according to MedStat data 2008. The average cost-weight of AP-DRG code number 122 is CHF 8,999 [14]. By multiplying the number of AP-DRG cases by their average cost weight we obtain an inpatient treatment cost of CHF 15,559,721 for these NSTEMI patients). The resulting CHF 230 Mio was multiplied by a factor of 1.173. The factor is calculated by dividing total acute care hospital cost (without psychiatric and rehabilitation clinics) of CHF 13,739 Mio according to FSO [27] by total acute care hospital treatment cost of CHF 11,711 Mio calculated with the AP-DRG weights provided by FSO [14] and the total cost of inpatient acute care thus amounted to CHF 270 Mio.
A total of 2,249 inpatient rehabilitation stays with an average length of stay of 22.5 days were recorded in MedStat. The resulting 50,577 inpatient days were multiplied by the average costs of cardiac rehabilitation (CHF 565 for basic, CHF 659 for semi-private and CHF 748 for private insurance) according to relative weights of the insurance coverage of the patients retrieved from MedStat. The total cost of inpatient rehabilitation amounted to CHF 30 Mio.
A total of 4,115 patients (21.6%) reached the hospital by ambulance and 6,739 (35.3%) had a previous emergency GP or cardiologist visit. A total of 509 helicopter flights were carried out for ACS patients. Prices were CHF 1,618 for ambulance transport, CHF 3,752 for a helicopter ambulance flight and CHF 237 for a typical GP or cardiologist visit prior to hospitalisation.
As MI patients usually need more post-hospital care than UAP patients, costs were calculated separately based on the information contained in table 4.
Table 5 gives an overview of daily doses, daily prices and percentages of the patients taking the drugs and the respective sources. Total drug costs per patient amounted to CHF 1,367 (UAP), CHF 1,385 (NSTEMI) and CHF 1,459 (STEMI) in the first year after the ACS event and to CHF 1,422 (UAP), CHF 1,441 (NSTEMI) and CHF 1,518 (STEMI) from the second year on (drug prices 1 May 2011).
Total direct costs of ACS amounted to CHF 630 Mio.
Table 6 and figure 5 give an overview of the composition of costs by type of costs and perspective. Inpatient and outpatient costs each represent approximately half of total direct costs. Social and private health insurance covers CHF 462 Mio or 73% of total costs.
Table 7 shows the structure of total direct costs and average direct costs per patient over the three ACS event types. Average direct costs per patient amounted to CHF 47,589 and varied between CHF 40,207 for UAP patients and CHF 52,135 for STEMI patients. These costs can be interpreted as direct costs potentially avoided by an intervention preventing an ACS event.
|
Table 1: Number of patients with ACS and number of inpatient stays due to ACS in 2008.
Own calculation on MedStat [11] and DeathStat [12]. The table on the left shows all hospital and inpatient rehabilitation stays in 2008. Many patients experience multiple stays in the course of ACS treatment (e.g., transfer to other hospital or rehabilitation clinic). A total of 4,294 patients had, for example, 2 or more stays. No patient has a rehabilitation stay as first treatment, as inpatient rehabilitation stays due to ACS can only be identified if preceded by a hospital stay in the same year.
The table on the right shows the calculation of the total number of patients with at least one inpatient treatment. The 1,028 patients deceased in hospital have to be subtracted in order to avoid double counting. |
|
Sequence
of stay
|
UAP
|
NSTEMI
|
STEMI
|
Rehab
|
Total
|
Calculation of total number of patients with ACS
|
| 1 |
2,884 |
4,818 |
5,529 |
|
13,231
|
13,231 |
Total of patients with at least one ACS event according to MedStat. |
| 2 |
341 |
1,067 |
1,427 |
1,459 |
4,294 |
| 3 |
60 |
213 |
330 |
605 |
1,208 |
–1,028 |
Of which died in hospital (MedStat) |
| 4 |
19 |
43 |
50 |
152 |
264 |
2,752 |
Number of fatalities due to ACS (DeathStat). |
| 5 |
6 |
10 |
8 |
24 |
48 |
| 6 |
3 |
4 |
1 |
4 |
12 |
14,955
|
Patients with at least one ACS
event in 2008 |
| 7 |
|
1 |
|
3 |
4 |
| 8 |
|
1 |
|
1 |
2 |
| 9 |
|
|
|
1 |
1 |
| Total |
3,313 |
6,157 |
7,345 |
2,249 |
19,064
|
|
Table 2: In-hospital mortality due to ACS in 2008 (per stays and per patient).
Own calculation on MedStat [11]. In-patient hospital stays include at least 1 night spent in hospital. Deaths occurring in the emergency room are thus excluded from this number.184 patients died during the first day of stay.
Mortality rates differ significantly if calculated per number of stays or number of patients. |
|
Dimension
|
UAP
|
NSTEMI
|
STEMI
|
Rehab
|
Total
|
| Number of deaths |
40 |
432 |
533 |
23 |
1,028 |
| Number of stays |
3,313 |
6,157 |
7,345 |
|
16,815 |
| Number of patients |
2,884 |
4,818 |
5,529 |
|
13,231 |
| Mortality stays (%) |
1.21 |
7.02 |
7.26 |
|
6.11 |
| Mortality patients (%) |
1.39 |
8.97 |
9.64 |
|
7.77 |
|
Table 3: Average length of stay in acute care hospital and average hours in ICU of ACS patients in 2008 (per stay and per patient).
Own calculation on MedStat [11]. Length of stay differs significantly if calculated per number of stays or number of patients. |
| |
UAP
|
NSTEMI
|
STEMI
|
all ACS
|
|
Average number of days of inpatient care
|
|
|
|
|
| Per stay |
4.85 |
8.35 |
7.27 |
7.19 |
| Per patient |
5.57 |
10.65 |
9.64 |
9.12 |
|
Average number of hours of ICU care
|
|
|
|
|
| Per stay |
6.06 |
14.41 |
19.78 |
15.11 |
| Per patient |
6.97 |
18.43 |
26.28 |
19.21 |
|
Table 4: Outpatient resource use after hospital discharge. |
| |
Quantity
|
Price (CHF)
|
Source of information
|
|
UAP
|
NSTEMI
|
STEMI
|
|
|
Number of patients
|
Leaving hospital alive |
2,844 |
4,386 |
4,996 |
MedStat [11] |
| Alive 1 year after event |
2,702 |
4,098 |
4,959 |
MedStat [11], own calc. |
|
Outpatient services
(frequency of use and share of patients
using service) |
GP visit after hospitalisation(including diagnostic tests) |
100% of pat
3 in 1st year
1 from 2nd year on |
236.29
per visit |
[19], expertsa
|
|
Cardiologist visit after hospitalisation
b (including diagnostic tests) |
80% of pat |
623.88
per visit |
[19], expertsa
|
| 1 in 1st year
1 in 2nd year
0.5 from 3d year on |
1.5 in 1st year
1 in 2nd year
0.5 from 3d year |
|
Longtime-ECG
c
|
1 in 1st year (20% of pat)
1 in 2nd year (5% of pat) |
1 in 1st year (30% of pat)
1 in 2nd year (20% of pat)
1 from the 3d year on (10% of pat) |
225.84
per ECG |
[19], expertsa
|
|
Outpatient
rehabilitation
|
10.4% of pat |
19.6% of pat |
17.6% of pat |
2,700 per package |
AMIS Plus registry [17] |
|
Outpatient heart-groups
d (lifelong outpatient heart group) |
5% of pat |
10% of pat |
799.15
per year |
Expertsa, e
|
|
Drugs
|
See table 5 |
| pat = patients; a interviews on typical outpatient treatment patterns were carried out with a private practice cardiologist and private practice general practitioner in Winterthur, a mid-sized town in the German speaking part of Switzerland; b cardiologist is additional to GP; c longtime-ECG is additional to GP and cardiologist; d outpatient rehabilitation programmes are usually offered in packages of 36 training sessions over 6 to 12 weeks (Ambulante Herzrehabilitation Zürich, Klinik Gais (Appenzell), Spital Männedorf, Herz Zentrum Hirslanden; Zürich); e interview with the “Heart Group Team” of the Swiss Heart Foundation. |
|
Table 5:Medication after an ACS event.
Own calculation on the basis of AMIS Plus data [17], list of pharmaceutical specialties [35] and WHO Collaborating Centre for Drug Statistics Methodology [17]. Drug prices 1st of May 2011. |
|
Drug; price per package
|
Patients
taking
medicine (%)
|
WHO defined daily dose (mg)
|
Price per daily dose (CHF)
|
| Beta Blocker
Metoprolol-Mepha ZOK 100 mg; 100 depotabs, CHF 40.1
Metoprolol-Mepha ZOK 50 mg; 100 depotabs, CHF 28.2 |
79.2 |
150 |
0.60 |
| ACE Inhibitor
Accupro 10; 100 tablets (divisible), CHF 46.90 |
64.5 |
15 |
0.70 |
| ATII-Antagonist
Cosaar 50; 98 tablets (divisible), CHF 111.10 |
15.4 |
50 |
1.13 |
| Statins
Simvastin-Mepha Lactab 20; 100 tablets (divisible), CHF 97.20 |
91.7 |
30 |
1.46 |
| Platelet aggregation inhibitor
Plavix 75; 84 tablets, CHF 140.90 |
84.2 |
75 |
1.68 |
| Platelet aggregation inhibitor, Cox-1/Cox-2 Inhibitor
Aspirin Cardio 100; 100 tablets, CHF 16.15 |
96.0 |
100 |
0.16 |
|
Table 6:Total direct cost of ACS occurring in Switzerland in 2008 (CHF).
Own calculation, present value of future costs calculated at 2% discount rate. |
| |
Societal perspective
|
Health insurance perspective
|
| CHF |
% of total |
Social
insurance |
Private insurance |
Total |
|
Outpatient before hospital
|
|
|
|
|
|
| Ambulance |
7,743,988 |
1.2 |
2,899,636 |
1,507,811 |
4,407,447 |
| Consultation GP |
1,595,930 |
0.3 |
1,595,930 |
|
1,595,930 |
| Total |
9,339,918 |
1.5 |
4,495,566 |
1,507,811 |
6,003,376 |
|
Inpatient cost
|
|
|
|
|
|
| Acute care hospital |
270,344,657 |
42.9 |
96,896,030 |
24,722,106 |
121,618,136 |
| Inpatient rehabilitation |
30,285,424 |
4.8 |
12,870,231 |
1,684,854 |
14,555,085 |
| Total |
300,630,081 |
47.7 |
109,766,261 |
26,406,960 |
136,173,221 |
|
Outpatient after hospital
|
|
|
|
|
|
| 1st year |
41,484,489 |
6.6 |
41,268,121 |
216,368 |
41,484,489 |
| 2nd year |
26,650,997 |
4.2 |
26,432,912 |
218,085 |
26,650,997 |
| From 3rd year on |
251,542,174 |
39.9 |
249,172,280 |
2,369,894 |
251,542,174 |
| Total |
319,677,660 |
50.8 |
316,873,313 |
2,804,347 |
319,677,660 |
|
Total direct costs
|
629,647,658
|
100.0
|
431,135,140
|
30,719,118
|
461,854,258
|
|
Table 7: Total direct cost and average direct cost over ACS event types (CHF).
Own calculation, present value of future costs calculated at 2% discount rate. |
| |
UAP
|
%
|
NSTEMI
|
%
|
STEMI
|
%
|
Total
|
%
|
|
Outpatient before hospital
|
|
|
|
|
|
|
|
|
| Ambulance |
1,006,812 |
0.9 |
2,907,524 |
1.3 |
3,829,651 |
1.3 |
7,743,988 |
1.2 |
| Consultation GP |
278,398 |
0.2 |
593,553 |
0.3 |
723,978 |
0.3 |
1,595,930 |
0.3 |
| Total |
1,285,211
|
1.1 |
3,501,077
|
1.6
|
4,553,630
|
1.6
|
9,339,918
|
1.5
|
|
Inpatient cost
|
|
|
|
|
|
|
|
|
| Acute care hospital |
34,279,245 |
29.6 |
105,270,223 |
46.7 |
130,795,189 |
45.4 |
270,344,657 |
42.9 |
| Inpatient rehabilitation |
7,263,405 |
6.3 |
10,831,393 |
4.8 |
12,190,626 |
4.2 |
30,285,424 |
4.8 |
| Total |
41,542,649
|
35.8
|
116,101,616
|
51.5
|
142,985,816
|
49.6
|
300,630,081
|
47.7
|
|
Outpatient after hospital
|
|
|
|
|
|
|
|
|
| 1st year |
8,362,428 |
7.2 |
15,440,700 |
6.8 |
17,681,361 |
6.1 |
41,484,489 |
6.6 |
| 2nd year |
9,244,059 |
8.0 |
11,557,848 |
5.1 |
5,849,090 |
2.0 |
26,650,997 |
4.2 |
| From 3rd year on |
55,523,096 |
47.9 |
78,836,220 |
35.0 |
117,182,858 |
40.7 |
251,542,174 |
39.9 |
| Total |
73,129,582
|
63.1
|
105,834,768
|
46.9
|
140,713,309
|
48.8
|
319,677,660
|
50.8
|
| Total direct costs |
115,957,443
|
18.4 |
225,437,461
|
35.8 |
288,252,754
|
45.8 |
629,647,658
|
100.0 |
|
Average cost per patient
|
|
|
|
|
|
|
|
|
| Overall |
40,207 |
|
46,791 |
|
52,135 |
|
47,589 |
|
| In 1st year |
17,750 |
|
28,029 |
|
29,883 |
|
26,563 |
|
Production losses
In 2008 427 individuals died due to ACS before reaching retirement age (369 men, 58 women). The average number of years to retirement was 9.63 years. The total number of 1,656 full time equivalent work years lost corresponded to a total loss due to premature death of CHF 312 Mio.
A total of 5,149 individuals below retirement age survived an ACS event (4,194 men, 955 women). Based on four studies [5; 31–33] we estimated that on average 3 months of work were lost by economically active survivors. Resulting total losses due to absenteeism amounted to CHF 79 Mio.
Based on information from cardiologists we estimated that 5% of the surviving patients were affected by permanent disability and that the average degree of disability was 60%. Production losses for an estimated 151 patients with permanent disability were CHF 128 Mio.
Total production losses thus amounted to CHF 519 Mio at present value.
Intangible costs
ACS led to 2,752 deaths in 2008. The 12,203 patients surviving an ACS also faced an increased relative risk of mortality of 1.5. Inserting information on age, gender and life expectancy of these individuals in the equation on QALY weights proposed by Ara and Brazier [34], we obtained a total of 36,438 QALYs lost due to premature death (19,950 QALYs for death due to ACS in 2008,16,488 QALYs for increased mortality in remaining life years).
Ara and Brazier [34] also estimate a 0.395 QALY loss for the first year after a MI and a QALY loss of 0.090 if more than 12 months have passed since the event. As QALY weight after UAP is not specified, we used the same values as for MI patients. Applying these values to the patients surviving an ACS we obtained a loss of 13,440 QALYs due to reduced quality of life.
Total intangible costs in terms of life years lost and quality of life lost thus amounted to 49,878 QALY at present value.
Sensitivity analysis
The results of the sensitivity analysis showed that our estimation of the direct costs of ACS is robust to variations of the assumed prices, the interest rate and the factor for increased relative risk of mortality after ACS. Table 8 shows that the results change by –11% or +14% when varying prices to the lower or upper bound of the mean cost of AP-DRGs and the lower or upper bound of the prices calculated for single health care resources. Results change to +8% or –6% when changing the discount rate to 0% or 4% instead of the 2% of the base scenario. Assuming a factor for increased relative risk of mortality after ACS of 1.0 instead of 1.5 increases direct costs by 7% as surviving patients live longer and thus have more years with outpatient follow-up costs. A relative risk factor to 2.0 leads to a 5% decrease in costs.
Discussion
We assessed the costs of ACS in Switzerland in 2008 from a societal and health insurance perspective with a bottom-up incidence-based approach. To our knowledge, this study provides the first estimate of the total costs of ACS in Switzerland. Total direct costs amounted to CHF 630 Mio for the society and CHF 462 Mio for health insurers. Production losses amounted to CHF 515 Mio and intangible costs to 49,878 QALYs lost. Average total direct costs and production losses per patient were CHF 86,813. Results appear robust in the sensitivity analysis.
In a prevalence based COI study of ischaemic heart disease, Sagmeister et al. [6] estimated direct costs of CHF 14.6 Mio and production losses of CHF 16.7 Mio per 100,000 individuals for Switzerland in 1993 (Sagmeister et al. [6] report mean direct costs of USD 9.9 Mio and production losses of USD 11.3 Mio per 100,000 individuals calculated at an exchange rate of 1.4776 CHF/USD). Extrapolating from these numbers to the total population in 2008 we obtained direct costs of CHF 1,124 Mio and production losses of 1,286 Mio. A direct comparison of these results is not possible, as these studies do not cover exactly the same illnesses and costs are not adjusted for inflation. A study by Bramkamp et al. [37] based on AMIS Plus data between 1997 and 2005 estimates inpatient costs of ACS patients at CHF 18,757 (Bramkamp et al. [37] report a mean cost of EUR 12,101 calculated at an exchange rate of 1.55 CHF/EUR) per hospital stay while in our study hospitalisation costs amounted to CHF 16,078 per ACS hospital stay (CHF 17,484 per MI hospital stay).
A comparison with gross domestic product (GDP) and total healthcare expenditure is useful to understand the magnitude of costs. As our study estimates the lifetime costs of patients with an ACS occurring in 2008, which include costs incurring in the subsequent years, these costs cannot be directly compared with total healthcare costs in 2008. However, a comparison with current health care costs can be made under the assumption that the composition of ACS events determined for 2008 (fig. 1) is similar to the composition of ACS events in the years before 2008. Under this assumption the outpatient costs for ACS patients in 2008 for patients with their first ACS event before 2008 are represented by the future costs of patients with a first ACS event in 2008. As the future costs are reinterpreted as current costs, they must not be discounted and total direct costs thus amount to CHF 683 Mio in 2008 (table 8). In this prevalence-based estimate, the direct costs of ACS thus amount to 1.17% of total health expenditures in Switzerland [27]. The undiscounted sum of total direct costs and total productivity losses amount to CHF 1,247 Mio and correspond to 0.23% of Swiss GDP in 2008 (undiscounted production losses amounted to CHF 563 Mio).
|
Table 8: Results of sensitivity analysis on direct costs.
Assumed factor for increased relative risk of mortality: 1.5; assumed discount rate: 2%. |
|
Direct cost in Mio. CHF
|
|
Deviation from base scenario (%)
|
| |
Price scenario |
|
|
Price scenario |
| Low |
Base |
High |
|
|
Low |
Base |
High |
| Discount rate |
0% |
606 |
683 |
785 |
Discount rate |
0% |
–4% |
8% |
25% |
| 1% |
582 |
654 |
749 |
1% |
–8% |
4% |
19% |
| 2% |
561 |
630 |
720 |
2% |
–11% |
0% |
14% |
| 3% |
543 |
608 |
694 |
3% |
–14% |
–3% |
10% |
| 4% |
527 |
590 |
672 |
4% |
–16% |
–6% |
7% |
|
Direct cost in Mio. CHF
|
|
Deviation from base scenario (%)
|
| |
Price scenario |
|
Price scenario |
| Low |
Base |
High |
Low |
Base |
High |
| RR |
1.0 |
600 |
676 |
776 |
RR |
1.0 |
–5% |
7% |
23% |
| 1.5 |
561 |
630 |
720 |
1.5 |
–11% |
0% |
14% |
| 2.0 |
534 |
598 |
681 |
2.0 |
–15% |
–5% |
8% |
| RR = factor for increased relative risk of mortality. |
Comparison with similar cost studies in similar countries
Our results are in a similar range to the costs of ACS in other European countries. According to Taylor et al. [38] direct costs for the treatment of ACS corresponded to 1.41% of health expenditures in Germany, 1.96% in the UK, 0.73% in France and 2.54% in Italy in 2004. Brüggenjürgen et al. [19] estimated total yearly costs of MI patients in Germany in 2004 at EUR 11,672 per patient (18,015 CHF at 2004 exchange rate). A recent study by Kanichay et al. [39] estimated costs of ACS at 0.45% of health expenditure in France, 1.25% in Italy and 0.41% in the UK in 2009. These costs do not include outpatient consultations. Average costs per hospitalisation due to MI are calculated to be CHF 8,995 in France and CHF 7,627 in Italy (calculated at 1.509 CHF/EUR rate). These costs do not include costs for expensive drugs and medical procedures and represent a lower bound of hospital treatment costs of ACS. Kanichay et al. [39] estimated productivity losses due to ACS in 2009 as percentage of GDP at 0.07% in France, 0.09% in Italy and 0.22% in UK. These estimates are in the same order of magnitude as our estimate of productivity losses at 0.1% of Swiss GDP.
Strengths and limitations
The first strength of the study is the accurate distinction between the number of hospital stays due to ACS and the number of patients hospitalised due to ACS. Although the treatment of a single ACS event is frequently composed of a sequence of hospitalisations, the number of hospitals stays due to ACS is often considered equivalent to the number of patients with an ACS event. An example is the number of 15,404 MI patients in 2008 calculated by the Swiss Health Observatory (200 MI cases per 100,000 residents adjusted to population of 7.7 Mio in 2008) [40] which is considerably higher than our calculation of 12,103 MI patients in 2008 (10,347 MI patients according to MedStat [sum of NSTEMI and STEMI patients in first line of table 1] minus 965 in-hospital deaths of MI patients according to MedStat plus 2,721 death due to MI according to DeathStat). As a consequence of the lower number of patients we also obtained considerably higher in-hospital mortality rates of ACS patients. While the in-hospital mortality rate is 4.8% for NSTEMI patients and 6.9% for STEMI patients according to AMIS Plus data [17], we calculated in-hospital mortality rates of 9.0% for NSTEMI patients and 9.6% for STEMI patients (see). This higher mortality may also be due to the higher average age of the MedStat population (NSTEMI: 71.1 years, STEMI: 66.3 years) in comparison with the average age of the AMIS Plus population (NSTEMI: 67.2 years, STEMI: 64.5 years). The more accurate distinction between number of hospital stays due to ACS and patients hospitalised leads to higher costs per patient as multiple hospital stays are now correctly assigned to the same patient. A second strength is the accurate use of all publicly available data in Switzerland to take account of the costs of ACS in different cost categories and from a societal and a health insurance perspective.
Several limitations have to be mentioned. First, we did not include follow-up costs of heart failure due to coronary heart disease, as this was not the specific focus of our study. Even though heart failure can also be caused by other underlying diseases, such as hypertension or myocarditis, coronary heart disease is the most important reason for chronic myocardial dysfunction. Much research has been done concerning the economic consequences of heart failure and the costs are estimated to be in a range of 2% to 4% of total health care expenditures in developed countries [3]. A recent study of the burden of ACS in Europe discussed this topic and decided not to quantify these costs [36]. The reported costs of ACS in our study are thus a conservative estimate. Second, we have no direct estimate to guess the coding quality of the public databases used. It is well known, for example, that death certificates often have limited quality concerning the documented disease leading to death. However, in the absence of more valid data, use of death certificates or publicly available hospital statistics is an accepted information source for cost-of-illness studies. Third, some of the costs of ACS were not considered, such as the assistance of family and friends.
Conclusion
The main results of this study are an accurate description of the structure of hospitalisation and treatment sequences of patients with ACS and a detailed calculation of the considerable costs of ACS in terms of direct medical expenditures, lost production and premature death, even without taking into account costs for its chronic consequences such as congestive heart failure. These results may serve as a basis for health policies and as an input for health economic models of cost effectiveness of new treatments of ACS.
Acknowledgement: The authors thank two anonymous reviewers for their helpful comments and the clinicians and institutions who supported this study with information on prices, treatments and costs (AMIS Plus registry, Ambulanzdienst Kantonsspital Winterthur, Federal Office of Statistics, Interverband für Rettungswesen, Klinik Gais, Rheinburg-Klinik Walzenhausen, Schutz und Rettung Zürich, Swiss Air Rescue, Swiss Heart Foundation, Verband Zürcher Krankenhäuser). Special thanks to Bruno Horisberger for his particularly helpful scientific advice and recommendations.
References
1 Berger M, Bingefors K, Hedblom E, Pashos C, Torrance G, editors. Health care cost, quality and outcomes – ISPOR book of terms: International Society for Pharmacoeconomics and Outcome Research; 2003.
2 Culyer AJ. The dictionary of health economics: Edward Elgar; 2005.
3 Drummond M, Sculpher M, Torrance G, O’Brien B, Stoddart G. Methods for the economic evaluation of health care programmes. 3d ed: Oxford University Press; 2005.
4 WHO. The top 10 causes of death. Geneva: World Health Organization; 2008.
5 Sagmeister M, Horisberger B, Gessner U, Gutzwilller F, Wietlisbach V. The costs of ischaemic heart disease in Switzerland. Int J Health Sciences. 1990;1(1):5–16.
6 Sagmeister M, Gessner U, Oggier W, Horisberger B, Gutzwilller F. An economic analysis of ischaemic heart disease in Switzerland. Eur Heart J. 1997;18(7):1102–9.
7 Fox KAA, Steg PG, Eagle KA, Goodman SG, Anderson FA, Granger CB, et al. Decline in rates of death and heart failure in acute coronary syndromes, 1999–2006. J Am Med Assoc. 2007;297(17):1892–900.
8 Krumholz HM, Wang Y, Chen J, Drye EE, Spertus JA, Ross JS, et al. Reduction in acute myocardial infarction mortality in the United States. J Am Med Assoc. 2009;302(7):767–73.
9 Radovanovic D, Erne P. AMIS Plus: Swiss registry of acute coronary syndrome. Heart. 2010;96(12):917–21.
10 Larg A, Moss JR. Cost-of-illness studies: A guide to critical evaluation. PharmacoEconomics. 2011;29(8):653–71.
11 FSO. Medizinische Statistik der Krankenhäuser (detailed data obtained on special request). Neuchâtel: Federal Statistical Office; 2010.
12 FSO. Todesursachenstatistik (detailed dataset obtained on special request). Neuchâtel: Federal Statistical Office; 2010.
13 FSO. Lebensewartung nach Alter und Geschlecht (1998–2009). Neuchâtel: Federal Office of Statistics; 2010.
14 FSO. Statistik diagnosebezogener Fallkosten: Fallkosten nach AP-DRG und Krankenhaustypologie – Jahr 2008. Neuchchâtel: Federal Statistical Office; 2010.
15 FSO. Schweizerische Arbeitskräfteerhebung SAKE: Ständige Wohnbevölkerung, Erwerbsquote, Erwerbstätigenquote. Neuchâtel: Federal Statistical Office; 2010.
16 FSO. Lohnstrukturerhebung. Neuchâtel: Federal Statistic Office; 2010.
17 AMIS Plus. AMIS plus data 2008. University of Zurich; 2009.
18 santésuisse. Tagestaxen in Heilanstalten – Konkordat der Schweizerischen Krankenversicherungen. 2008.
19 Brüggenjürgen B, Rupprecht HJ, Willich SN, Spannagl M, Ehlken B, Smala A, et al. Cost of atherothrombotic diseases – myocardial infarction, ischaemic stroke and peripheral arterial occlusive disease in Germany. J Publ Health. 2005;13(4):216–24.
20 Szucs TD, Berger K, März W, Schäfer JR. Kosteneffektivität von Pravastatin in der koronaren Sekundärprävention bei Patienten mit Myokardinfarkt oder instabiler Angina pectoris in Deutschland. Herz. 2000;25(5):487–94.
21 Brønnum-Hansen H, Jørgensen T, Davidsen M, Madsen M, Osler M, Gerdes LU, et al. Survival and cause of death after myocardial infarction: the Danish MONICA study. J Clin Epidemiol. 2001;54(12):1244–50.
22 Briffa T, Hickling S, Knuiman M, Hobbs M, Hung J, Sanfilippo FM, et al. Long term survival after evidence based treatment of acute myocardial infarction and revascularisation: follow-up of population based Perth MONICA cohort, 1984–2005. BMJ. 2009;338.
23 Setoguchi S, Glynn RJ, Avorn J, Mittleman MA, Levin R, Winkelmayer WC. Improvements in long-term mortality after myocardial infarction and increased use of cardiovascular drugs after discharge: A 10-year trend analysis. J Am Coll Cardiol. 2008;51(13):1247–54.
24 Vaccarino V, Berkman LF, Krumholz HM. Long-term outcome of myocardial infarction in women and men: a population perspective. Am J Epidemiol. 2000;152(10):965–73.
25 Marchioli R, Avanzini F, Barzi F, Chieffo C, Di Castelnuovo A, Franzosi MG, et al. Assessment of absolute risk of death after myocardial infarction by use of multiple-risk-factor assessment equations; GISSI-prevenzione mortality risk chart. Eur Heart J. 2001;22(22):2085–103.
26 FSO. Kodierungshandbuch – Der offizielle Leitfaden der Kodierregeln. Neuchâtel; 2009.
27 FSO. Kosten und Finanzierung des Gesundheitswesens – Detaillierte Ergebnisse 2008 und jüngste Entwicklung. Neuchâtel: Federal Statistics Office; 2011.
28 WHO collaborating centre for drug statistics methodology [Internet]. ATC/DDD Index 2011; [1.6.2011]. Available from: http://www.whocc.no/atc_ddd_index/.
29 Tarmed-Suisse. Tarmed Tarifkatalog. Vol. 01.05.03; 2008.
30 FOPH [Internet]. List of pharmaceutical specialties; January 2011. Available from: http://www.bag.admin.ch/themen/krankenversicherung/00263/00264/00265/index.html?lang=en.
31 Bhattacharyya MR, Perkins-Porras L, Whitehead DL, Steptoe A. Psychological and clinical predictors of return to work after acute coronary syndrome. Eur Heart J. 2007;28(2):160–5.
32 Hauptverband der österreichischen Sozialversicherungsträger. Statistisches Jahrbuch der österreichischen Sozialversicherungen. 2009.
33 Aasa M, Henriksson M, Dellborg M, Grip L, Herlitz J, Levin LA, et al. Cost and health outcome of primary percutaneous coronary intervention versus thrombolysis in acute ST-segment elevation myocardial infarction – results of the Swedish early decision reperfusion study (SWEDES) trial. Am Heart J. 2010;160(2):322–8.
34 Ara R, Brazier JE. Populating an economic model with health state utility values: moving toward better practice. Value Health. 2010;13(5):509–18.
35 SNB. Statistisches Monatsheft Mai 2011 – Preise und Löhne – Konsumentenpreise – Total (monatlich). Swiss National Bank; 2011.
36 SNB. Schweizerische Nationalbank – Statistisches Monatsheft Mai 2011 – Zinssätze und Renditen. Swiss National Bank; 2011.
37 Bramkamp M, Radovanovic D, Erne P, Szucs T. Determinants of costs and the length of stay in acute coronary syndromes: a real life analysis of more than 10,000 patients. Cardiovascular Drugs & Therapy. 2007;21(5):389–98.
38 Taylor MJ, Scuffham PA, McCollam PL, Newby DE. Acute coronary syndromes in Europe: 1-year costs and outcomes. Current Medical Research & Opinion. 2007;23(3):495–503.
39 Kanichay R, Wilsdon T, Connolly S, Sauri L. The economic and societal burden of acute coronary syndrome in Canada. Draft Final Methodology Report. London: Charles River Associates; 2010.
40 OBSAN [Internet]. Schweizerisches Gesundheitsobservatorium OBSAN: Gesundheitszustand – Spezifische Diagnosen – Myokardinfarkt; [cited 2012 Jun 18]. Available from: http://www.obsan.admin.ch/bfs/obsan/de/index/04/01/ind26.indicator.149011.260103.html.