
Figure 1
Age distribution in non-HCC and HCC group.
DOI: https://doi.org/10.4414/smw.2012.13651
Hepatocellular carcinoma (HCC) is the most frequent form of primary liver cancer. It is the fifth most common cancer worldwide and the third cause of cancer mortality [1]. In Europe, Oceania, Japan and America, chronic hepatitis C is one of the main risk factors for HCC [2]. The virus has possible oncogenic properties, but many factors determining the risk of developing an HCC are host dependent, some are genetic and not modifiable, other are linked to lifestyle and can be influenced. Lifestyle factors such as alcohol intake, cigarette smoking, and underlying diseases such as obesity, diabetes and hepatitis B (HBV) and HIV co-infection have been reported to increase the risk for HCC [3]. Socioeconomic factors have also been found to influence this risk [4]. Few databases are comprehensive enough and have a long enough follow-up to address prospectively these factors. The Swiss Hepatitis C Cohort Study (SCCS) established in 2000 with more than 3,000 participants offers a unique setup to investigate these co-factors. The aim of this study was to identify important co-factors influencing the development of HCC in chronic Hepatitis C patients included in the SCCS.
The SCCS is a multicentre study started in September 2000 and is being carried out at eight major Swiss hospitals, including 5 university hospitals (Basel, Bern, Geneva, Lausanne and Zürich) and 3 major cantonal hospitals (Lugano, Neuchâtel and St. Gallen). The SCCS collects standardised prospective information on adults with hepatitis C virus (HCV) infection through questionnaires, clinical examination and laboratory investigations [5]. All the enrolled patients signed an informed consent and the SCCS protocol has been approved in each participating centre by the local ethical committee. The database includes demographic information such as gender, age, social and educational background, occupational situation, household income as well as co-morbidities, current and previous alcohol consumption and substance abuse. Histological information obtained by liver biopsy and results of laboratory tests are also prospectively collected. Standardised follow-up questionnaires cover events and behaviours since the last visit. A ‘Stop Form’ is filled out when the patient is either lost to follow-up or has died. The cause of death is coded according to the ICD10 classification. To analyse the database, patients were divided into 2 groups: the first group includes all the patients with confirmed HCC and the second group contains all the patients with no evidence for HCC.
The HCC group included all the patients who either had a confirmed HCC at the time of recruitment or at any point during the follow up period. All patients who had C22.0, the ICD10 code for HCC, entered as cause of death were also considered. The inclusion criteria were exclusively based on the information of the SCCS database. For the non-HCC group, all patients who had no evidence for HCC were included. A downside of this approach is that for the 30 patients diagnosed with HCC before recruitment some of the analysed factors cannot be considered as risk factors leading to HCC. However, this approach can be justified by the fact that most of the reviewed patient characteristics, especially the ones that this study focused on do not change with the cancer diagnosis.
Demographic parameters at registration into the cohort such as age, gender, education, occupational situation, income were analysed. The following risk factors were analysed: alcohol consumption, intravenous drug abuse, intranasal cocaine abuse, drug substitution, blood transfusion, organ transplantation, invasive medical procedure, profession with exposure to human blood, living in a household with a HCV positive person, tattoos and piercings. Clinical information included body mass index (BMI), diabetes mellitus, gastrointestinal haemorrhage, jaundice, ascites, porto-systemic encephalopathy. Laboratory results comprised anti-HBc serology, HCV genotype, hepatitis A (HAV) vaccination. Histological results such as degree of fibrosis, grade of activity and steatosis were available for patients who had a biopsy. For cirrhotic patients, the Child-Pugh score was used.
The patient’s age has been defined as follows:
For HCC patients the age for the study was set to the age at the time of the cancer diagnosis. For the non-HCC group age was calculated for the time of recruitment.
In a first step, univariate analyses were performed on all the evaluated co-factors. A Pearson-χ2 test was used to assess the statistical significance of differences in the distributions of categorical variables between subjects in the HCC and the non-HCC group. A p-value of <0.05 has been considered statistically significant. Odds ratios (OR) with corresponding 95% confidence intervals (95% CI) were calculated with logistic regression analyses. To ensure better independence of the different factors, all the analyses were adjusted for gender and age. These two variables were chosen for adjustment based on their well-known influence on HCC development.
In a second step, binary multivariate logistic regressions have been performed for each table. Due to the quantity of analysed factors and number of missing values in some variables it was not possible to run a multivariate analysis including all discussed co-factors. For each factor in the same table the overall statistical significance of the factor was calculated along with the specific p-value and odds ratio for each level of each factor against the first reference level of that factor.
As a third analysis step, a hierarchical tree of risk factors was calculated based on the top six most influential factors (based on significance level and odds ratios), found in the logistic regression. This analysis was conducted in order to examine how these factors influence one another, and whether they show any particularly interesting interactions which could be used for diagnostic purposes.
Information was available for 3,390 patients; the non-HCC group included 3,260 patients and the HCC group 130 patients. The age profile was different between the 2 groups. This is illustrated in the (fig. 1). The age categories 50–59, 60–69, 70–79 and 80–89 years were more represented in the HCC group than in the non-HCC group. Reciprocally, patients 20 to 49 year-old were less frequent in the HCC group. The (fig. 2) is a box and whiskers plot comparing the age in both groups. Mean age for the HCC group was 54 with a standard deviation of 12 years and a 95% CI of 52–56. Mean age for non-HCC group was 44 with a standard deviation of 11 and a 95% CI of 43–44. Median age for the HCC group was 55 years and for the non-HCC group 42 years.
Figure 1
Age distribution in non-HCC and HCC group.
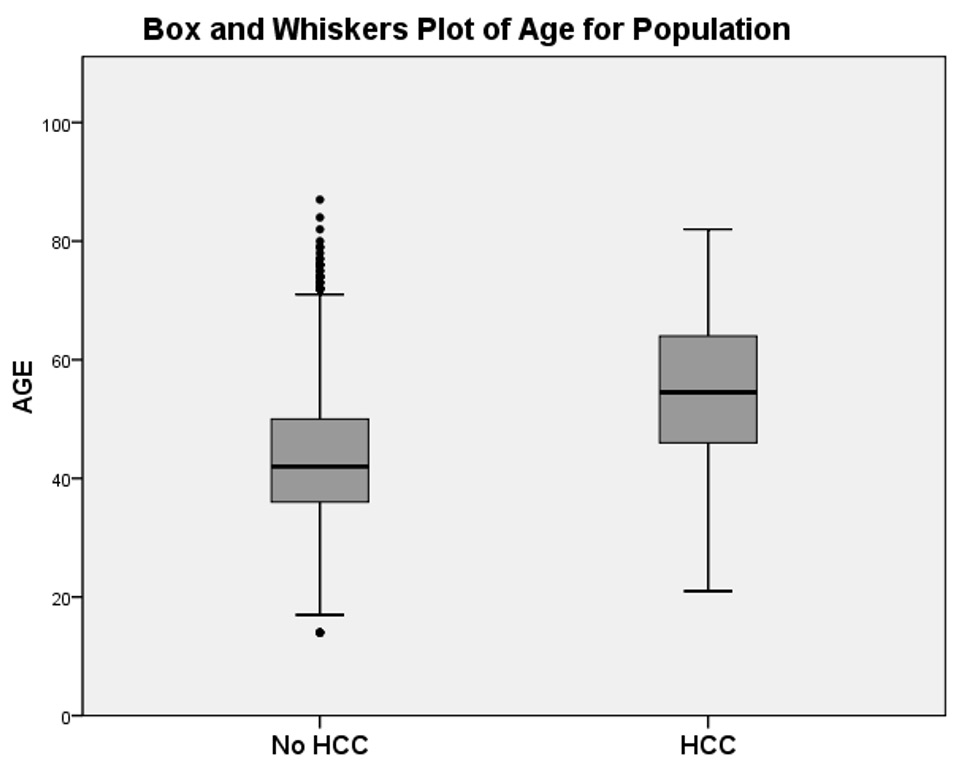
Figure 2
Box and whiskers plot of age for non-HCC and HCC group.
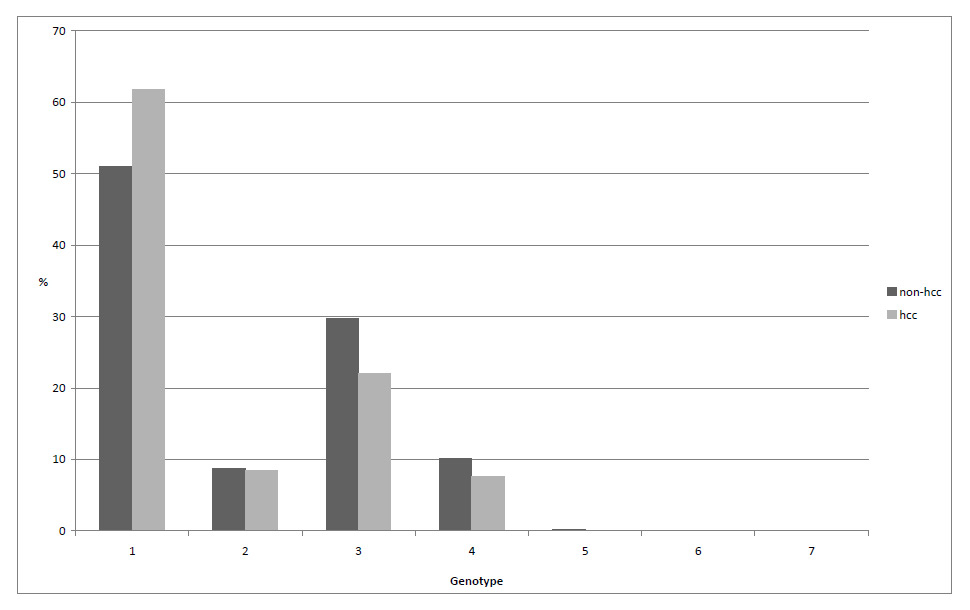
Figure 3
Frequency hepatitis C virus genotypes, compared between HCC and non-HCC group.
The co-factors that were significant in the univariate analysis are listed in the table 1. Results of the multivariate analysis were included where they were significant. Male gender is an important risk factor. With an odds ratio of 1.70 (95% CI 1.14–2.53) males had a higher risk for HCC compared to females. The multivariate analysis showed a p-value of 0.032 and OR of 1.639, identifying male gender as an independent risk factor. Fifty percent of the HCC patients used to drink more than 20g of alcohol per day, whereas 45% of the non-HCC patients were drinking regularly. This resulted in a gender and age adjusted OR of 1.55 (95% CI 1.06–2.27) with alcohol as a co-factor. Liver cirrhosis was strongly associated with HCC. It was differently distributed among the 2 groups: 66% of the HCC patients had cirrhosis, whereas only 21% of the non-HCC patients, this calculated an OR of 4.82 (95% CI 3.28–7.09). Patients with a Child Pugh classification B or C had an increased HCC risk compared to patients with a Child Pugh classification A. Patients with Child Pugh classification C did not have greater HCC risk than patients with Child Pugh classification B. Clinical consequences of cirrhosis such as ascites (p<0.001, OR 3.86, 95%CI 2.34–6.37) and porto-systemic encephalopathy (p = 0.009, OR 3.46 95%CI 1.36–8.78) were significantly associated with HCC, gastrointestinal haemorrhage was close to significant (p = 0.084, OR 1.85, 95% CI 0.92–3.70). In the SCCS database, test results for HBc-antibodies can be either negative, positive or borderline. Borderline test results showed a significantly higher risk for HCC than both positive and negative anti-HBc (p <0.001, OR = 2.96 95%CI 1.65–5.32). In the multivariate analysis this co-factor stood out with an overall p-value of 0.018 and p = 0.013 for anti-HBc borderline. Merging borderline and positive test results into one group diminished this effect: p = 0.063, OR = 1.44, 95%CI 0.98–2.10 (results not in table). At last, patients with diabetes mellitus had higher risk for HCC (p = 0.002, OR 2.08, 95%CI 1.30–3.34).
The table 2 describes the effects of histological findings based on a univariate and multivariate analysis. Neither the activity nor the presence of steatosis showed evidence for an increased risk of HCC. In contrast, increased fibrosis stage was associated with HCC. Patients with histological probable or definite cirrhosis had a much higher cancer risk compared to those with no histological fibrosis (p = 0.007, OR 5.15, 95% CI 1.56–6.98). The multivariate p-value of <0.001 confirmed fibrosis as an independent factor in this table.
The socioeconomic factors are detailed in the table 3. There seems to be an inverse association between HCC and annual income. The HCC risk increased as the income decreased. Taking the lowest income category as a reference our results revealed higher incomes as protective factors. Patients with an annual income of >80 000 Swiss francs had a smaller risk of developing HCC than patients with an income of <40 000; however, this association did not reach statistical significance (p = 0.056, OR 0.57, 95%CI 0.32–1.02). Patients with higher education had a smaller risk for HCC than patients with no education, this association was significant (p=0.027 OR = 0.54, 95%CI 0.31–0.93). A comparison of the patient’s profession showed no significant differences. All three factors were non-significant in the multivariate analysis.
The distribution of patients with HCC among the different HCV genotypes is shown in the (fig. 3. Genotype 1 was the most common and it was slightly more frequent in HCC patients than in the non-HCC group. The risk analysis for the HCV genotypes is provided in table 4. It revealed a smaller HCC risk for patients with genotype 2.
Finally, in order to better understand the place of the different factors, a hierarchical tree was generated based on the six most important risk factors (gender, age, diabetes, fibrosis, antiHBc, income). On each level, the box furthest to the right is the factor with the highest risk for HCC. The tree identified age as the main risk factor. The age groups <42, 42–60, >60 were automatically selected as the best ones to distinguish between HCC and non-HCC patients. The younger patient group was further subcategorised depending on the antiHBc test result. Borderline antiHBc appeared to be a relevant risk factor. In the middle aged group (42–60) it was observed, that diabetes mellitus is an important risk factor for patients with low histological fibrosis level. In patients over 60, cirrhosis was the most important risk factor for HCC.
| Table 1: Highly associated co-factors. | ||||||
| HCC, N (%) | Non-HCC, N (%) | Univariate pa | OR (95% CI)b | Multivariate pc | Multivariate ORd | |
| Gender | ||||||
| Total | 130 (100) | 3,260 (100) | ||||
| Male | 96 (73.85) | 2,036 (62.45) | 0.009 | 1.70 (1.14–2.53) | 0.032 | 1.639 |
| Female | 34 (26.15) | 1,224 (37.55) | Reference | Reference | ||
| Drinker (>20g/d) | ||||||
| Total | 129 (100) | 3,257 (100) | nse | |||
| No | 64 (49.61) | 1,802 (55.33) | Reference | |||
| Yes | 65 (50.39) | 1,455 (44.67) | 0.024 | 1.55 (1.06–2.27) | ||
| Cirrhosis | ||||||
| Total | 130 (100) | 3,256 (100) | ns | |||
| No | 44 (33.85) | 2,586 (79.42) | Reference | |||
| Yes | 86 (66.15) | 670 (20.58) | <0.001 | 4.82 (3.28–7.09) | ||
| Child Pugh | ||||||
| Total | 86 (100) | 670 (100) | ns | |||
| A (5–6) | 54 (62.79) | 494 (73.73) | Reference | |||
| B (7–10) | 28 (32.56) | 145 (21.64) | 0.041 | 1.73 (1.02–2.91) | ||
| C (11–15) | 4 (4.65) | 31 (4.63) | 0.369 | 1.67 (0.54–5.16) | ||
| Ascites | ||||||
| Total | 130 (100) | 3,260 (100) | ns | |||
| No | 106 (81.54) | 3,136 (96.20) | Reference | |||
| Yes | 24 (18.46) | 124 (3.80) | <0.001 | 3.86 (2.34–6.37) | ||
| Porto-systemic encephalopathy | ||||||
| Total | 130 (100) | 3,260 (100) | ns | |||
| No | 124 (95.38) | 3,226 (98.96) | Reference | |||
| Yes | 6 (4.62) | 34 (1.04) | 0.009 | 3.46 (1.36–8.78) | ||
| Gastrointestinal haemorrhage | ||||||
| Total | 130 (100) | 3,260 (100) | ns | |||
| No | 120 (92.31) | 3,160 (96.93) | Reference | |||
| Yes | 10 (7.69) | 100 (3.07) | 0.084 | 1.85 (0.92–3.70) | ||
| Anti-HBc | ||||||
| Total | 122 (100) | 2,986 (100) | 0.018 | |||
| Negative | 62 (50.81) | 1,645 (55.09) | Reference | 0.74 | 0.93 | |
| Borderline | 17 (13.93) | 158 (5.29) | <0.001 | 2.96 (1.65–5.32) | 0.013 | 2.245 |
| Positive | 43 (35.24) | 1,183 (39.61) | 0.432 | 1.18 (0.78–1.78) | Reference | Reference |
| Diabetes | ||||||
| Total | 130 (100) | 3,247 (100) | ns | |||
| No | 103 (79.23) | 3,051 (93.96) | Reference | |||
| Yes | 27 (20.77) | 196 (6.04) | 0.002 | 2.08 (1.30-3.34) | ||
| Abbreviations: HCC = patients with hepatocellular carcinoma; OR = odds ratio, 95% CI = 95% confidence interval; ns = not significant; ap-value for univariate analysis, adjusted for gender and age; bodds ratio for univariate analysis adjusted for gender and age; cp-value for multivariate analysis of whole table; dodds ratio for multivariate analysis of whole table. | ||||||
| Table 2: Histological factors | ||||||
| HCC, N (%) | Non-HCC, N (%) | Univariate pa | OR (95% CI)b | Multivariate pc | Multivariate ORd | |
| Activity of chronic hepatitis | ||||||
| Total | 101 (100) | 1,921 (100) | 0.228 | |||
| A0 (none) | 4 (3.96) | 38 (1.98) | Reference | |||
| A1 (minimal) | 19 (18.81) | 652 (33.94) | 0.031 | 0.27 (0.08 –0.89) | 0.020 | 0.19 |
| A2 (mild) | 38 (37.62) | 799 (41.59) | 0.113 | 0.40 (0.13–1.24) | 0.035 | 0.23 |
| A3 (moderate) | 34 (33.66) | 389 (20.25) | 0.264 | 0.52 (0.16–1.64) | 0.049 | 0.24 |
| A4 (severe) | 6 (5.94) | 43 (2.24) | 0.497 | 0.61 (0.15–2.53) | 0.066 | 0.20 |
| Fibrosis | ||||||
| Total | 102 (100) | 1,931 (100) | <0.001 | |||
| None | 3 (2.94) | 195 (10.10) | Reference | |||
| Portal fibrosis | 9 (8.82) | 567 (29.36) | 0.894 | 0.91 (0.24–3.45) | 0.825 | 1.21 |
| Portal fibrosis with rare septa | 21 (20.59) | 550 (28.48) | 0.37 | 1.76 (0.51–6.05) | 0.169 | 2.98 |
| Bridging fibrosis | 10 (9.80) | 241 (12.48) | 0.52 | 1.54 (0.41–5.79) | 0.165 | 3.20 |
| Probable or definite cirrhosis | 59 (57.84) | 378 (19.58) | 0.007 | 5.15 (1.56–6.98) | 0.004 | 9.50 |
| Steatosis | ||||||
| Total | 90 (100) | 1,905 (100) | ||||
| No | 21 (23.33) | 548 (28.77) | Reference | |||
| Yes | 69 (76.67) | 1,357 (21.23) | 0.577 | 0.86 (0.51–1.45) | 0.266 | 0.732 |
| Abbreviations: HCC = patients with hepatocellular carcinoma; OR = odds ratio, 95% CI = 95% confidence interval; ns = not significant; ap-value for univariate analysis, adjusted for gender and age; bodds ratio for univariate analysis adjusted for gender and age; cp-value for multivariate analysis of whole table; dodds ratio for multivariate analysis of whole table. Note that not all patients did have a liver biopsy available. | ||||||
| Table 3: Socioeconomic factors. | ||||||
| HCC, N (%) | Non-HCC, N (%) | Univariate pa | OR (95% CI)b | multivariate pc | multivariate ORd | |
| Annual Income in Swiss Francs | ||||||
| Total | 98 (100) | 2,528 (100) | 0.202 | |||
| <40,000 | 38 (38.78) | 1,051 (41.57) | Reference | Reference | ||
| 40,000–80,000 | 40 (40.82) | 930 (36.79) | 0.305 | 0.78 (0.48–1.25) | 0.080 | 1.925 |
| >80,000 | 20 (20.40) | 547 (21.64) | 0.056 | 0.57 (0.32–1.02) | 0.145 | 1.599 |
| Education | ||||||
| Total | 128 (100) | 3,222 (100) | 0.225 | |||
| No education | 32 (25.00) | 709 (22.00) | Reference | Reference | ||
| Short-time professional education | 11 (8.59) | 385 (11.95) | 0.081 | 0.53 (0.26–1.08) | 0.935 | 0.97 |
| Finished apprenticeship | 59 (46.09) | 1,455 (45.16) | 0.306 | 0.79 (0.50–1.24) | 0.161 | 0.473 |
| Higher education (bachelor-university) | 26 (20.31) | 673 (20.88) | 0.027 | 0.54 (0.31–0.93) | 0.436 | 1.264 |
| Profession | ||||||
| Total | 127 (100) | 3,210 (100) | 0.543 | |||
| Unemployed | 8 (6.29) | 351 (10.93) | Reference | Reference | ||
| Employed | 62 (48.82) | 2047 (63.77) | 0.924 | 0.96 (0.45–2.05) | 0.454 | 1.351 |
| Retired | 57 (44.88) | 812 (25.29) | 0.57 | 1.26 (0.57–2.80) | 0.291 | 1.37 |
| Abbreviations: HCC = patients with hepatocellular carcinoma; OR = odds ratio, 95% CI = 95% confidence interval; ns = not significant; ap-value for univariate analysis, adjusted for gender and age; bodds ratio for univariate analysis adjusted for gender and age; cp-value for multivariate analysis of whole table; dodds ratio for multivariate analysis of the whole table. | ||||||
| Table 4: Risk analysis for HCV genotypes. | ||||
| HCC, N (%) | Non-HCC, N (%) | Univariate pa | ORa (95%CI) | |
| HCV genotype | ||||
| Total | 118 (100) | 3,075 (100) | ||
| Genotype 1 | 73 (61.86) | 1574 (51.19) | 0.005 | 2.78 (1.37–5.65) |
| Genotype 2 | 10 (8.47) | 271 (8.81) | Reference | |
| Genotype 3 | 26 (22.03) | 917 (29.82) | 0.009 | 2.97 (1.31–6.72) |
| Genotype 4 | 9 (7.63) | 313 (10.17) | 0.052 | 2.61 (0.99–6.89) |
| a Adjusted for gender and age. | ||||
There are a number of co-factors influencing the development of HCC in patients with chronic hepatitis C. In the SCCS we identified male gender, cirrhosis, alcohol intake, diabetes and lack of education as being significantly associated with HCC.

Figure 4
Hierarchial tree of important risk factors. Data for each level (left out of graph to conserve comprehensibility): level 1 (hcc/non-hcc): nonhcc = 96.2% (3,260), hcc = 3.8% (130); level 2 (age<42): non-hcc = 98.9% (1,639), hcc = 1.1% (19); level 2 (age 42–60): non-hcc = 95.5% (1,337), hcc = 4.5% (63); level 2 (age>60):non-hcc = 85.5% (284), hcc = 14.5% (48); level 3 (anti-HBcpos/neg):non-hcc = 99.1% (1,570), hcc = 0.9% (14); level 3 (anti-HBc borderline):non-hcc = 93.2% (69), hcc = 6.8% (5); level 3(fibrosis: none.):non-hcc = 96.9% (1,099), hcc = 3.1% (35), level 3 (cirrhosis):non-hcc = 89.5% (238), hcc = 10.5% (28), level3 (fibrosis: none) non-hcc = 92% (231), hcc = 8% (20); level 3(cirrhosis):non-hcc = 65.4% (53), hcc = 34.6% (28); level 4 (no diabetes): non-hcc = 97.3% (1,016), hcc = 2.7% (28), level 4 (diabetes):non-hcc = 92.2% (83), hcc = 7.8% (7).
We found a different age distribution with non-HCC patients being much younger than HCC patients. There was an increased risk after the age of 42 and a further increase in risk after 60. This is consistent with data on 2166 chronic hepatitis C patients which reported a 15-fold higher risk for HCC in patients over 65 years of age compared to patients in their 20’s [6]. The age peak in our study was between 60 and 69 years. A US study showed an age peak in patients aged 70–74 years for the years 2000 to 2002 [3]. They reported a substantial shift towards younger age with the maximum age being 75–79 in 1991–1993 and 80–84 years in 1982–1984. Our age peak was in line with this trend towards younger age over time.
In almost every study, HCC is reported to be more frequent in male than in female patients. Our analysis identified male gender as an independent risk factor. It showed a male to female ratio of 2.7:1. This ratio is rather low ratio since other studies reported a male to female ratio up to 5:1 [3]. Several reasons may explain this male predominance. First, men likely expose themselves to more risk factors. They generally drink more alcohol. Second, there are biological factors [7]. A study with telomerase-deficient mice showed that male mice had a 2 to 8-fold higher risk for HCC than female mice [8]. This implies that male gender hormones may favour liver cancer development. Mice lacking androgen receptor present delayed development of HCC [9]. The unfavourable effect of androgens can be further underlined by a study from Taiwan that associated elevated serum testosterone levels with the development of HCC [10].
In our cohort, alcohol consumption was more frequent in patients with HCC (50%) than in patients without HCC (45%). Age and gender adjusted OR of 1.55 (95%CI 1.06–2.27) with a p-value of under 0.05 suggested that alcohol is a risk factor for HCC in HCV patients. This is in line with the published evidence. A European study reported that alcohol consumption of over 11 litres per year increased the risk of liver cancer by 26% in men and 14% in women [11]. Donato et al. reported that HCC risk increases linearly with alcohol consumption [12].
Hepatic fibrosis is a key risk factor for HCC. We found the risk for HCC to increase up to an OR of 5.15 with increasing stadium of fibrosis. This is corroborated by the finding that cirrhosis was associated with an OR of 4.82. Results from other studies have already proven cirrhosis to be the main risk factor for HCC in hepatitis C patients [2]. Among the hepatitis C patients with cirrhosis the annual incidence of HCC is 1.4% in the USA, 2–4% in Italy and 4–8% in Japan [2]. Cirrhosis does not only influence the incidence of primary liver cancer but seems to also influence its severity. A study with North American patients reported that patients with liver cirrhosis develop more aggressive and less differentiated HCC than patients without cirrhosis [13]. In contrast, neither histological activity of chronic hepatitis C, nor steatosis were associated with the development of HCC in the SCCS.
Our results showed that patients with Child-Pugh class B had higher risk for HCC than those with Child-Pugh class A. This is not surprising and fits with data about the histological degree of fibrosis and the increased risk for HCC in patients with ascites and in patients with porto-systemic encephalopathy. However, it is less obvious why patients with Child Pugh class C do not have a higher HCC risk than patients with Child Pugh class B. One explanation might be that patients with Child Pugh class C have a short survival and when they reach this stage without HCC they die from liver failure and/or complications of portal hypertension.
A recent meta-analysis of 59 studies came to the conclusion that HBV/HCV co-infection does not increase the risk of HCC compared to HBV or HCV mono-infection [14]. Our analysis showed a significant difference between borderline anti-HBc test results to negative as well as positive test results. Both the univariate and multivariate analysis suggested that a borderline anti-HBc test result is an independent risk factor and based on the result of the hierarchical tree the importance is limited to patients under 42 years of age. These patients with borderline anti-HBc serology may be in a particularly oncogenic stage of occult hepatitis B infection.
In our results, 21% of the HCC patients and only 6% of the non-HCC patients were diabetics (OR 2.08, 95% CI: 1.30–3–34, p = 0.002). We identified diabetes mellitus as a strong risk factor for HCC in hepatitis C patients. This is a well-known association in North America [15–17] as well as in Europe [18–20]. Our results also suggested that diabetes the determining factor in middle aged patients (42–60) with low fibrosis stage. This concurs with recent findings of HCC in diabetic patients without significant fibrosis. [21]
One unique aspect of this work was to investigate the socioeconomic characteristics of Swiss hepatitis C patients who develop HCC. Our study took into account 3 socioeconomic factors: professional occupation, education level and annual income. We found no significant difference between employed and unemployed patients. Compared to patients with no education, patients with higher education had a lower risk (OR 0.5) for HCC. The largest differences of HCC risk was seen when comparing the patients’ annual income. The HCC risk increased as the income decreased. This is in line with the results of a study performed in Korea that compared patients with low income (<4000 USD/month) to patients with high income (>4000 USD/month). They found an odds ratio of 17 (95% CI 4.27–68.25), linking low income to higher HCC incidents [4]. We found no difference between the three factors in the multivariate analysis, which is mainly because the three groups are very similar. Patients with higher education generally have better jobs and earn more than patients with no education. Our conclusion is that patients with low socioeconomic status have a higher risk for HCC. A possible explanation may be that patients with little education and low income present additional co-factors [22]. Another possibility is that these patients do not seek medical attention and thereby are less likely to be treated. So far, in Switzerland, the socioeconomic status has no influence on treatment decisions [23]. Based on these results, however, patients with low income and education should be more closely monitored.
Genotype 1 is the most frequent genotype in the SCCS and patients with HCC slightly more frequently harbour this genotype. A meta-analysis came to the conclusion that patients with genotype 1b have an almost 2-fold (OR1.78, 95%CI 1.36–2.32) risk of developing HCC than those with other genotypes [24]. Our risk analysis showed that patients with genotype 2 had significantly less HCC risk than patients with genotype 1.
This work has limitations. It is descriptive by nature and does not provide mechanistic insights. It relies exclusively on the data of the SCCS database. The charts of the patients have not been reviewed and some important factors such as smoking are missing. Moreover, the effect of the antiviral therapy on the risk of developing HCC could not be evaluated. Nevertheless, this project has strengths. It is based on a very large database and provides unique information on Swiss patients infected with HCV who developed HCC. This information should help improving the management of these patients.
Acknowledgments:We are in debt to the help of Eveline Nüesch, Martin Rickenbach and Franziska Schöni-Affolter.
1 Herszenyi L, Tulassay Z. Epidemiology of gastrointestinal and liver tumors. Eur Rev Med Pharmacol Sci. 2010;14:249–58.
2 Fassio E. Hepatitis C and hepatocellular carcinoma. Ann Hepatol. 2010;9(Suppl):119–22.
3 El-Serag HB, Rudolph KL. Hepatocellular carcinoma: epidemiology and molecular carcinogenesis. Gastroenterology. 2007;132:2557–76.
4 Yun EH, Lim MK, Oh JK, Park JH, Shin A, Sung J, et al. Combined effect of socioeconomic status, viral hepatitis, and lifestyles on hepatocelluar carcinoma risk in Korea. Br J Cancer. 2010;103:741–6.
5 Prasad L, Spicher VM, Zwahlen M, Rickenbach M, Helbling B, Negro F. Cohort profile: the Swiss Hepatitis C Cohort Study (SCCS). Int J Epidemiol. 2007;36:731–7.
6 Asahina Y, Tsuchiya K, Tamaki N, Hirayama I, Tanaka T, Sato M, et al. Effect of aging on risk for hepatocellular carcinoma in chronic hepatitis C virus infection. Hepatology. 2010;52:518–27.
7 Naugler WE, Sakurai T, Kim S, Maeda S, Kim K, Elsharkawy AM, et al. Gender disparity in liver cancer due to sex differences in MyD88-dependent IL-6 production. Science. 2007;317:121–4.
8 Rudolph KL, Chang S, Millard M, Schreiber-Agus N, DePinho RA. Inhibition of experimental liver cirrhosis in mice by telomerase gene delivery. Science. 2000;287:1253–8.
9 Yeh SH, Chen PJ. Gender disparity of hepatocellular carcinoma: the roles of sex hormones. Oncology 2010;78(Suppl)1:172–9.
10 Yu MW, Chen CJ. Elevated serum testosterone levels and risk of hepatocellular carcinoma. Cancer Res. 1993;53:790–4.
11 Ribes J, Cleries R, Esteban L, Moreno V, Bosch FX. The influence of alcohol consumption and hepatitis B and C infections on the risk of liver cancer in Europe. J Hepatol. 2008;49:233–42.
12 Donato F, Tagger A, Gelatti U, Parrinello G, Boffetta P, Albertini A, et al. Alcohol and hepatocellular carcinoma: the effect of lifetime intake and hepatitis virus infections in men and women. Am J Epidemiol. 2002;155:323–31.
13 Nzeako UC, Goodman ZD, Ishak KG. Hepatocellular carcinoma in cirrhotic and noncirrhotic livers. A clinico-histopathologic study of 804 North American patients. Am J Clin Pathol. 1996;105:65–75.
14 Cho LY, Yang JJ, Ko KP, Park B, Shin A, Lim MK, et al. Coinfection of hepatitis B and C viruses and risk of hepatocellular carcinoma: systematic review and meta-analysis. Int J Cancer. 2011;128:176–84.
15 El-Serag HB. Hepatocellular carcinoma: recent trends in the United States. Gastroenterology. 2004;127:S27–34.
16 Lagiou P, Kuper H, Stuver SO, Tzonou A, Trichopoulos D, Adami HO. Role of diabetes mellitus in the etiology of hepatocellular carcinoma. J Natl Cancer Inst. 2000;92:1096–9.
17 El-Serag HB, Hampel H, Javadi F. The association between diabetes and hepatocellular carcinoma: a systematic review of epidemiologic evidence. Clin Gastroenterol Hepatol. 2006;4:369–80.
18 Wideroff L, Gridley G, Mellemkjaer L, Chow WH, Linet M, Keehn S, et al. Cancer incidence in a population-based cohort of patients hospitalized with diabetes mellitus in Denmark. J Natl Cancer Inst. 1997;89:1360–5.
19 Veldt BJ, Chen W, Heathcote EJ, Wedemeyer H, Reichen J, Hofmann WP, et al. Increased risk of hepatocellular carcinoma among patients with hepatitis C cirrhosis and diabetes mellitus. Hepatology. 2008;47:1856–62.
20 Polesel J, Zucchetto A, Montella M, Dal Maso L, Crispo A, La Vecchia C, et al. The impact of obesity and diabetes mellitus on the risk of hepatocellular carcinoma. Ann Oncol. 2009;20:353–7.
21 Paradis V, Zalinski S, Chelbi E, Guedj N, Degos F, Vilgrain V, et al. Hepatocellular carcinomas in patients with metabolic syndrome often develop without significant liver fibrosis: a pathological analysis. Hepatology. 2009:49:851–9.
22 Stuver SO, Boschi-Pinto C, Trichopoulos D. Infection with hepatitis B and C viruses, social class and cancer. IARC Sci Publ. 1997:319–24.
23 Overbeck K, Dufour JF, Müllhaupt B, Helbling B, Borovicka J, Malinverni R. Impact of international consensus guidelines on antiviral therapy of chronic hepatitis C patients in Switzerland. Swiss Med Wkly. 2010
24 Raimondi S, Bruno S, Mondelli MU, Maisonneuve P. Hepatitis C virus genotype 1b as a risk factor for hepatocellular carcinoma development: a meta-analysis. J Hepatol. 2009;50:1142–54.
Funding / potential competing interests: No financial support and no other potential conflict of interest relevant to this article was reported.