
Figure 1
Error Grid Analysis to evaluate clinical significance of measuring inaccuracies of the Contour® (A), the Accu-Chek® (B) and the Free-Style® (C) device by plotting the SMBG readings against the reference (HemoCue® Glucose 201+ System)
DOI: https://doi.org/10.4414/smw.2012.13631
Self measurement of blood glucose (SMBG) is an essential element in the treatment of diabetic patients. It provides immediate information on blood glucose (BG) values to patients and health care professionals and enables them to optimise glucose control thereby reducing the risk for complications [1, 2]. Several studies documented the clinical advantage of SMBG in type 1 diabetes patients [3–7] and there is rising evidence of similar benefits in patients with type 2 diabetes [8–10]. Owing to the increasing prevalence of diabetic patients [11] and the beneficial effects of blood glucose measurement in this population one can expect SMBG to be even more widely used in the future. This highlights the importance of providing reliable measurements of SMBG-devices used in clinical routine.
Accuracy of devices can be assessed with regard to right or wrong therapeutic decision based on a given blood glucose value obtained from an SMBG-device. This is achieved by using the error grid analysis (EGA), which divides a scatter plot comparing reference values and SMBG values into five regions of different clinical significance/interpretation. A more technical and mathematical approach to determine accuracy as well as precision is to calculate the relative deviation compared to an accepted reference method [12]. Furthermore the compliance with the requirements determined by the International Organization for Standardization (ISO 15197:2003 [13]) is an accepted measure for the quality of clinically used SMBG devices. Independently whatever approach of analysis is used the underlying principle is a good agreement between the reference and the SMBG under investigation.
In clinical practice patients are often confronted with a lack of information on reliability of their blood glucose measurements. Whether the degree of deviation is within an established range is often unclear, since the manufacturers’ specification on accuracy and precision is usually based on assessments with so called “golden lots”. This includes test strips known to have a particularly high accuracy. Therefore, we prospectively assessed three frequently used glucose meters in clinical practice. Importantly, the corresponding manufactures did not financially support this evaluation.
This was a prospective single centre study performed at the Diabetes Section of the Inselspital, the University Hospital of Bern, Switzerland between October 2009 and September 2010. The study followed the guidelines of good clinical practice, the Swiss health laws and the ordinance on clinical research. Each participant gave informed consent, and the study was approved by the local ethics committee in Bern, Switzerland.
A total of 150 participants attending the outpatient clinic for routine control were enrolled in this clinical study. Inclusion criteria were diabetes mellitus or impaired glucose tolerance according to current guidelines [14] and age of more than 18 years.
Capillary blood samples were always collected by the same experienced person. This procedure was chosen in order to minimise user dependant pre-analytical bias. The area of measurement was disinfected before pricking and the first drop of blood was removed with a sterile tissue. All the measurements were carried out with one single subsequent drop from the same area. The drop was applied to the stripes of the following four devices in random order: Contour® (Bayer Diabetes Care, Zürich, Switzerland), Accu-Check® aviva (Roche Diagnostics, Rotkreuz, Switzerland), Free-Style® lite (Abbott Diabetes Care, Baar, Switzerland) and the HemoCue® Glucose 201+ System (HemoCue® AB, Ängelholm, Sweden), which uses the glucose dehydrogenase method and was defined as the reference method in this study [15]. For statistical analysis plasma equivalent glucose readings were used. In case of the HemoCue® we applied plasma conversion by multiplying the values with 1.12. The three devices under investigation directly reported plasma values. The test strips were stored in the original vials at 21–25 °C and 25–50% atmospheric moisture. For coding purpose of the Accu-Chek® device we used the coding chip delivered with the test strip box; Contour® and Free-Style® did not require coding.
To assess agreement with the reference the mean absolute relative deviation (MARD, absolute value of the difference between SMBG readings and reference divided by the reference, expressed as percentage) of the three devices was calculated [12]. To account for differences according to glucose range, a sub analysis of MARD-values below and above 75 mg/dl (4.16 mmol/l) was performed. Furthermore, agreement between the SMBG values and the reference values was evaluated using Bland-Altman plots displaying the difference between SMBG readings and references versus their mean values [16].
To evaluate clinically relevant deviations Error Grid analysis (EGA), developed by Clarke and colleagues, was used [17]. The EGA divides a scatter plot comparing reference values (x-axis) and SMBG values (y-axis) into five regions of different clinical significance/interpretation. Values in zone A and B would lead to appropriate treatment, whereas glucose readings in zones C, D and E may lead to inadequate therapeutic decisions. Results in zone A or B are considered clinically acceptable, zones C to E are considered unacceptable.
Furthermore, performance of the devices were analysed according to the requirements for in vitro capillary blood glucose measurement, established by the International Organisation of Standardization (ISO 15197:2003 [13]). The ISO standard for SMBG devices suggests that at least 95% of the SMBG values should fall within ±20% deviation compared to the reference for glucose values ≥75 mg/dl (4.16 mmol/l) and within ±15 mg/dl (0.83 mmol/l) for values <75 mg/dl (4.16 mmol/l), since in low glucose ranges a small absolute deviation would result in a comparably high relative deviation.
Values are expressed as mean ± SEM, unless otherwise specified. Continuous variables were tested for significant differences by two-tailed t tests or repeated measure ANOVA. Bonferroni-correction was applied to correct for multiple comparison. Contingency tables were analysed for statistical significance using the χ 2or Fisher’s exact test. A p-value <0.05 was considered statistically significant. All analysis was performed using Microsoft Excel 2011 and Stata 12.0 (Stata Corporation, College Station, TX, USA).
In total 59 female and 91 male patients were included in this analysis. The mean age was 49.3 ± 1.3 years and mean HbA1c was 7.5 ± 0.1%.
Figure 1
Error Grid Analysis to evaluate clinical significance of measuring inaccuracies of the Contour® (A), the Accu-Chek® (B) and the Free-Style® (C) device by plotting the SMBG readings against the reference (HemoCue® Glucose 201+ System)
Overall Mean Absolute Relative Deviation (MARD) was 10.1 ± 0.65%, 7.0 ± 0.62% and 7.8 ± 0.48% for Contour®, Accu-Chek® and Free-Style®, respectively. Significant differences were detected between Contour® and Accu-Chek® (p <0.001) and between Contour® and Free-Style® (p = 0.001), whereas MARD was similar for Accu-Chek® and Free-Style® (p = 0.67). Maximal observed deviations were 42%, 59% and 29% for Contour®, Accu-Chek® and Free-Style®, respectively. In the range above 75mg/dl (4.16 mmol/l) MARD was significantly lower compared to the hypoglycaemic range for Accu-Chek® (6.3 ± 0.46% vs. 15.4 ± 4.7%, p <0.001) and Free-Style® (7.4 ± 0.48% vs. 12.7 ± 1.91%, p = 0.016), whereas a similar trend but no significant difference between the two ranges was detected for Contour® 9.9 ± 0.62% vs. 12.8 ± 3.7%, p = 0.2).
Figure 1 depicts the Clarke Error Grid Plots (EGA) and in table 1 the corresponding results of the Error Grid Analysis (EGA) are summarised. Sufficient clinical accuracy (i.e. values in zone A or B according to the EGA) was found in 99.3%, 98.7% and 100% of the readings obtained by Contour®, Accu-Chek® and Free-Style®, respectively (p for difference 0.78). Values in zone D, which may cause inadequate therapeutic decisions, were found for Contour® (0.7%) and Accu-Chek® (1.3%). Overall 99.3% of the 450 readings were allocated in zones A or B and could therefore be considered as clinically accurate.
Table 2 summarises the percentage of measurements of the three devices within ±15 mg/dl (0.83 mmol/l), ±10 mg/dl (0.56 mmol/l), and ±5 mg/dl (0.28 mmol/l) for blood glucose concentration below 75 mg/dl (4.16 mmol/l) and the percentages of glucose readings within ±20%, ±15%, ±10%, and ±5% compared to the reference for blood glucose concentrations ≥75 mg/dl (4.16 mmol/l). The minimum requirements defined by the ISO 15197:2003 standard (95% of all measurements within ±20% for the glucose range ≥75 mg/dl (4.16 mmol/l) and ±15 mg/dl (0.83 mmol/l) for the range <75 mg/dl (4.16 mmol/l)) were met by Accu-Chek® (95.3%) and Free-Style® (96%) whereas Contour® (92%) failed to reach the 95% limit. Using tighter limits of ±5% (for values ≥75 mg/dl (4.16 mmol/l)) and ±5 mg/dl (0.28 mmol/l) for values <75 mg/dl (4.16 mmol/l)) as proposed by the American Diabetes Association (ADA, (18)), only 32% (Contour®), 55% (Accu-Chek®) and 36% (Free-Style®) of the measurements comply with the requirements (p for difference <0.001).
Bland-Altmann analysis was performed to evaluate agreement between SMBG and reference readings and bias of the devices (fig. 2). Mean bias was –0.73 mmol/l, –0.15 mmol/l and –0.35 mmol/l for Contour®, Accu-Chek® and Free-Style®, respectively. The 95%-limits of agreement were narrowest for the Accu-Chek® device and ranged from ±1.6 mmol/l (Accu-Chek®) to ±2.35 mmol/l (Contour®). Applying an additional linear fit model to the Bland-Altman plot shows a general overestimation of low blood glucose values and an underestimation of high glucose values by the three SMBG devices. This phenomenon was most pronounced for the Contour® device.
| Table 1:Summary of Clarke Error Grid Analysis | ||||||
| n | Zone A | Zone B | Zone C | Zone D | Zone E | |
| all | 450 | 429 (95.3%) | 18 (4.0%) | 0 (0%) | 3 (0.7%) | 0 (0%) |
| Contour® | 150 | 141 (94.0%) | 8 (5.3%) | 0 (0%) | 1 (0.7%) | 0 (0%) |
| Accu-Chek® | 150 | 144 (96.0%) | 4 (2.7%) | 0 (0%) | 2 (1.3%) | 0 (0%) |
| Free-Style® | 150 | 144 (96.0%) | 6 (4.0%) | 0 (0%) | 0 (0%) | 0 (0%) |
| P-value | 0.638 | 0.499 | 0.602 | |||
| n = number of total SMBG readings. Data are number of SMBG readings in each zone (% of total readings). Zone A, glucose levels within ±20% of those found with the reference method leading to clinically correct treatment decisions; Zone B, deviation between device under investigation and reference method is more than 20% but without serious clinical consequences; Zone C, SMBG values would result in unnecessary treatment (overcorrecting acceptable glucose levels); Zone D represents a failure to detect and treat abnormal blood glucose levels; Zone E is an erroneous treatment zone, in which treatment decisions would be unsuitable (confusing hypo- and hyperglycemia). | ||||||
| Table 2:Summary of SMBG readings within different accuracy ranges | |||||||||
| BG concentration <75 mg/dl (4.16 mmol/l) | BG concentration ≥75 mg/dl (4.16 mmol/l) | ISO 15197 | ADA | ||||||
| SMBG readings within | SMBG readings within | ||||||||
| ±15 mg/dl (0.83 mmol/l) | ±10 mg/dl (0.56 mmol/l) | ±5 mg/dl (0.28 mmol/l) | ±20% | ±15% | ±10% | ±5% | |||
| Contour® | 11/13 (84.6%) | 10/13 (76.9%) | 7/13 (53.9%) | 127/137 (92.7%) | 107/137 (78.1%) | 86/137 (62.8%) | 41/137 (29.9%) | 138/150 (92%) | 48/150 (32%) |
| Accu-Chek® | 10/13 (76.9%) | 8/13 (61.5%) | 6/13 (46.2%) | 133/137 (97.1%) | 128/137 (93.4%) | 110/137 (80.3%) | 76/137 (55.5%) | 143/150 (95.3%) | 82/150 (54.7%) |
| Free-Style® | 13/13 (100%) | 11/13 (84.6%) | 3/13 (23.1%) | 131/137 (95.6%) | 125/137 (91.2%) | 103/137 (75.2%) | 51/137 (37.2%) | 144/150 (96%) | 54/150 (36%) |
| P-value | 0.336 | 0.536 | 0.355 | 0.274 | <0.001 | 0.004 | <0.001 | 0.269 | <0.001 |
| Data are number of SMBG readings within pre-specified deviation limits in the range below and above 75 mg/dl (4.16 mmol/l) and number of SMBG readings meeting the ISO 15197:2003 accuracy criteria (defined as ±15 mg/dl in the glucose range <75 mg/dl and ±20% in the glucose range ≥75 mg/dl) and the ADA criteria (defined as ±5 mg/dl in the glucose range <75 mg/dl and ±5% in the glucose range ≥75 mg/dl). | |||||||||
In this study we evaluated three frequently used SMBG-devices using exclusively commercially available test strips. From a clinical point of view all three devices showed sufficient agreement with the reference method. The mean relative difference (MARD) was 7% (Accu-Chek®), 8% (Free-Style®) and 10% (Contour®), respectively. Only three out of 450 measurements showed clinically significant deviation, which could possibly result in an inadequate therapeutic decision according to the EGA. The Accu-Chek® and Free-Style® device, which revealed significantly lower MARD values than the Contour® device, met the ISO minimum criteria, whereas the Contour® device was just below the required limit.
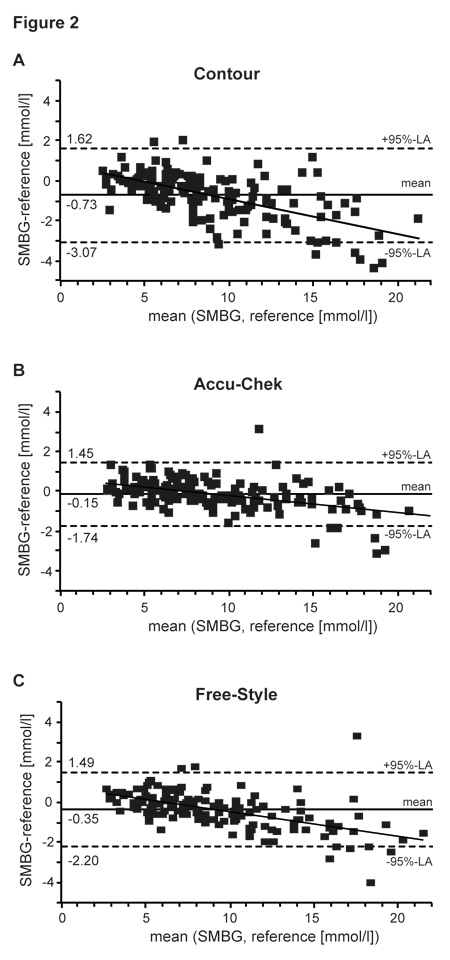
Figure 2
Bland-Altman diagram depicting deviation between SMBG readings of the Contour® (A), the Accu-Chek® (B), the Free-Style® (C) and the reference values (HemoCue® Glucose 201+ System) plotted against their means. The solid line represents the linear fit model of the corresponding data points. Horizontal lines show the mean difference between SMBG readings and reference values (solid), as well as the corresponding 95%-limits of agreement (i.e. ±2 SD; dashed lines).
In the overall analysis MARD values in our study were comparable with recent studies, corroborating the validity and results of our analysis [19, 20]. The slightly lower MARD values of Accu-Chek®, Free-Style® and Contour® in the analysis of Tack and colleagues might be explained by the exclusion of certain values or patients not meeting the predefined requirements, whereas in our analysis all obtained values were included. Furthermore they used duplicate measurements, which might additionally improve MARD values [20].
Intriguingly MARD values in the glucose range above 75 mg/dl (4.16 mmol/l) were significantly lower compared to the hypoglycaemic range for the Accu-Chek® and Free-Style® device, whereas for the Contour® device no such differences were found. The performance in the range below 75 mg/dl (4.16 mmol/l) was similar for all three devices. These findings suggest a better performance of Accu-Chek® and Free-Style® in the euglycaemic and hyperglycaemic ranges compared to low blood glucose levels.
The results obtained from the Bland-Altman plot show that the deviation of all three devices in the low blood glucose ranges mainly results from overestimation of blood glucose values, whereas in the hyperglycaemic range glucose levels tended to be underestimated in relation to the Hemo-Cue as the reference method. This may, therefore, result in an underreporting of hypoglycaemia, which in the case of hypoglycaemia unawareness might have clinical consequences. Nevertheless only three of the 450 measurement values were allocated in Zone D of the EGA, which may result in a wrong therapeutic decision. The remaining values would lead to a similar therapeutic decision according to the EGA. The values in zone A ranged from 94% (Contour®) to 96% (Accu-Chek® and Free-Style®), which is comparable to a recent report by Tack and colleagues, who also used commercially available test strips [20]. A study performed by Freckman et al. showed somewhat higher values in zone A, which might be explained by the use of supreme test stripe lots [21]. Interpreting the results of EGA, it has to be kept in mind that deviations of more than 20% seem to be unacceptable from an analytical point of view, but can clinically be acceptable (see Zone B of EGA), because treatment decisions are not negatively affected by this error.
Accu-Chek® and Free-Style® met the ISO criteria (13) of more than 95% of all readings within a deviation of ±20% in the range above 75 mg/dl (4.16 mmol/l) and ±15 mg/dl (0.83 mmol/l) in the range below 75 mg/dl (4.16 mmol/l). In contrast, Contour® showed only 92% of all readings within the ISO limits. Similar results were obtained in a recent study by Tack and colleagues (20). When applying tighter limits of ±5% in the range above 75 mg/dl (4.16 mmol/l) and ±5 mg/dl (0.28 mmol/l) in the range below 75 mg/dl (4.16 mmol/l) as suggested by the American Diabetes Association [18, 22] none of the three devices would comply with the requirements in either ranges. In contrast to the ISO criteria we found significant differences between the three devices, when applying tighter limits. Only the Accu-Chek® device showed more than 50% of all readings within the limits suggested by the ADA.
Since the error grid analysis showed in only 0.7% of all measurements clinical meaningful deviation it remains questionable whether the application of the tight ADA limits is reasonable in routine clinical practice. Nevertheless, the obvious superiority for the Accu-Chek® device when it comes to tighter limits, suggests the application of this device in case of usage of the SMBG devices in situations where a reliability as high as possible is absolutely mandatory (as for instance when SMBG devices are used for calibration of continuous glucose monitoring systems).
Although the overall mean deviation is acceptable (7–10%) and the devices showed a good clinical performance with regard to the EGA, it must be kept in mind, that we found maximal deviations of up to 60%. Therefore, it is important that patients are critical regarding the plausibility of their measurements and repeat the procedure if concerns arise about the correctness of a measurement. Furthermore, thorough instruction of the patients is absolutely mandatory to reduce user dependent sources of error. Besides adherence to the device manual and recommended measurement condition (i.e. temperature and altitude range), patients should wash and dry their hands before blood sampling, wipe off the first drop of blood and store the strips as indicated by the manufacturer. Contamination of the hands with glucose can lead to pseudohyperglycaemia [23], whereas wet or sweaty hands could lead to a dilution effect with false low values. There are several additional factors leading to under- or overestimation of blood glucose values including incorrect storage of the strips, temperature, altitude, medication, haematocrit or sample volume [12, 24]. In addition, alternate site testing (forearm) can lead to glucose concentration differences compared to finger prick testing, because of a time lag in case of rapid blood glucose changes [25].
The strength of the present study is the independency from the manufacturers and thus reduction of bias by so called golden lots. Furthermore all measurements were performed with capillary blood from a single finger prick and analysed in a standardised procedure. All blood samples were collected by the same experienced person. Nevertheless, we have to acknowledge several limitations: (i) Since the present study was not industry funded we could only include a comparatively small number of patients. (ii) As reference method we used the HemoCue® Glucose 201+ system with conversion to plasma levels. This decision was based on a recent report that compared HemoCue® with the Yellow Springs Instrument (YSI 2300 STAT; YSI). This study suggests that HemoCue® and the YSI 2300 STAT, which has been used as reference in previous reports assessing SMBG devices in a clinical routine setting [20, 21], can be used interchangeably for research and clinical purposes [15]. Furthermore, using HemoCue® offered the possibility of performing all measurements immediately after finger pricking and with the same capillary drop of blood. (iii) Reliability of the measurements is particularly important for the assessment of blood glucose values in the lower range. This study provides only limited data about the performance of the glucose meters in the lower range. We can, therefore, not exclude the fact that the results might be slightly different with a higher incidence of blood glucose values in the hypoglycaemic range. (iv) Since an experienced person performed the blood sampling the present data reflect mainly the technical performance of the devices. Although, if the measurements are carried out according to the manufacture’s recommendation – and usually the patients are instructed to do so – these data are also valid in the clinical setting.
From a clinical point of view the three evaluated glucose meters provide sufficient agreement with the reference to warrant a save diabetic therapy when test strips and devices are obtained through regular supply channels. Overall, the Accu-Chek® and Free-Style® tended to slightly outperform the Contour® device. Provided that the measurement is carried out correctly, patients can rely on the results of all three devices, since they assure correct clinical decision making. Nevertheless patients should keep in mind that a mean deviation of about 7–10% must be expected.
Acknowledgments:We thank all the patients who agreed to participate in this study. In addition, we are grateful to Kathrin Wyttenbach and Barbara Gäumann for the technical support and Franziska Amiet and Jean-Marc Nuoffer for critically reviewing the data and the manuscript.
1 U.K. prospective diabetes study 16. Overview of 6 years’ therapy of type II diabetes: a progressive disease. U.K. Prospective Diabetes Study Group. Diabetes. 1995;44:1249–58.
2 The Diabetes Control and Complications Trial Research Group. The effect of intensive treatment of diabetes on the development and progression of long-term complications in insulin-dependent diabetes mellitus. N Engl J Med. 1993;329:977–86.
3 Haller MJ, Stalvey MS, Silverstein JH. Predictors of control of diabetes: monitoring may be the key. J Pediatr. 2004;144:660–1.
4 Levine BS, Anderson BJ, Butler DA, Antisdel JE, Brackett J, Laffel LM. Predictors of glycaemia control and short-term adverse outcomes in youth with type 1 diabetes. J Pediatr. 2001;139:197–203.
5 Strowig SM, Raskin P. Improved glycaemia control in intensively treated type 1 diabetic patients using blood glucose meters with storage capability and computer-assisted analyses. Diabetes Care. 1998;21:1694–8.
6 Schutt M, Kern W, Krause U, Busch P, Dapp A, Grziwotz R, Mayer I, Rosenbauer J, Wagner C, Zimmermann A, Kerner W, Holl RW. Is the frequency of self-monitoring of blood glucose related to long-term metabolic control? Multicenter analysis including 24,500 patients from 191 centres in Germany and Austria. Exp Clin Endocrinol Diabetes. 2006;114:384–8.
7 Ziegler R, Heidtmann B, Hilgard D, Hofer S, Rosenbauer J, Holl R. Frequency of SMBG correlates with HbA1c and acute complications in children and adolescents with type 1 diabetes. Pediatr Diabetes. 2011;12:11–7.
8 Allemann S, Houriet C, Diem P, Stettler C. Self-monitoring of blood glucose in non-insulin treated patients with type 2 diabetes: a systematic review and meta-analysis. Curr Med Res Opin. 2009;25:2903–13.
9 St John A, Davis WA, Price CP, Davis TM. The value of self-monitoring of blood glucose: a review of recent evidence. J Diabetes Complications. 2010;24:129–41.
10 Poolsup N, Suksomboon N, Rattanasookchit S. Meta-analysis of the benefits of self-monitoring of blood glucose on glycaemia control in type 2 diabetes patients: an update. Diabetes Technol Ther. 2009;11:775–84.
11 International Diabetes Federation (IDF): Diabetes Atlas, 5th edition. 2011
12 Ginsberg BH. Factors affecting blood glucose monitoring: sources of errors in measurement. J Diabetes Sci Technol. 2009;3:903–13.
13 ISO 15197:2003: In vitro diagnostic test systems requirement for blood glucose monitoring systems for self-testing in managing diabetes mellitus. Geneva: World Health Organisation. 2003
14 American Diabetes Association. Standards of medical care in diabetes – 2011. Diabetes Care. 2011;34 Suppl 1:S11–61.
15 Stork AD, Kemperman H, Erkelens DW, Veneman TF. Comparison of the accuracy of the HemoCue glucose analyzer with the Yellow Springs Instrument glucose oxidase analyzer, particularly in hypoglycaemia. Eur J Endocrinol. 2005;153:275–81.
16 Bland MJ, Altman DG. Statistical methods for assessing agreement between two methods of clinical measurement. Lancet. 1986;307–10.
17 Clarke WL, Cox D, Gonder-Frederick LA, Carter W, Pohl SL. Evaluating clinical accuracy of systems for self-monitoring of blood glucose. Diabetes Care. 1987;10:622–8.
18 Self-monitoring of blood glucose. American Diabetes Association. Diabetes Care. 1994;17:81–6.
19 Kuo CY, Hsu CT, Ho CS, Su TE, Wu MH, Wang CJ. Accuracy and precision evaluation of seven self-monitoring blood glucose systems. Diabetes Technol Ther. 2011;13:596–600.
20 Tack C, Pohlmeier H, Behnke T, Schmid V, Grenningloh M, Forst T, Pfutzner A. Accuracy evaluation of five blood glucose monitoring systems obtained from the pharmacy: a European multicenter study with 453 subjects. Diabetes Technol Ther. 2011
21 Freckmann G, Baumstark A, Jendrike N, Zschornack E, Kocher S, Tshiananga J, Heister F, Haug C. System accuracy evaluation of 27 blood glucose monitoring systems according to DIN EN ISO 15197. Diabetes Technol Ther. 2010;12:221–31.
22 Consensus statement on self-monitoring of blood glucose. Diabetes Care. 1987;10:95–9.
23 Hirose T, Mita T, Fujitani Y, Kawamori R, Watada H. Glucose monitoring after fruit peeling: pseudohyperglycaemia when neglecting hand washing before fingertip blood sampling: wash your hands with tap water before you check blood glucose level. Diabetes Care. 2011;34:596–7.
24 Arabadjief D, Nichols JH. Assessing glucose meter accuracy. Curr Med Res Opin. 2006;22:2167–74.
25 Ellison JM, Stegmann JM, Colner SL, Michael RH, Sharma MK, Ervin KR, Horwitz DL. Rapid changes in postprandial blood glucose produce concentration differences at finger, forearm, and thigh sampling sites. Diabetes Care. 2002;25:961–4.
Funding / potential competing interests: P. Diem has recieved fees for speaking engagements and advisory boards from Bayer and Roche Diagnostics as well as research support from Roche Diagnostics.
Authors’ contribution: T. Zueger and V. Schuler contributed equally to this study.