Figure 1
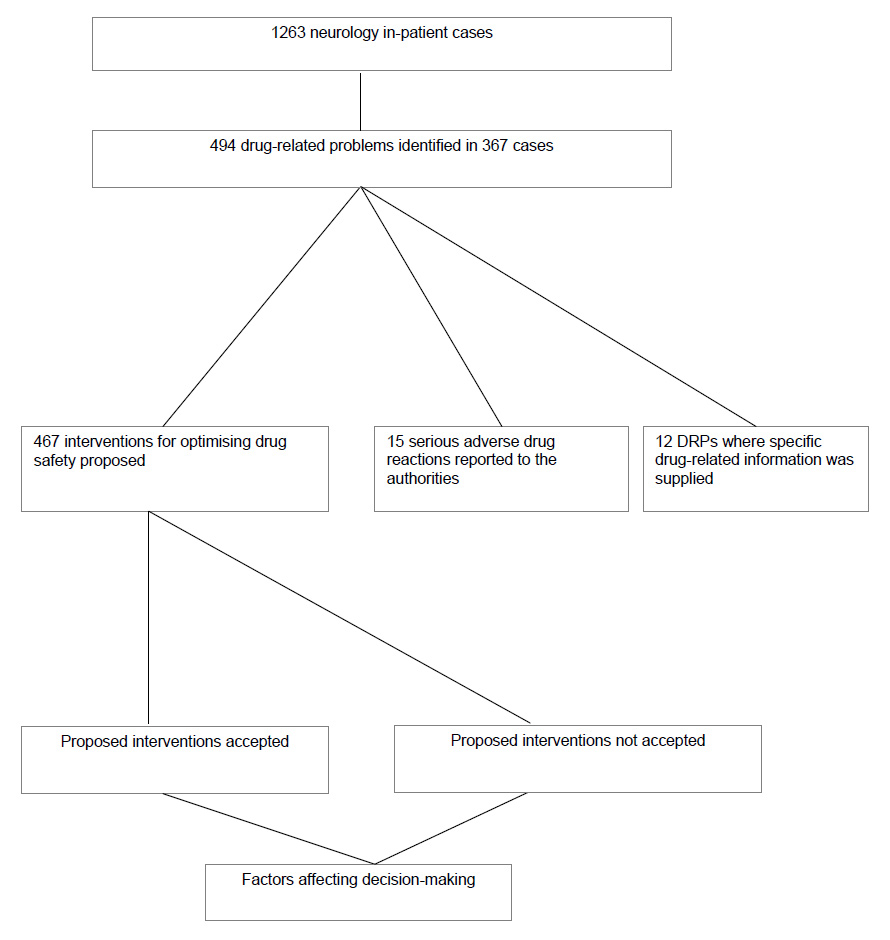
Study flow-chart.
DOI: https://doi.org/10.4414/smw.2012.13615
Clinical pharmacologist- and clinical pharmacist-led services for improving medication-safety in hospitals and in the community have been shown to improve both patient- and cost-related outcomes [1–3]. These services have been well described for ambulatory and hospitalised internal medicine, intensive care unit, family practice, surgery, psychiatry and geriatric patients. The success of such services depends on a number of factors including the accurate identification of drug-related problems (DRPs), appropriate suggestions about how these might be avoided and the acceptance and implementation of these suggestions by the treating medical practitioners. Clinical pharmacologists and pharmacists must concentrate on all three of these aspects to ensure a benefit for patients.
The nature of DRPs among patients hospitalised with neurological conditions has not been previously documented. Furthermore, little is known about factors affecting the acceptance of clinical pharmacologists’ and clinical pharmacists’ recommendations by treating physicians. We have previously shown that the use of electronic prescription charts is one factor which aids both in the identification of DRPs and the subsequent implementation of recommendations for improving drug safety among hospitalised patients [4].
We therefore conducted a study in neurology inpatients for which electronic prescribing was exclusively employed with an aim to characterise the types of DRPs and to study additional factors which might affect the acceptance of recommendations for improving drug safety.
Neurology inpatients on two separate wards in a large Swiss university hospital were assessed for drug-related problems (DRPs) on weekly consultant neurologist ward rounds by two clinical pharmacologists and a pharmacist between September 2009 and September 2010. All patients were cared for using integrated electronic medical records (with electronic prescribing). An additional feature of the electronic prescription chart was the electronic drug interactions check programme supplied by Pharmavista® [5]. This programme assessed potential drug-drug interactions and graded these according to required intervention (based on the Operational Classification of Drug Interactions by Hansten et al. [6]) only when requested to do so by the prescriber; it did not flag up potential problems automatically. It was not possible to determine whether or how often the interactions programme was used by the prescribing physicians. Other than the voluntary drug interactions check, no electronic clinical decision support (regarding dosing, for example) was embodied in the electronic prescription chart. Patients who remained in hospital for more than one week or who were readmitted were assessed each time, however, only new DRPs were commented upon. DRPs which had previously been commented upon, but the suggested intervention not implemented, were not commented upon again. This was to avoid over-alerting and also had the advantage that the same problems were not counted twice (and therefore not over-represented) at the time of data analysis. Unlike in our previous study where only regularly administered medication was commented upon [4], this study assessed for DRPs in both “regular” and “as required” medication (given on a “pro re nata” or “PRN” basis).
DRPs were defined according to the Pharmaceutical Care Network Europe (PCNE) Classification for Drug-related problems version 6.2 (revised 14.01.2010), which defines a drug-related problem as “an event or circumstance involving drug therapy that actually or potentially interferes with desired health outcomes” [7]. DRPs were identified and proposals for optimising drug safety were given to the treating neurologists face-to-face on the ward round and again later the same day in the form of electronic notes (checked by the two senior clinical pharmacologists in the team) in the patient records. Clinical pharmacologists and pharmacists accessed internet based databases including Swiss, German and American product information, PubMed, the Pharmavista® tool and Micromedex® Healthcare Series [8].
All the detected DRPs, their causes and proposed interventions were then retrospectively classified according to the PCNE classification system for reporting purposes. The PCNE classification system has a number of limitations, however. The large number of variables (n = 64 for problems, causes and interventions) makes statistical analyses and comparisons difficult and it does not include the exact nature of the intervention proposed by the clinical pharmacologist or pharmacist to ameliorate or minimise the DRP. We therefore devised a simpler classification system based on the PCNE for the purposes of determining factors which were positively and negatively associated with the implementation of clinical pharmacologists’ proposals (table 1).
The outcome measures were the types of DRP, the recommendations made by clinical pharmacologists and the number of these recommendations which were implemented by the treating neurologists. Factors at the prescription-, DRP-, causality- and intervention-levels potentially associated with proposal acceptance were studied. Drug-drug interactions were categorised according to Pharmavista®, where “1” and “2” denote interactions with a high potential for subsequent adverse outcome (so called “severe” interactions) and “3”, “4” and “5” represent interactions of lesser clinical importance [5]. Univariate analyses taking clustering by patient and ward into account were performed using generalised estimating equations (GEE) and odds ratios generated. Each patient within each ward was treated as a separate cluster and we included clinic and ward as explanatory variables. Robust standard errors from the GEE model were then extracted to compute a confidence interval for the resulting odds ratio of interest. Of note, standard errors from a GEE are also valid if the underlying correlation structure is not correctly specified by our model assumptions. Factors which were positively associated with the primary outcome measure were then used to build a multivariable logistic regression model to assess for the independent effects of these factors on increasing proposal acceptance. A second model, using factors which were negatively associated with the primary outcome measure was constructed in a similar fashion. Both multivariable models were adjusted for dependence on patient and ward using GEE, and also adjusted for ward as an explanatory variable in order to remove any potential source of bias by ward. The latter was important as the patients on the two wards were cared for by different neurologists and their DRPs were consistently assessed by one clinical pharmacologist on one ward and another clinical pharmacologist together with a pharmacist on the other ward. All analyses were performed using R (R Development Core Team, 2010) using the package “geepack” [9].
| Table 1: Acceptance of proposed interventions grouped according to the type of prescription, type of drug-related problem, underlying cause and proposed intervention. Odds ratios are adjusted for potential dependence on ward and patient. | ||||
| Entire group | Accepted (%) | Not accepted | Odds ratio for acceptance (95% confidence interval) | |
| N | 467 | 289 (62) | 178 | |
| Type of drug prescription involved in the proposed intervention: | ||||
| “Regular” prescriptions only | 274 | 195 (71) | 79 | 2.57 (1.73–3.80) |
| At least one “as required” agent | 193 | 94 (49) | 99 | 0.39 (0.26– 0.58) |
| Homeopathic or herbal remedies | 6 | 6 (100) | Infinity | |
| At least one anticoagulant or antiplatelet agent | 50 | 38 (76) | 12 | 1.98 (1.02– 3.84) |
| At least one antihypertensive agent | 46 | 30 (65) | 16 | 1.11 (0.61– 2.02) |
| At least one antidiabetic agent | 11 | 7 (64) | 4 | 1.29 (0.49–3.42) |
| Problems | ||||
| Lack of efficacy | 13 | 10 (77) | 3 | 2.04 (0.60–6.92) |
| Potential lack of efficacy | 66 | 45 (68) | 21 | 1.32 (0.78–2.22) |
| Adverse drug event | 59 | 47 (80) | 12 | 2.56 (1.29–5.06) |
| Potential adverse drug event | 319 | 184 (58) | 135 | 0.58 (0.38–0.89) |
| Cost-issue | 10 | 3 (30) | 7 | 0.32 (0.09–1.19) |
| Causes | ||||
| Known side-effect of drug(s) | 76 | 56 (74) | 20 | 1.85 (1.06–3.22) |
| Dose problem | 69 | 39 (57) | 30 | 0.77 (0.46–1.03) |
| Duplication of therapeutic class | 8 | 4 (50) | 4 | 0.69 (0.15–3.21) |
| Prescribing error | 26 | 16 (62) | 10 | 1.03 (0.45–2.37) |
| Error in documentation of allergies | 33 | 14 (42) | 19 | 0.45 (0.19–1.05) |
| Suboptimal choice of drug formulation | 20 | 8 (40) | 12 | 0.44 (0.18–1.07) |
| Interaction | 182 | 119 (65) | 63 | 1.23 (0.84–1.80) |
| – Proposed intervention involved alteration of a drug combination graded as level 1 or 2* | 24 | 20 (83) | 4 | 3.22 (1.07–9.69) |
| – Proposed intervention involved alteration of a drug combination graded as level 3, 4 or 5* | 110 | 69 (63) | 41 | 1.02 (0.65–1.6) |
| Indication (untreated indication or indication for a current treatment requiring reassessment) | 14 | 10 (71) | 4 | 1.48 (0.45–4.83) |
| Contraindicated | 38 | 22 (58) | 16 | 0.88 (0.43–1.78) |
| Unknown cause | 1 | 1 (100) | n/a | |
| Proposed intervention | ||||
| Change drug | 40 | 32 (80) | 8 | 2.71 (1.17–6.25) |
| Change drug formulation | 21 | 8 (38) | 13 | 0.40 (0.16–0.97) |
| Documentation of allergies | 34 | 14 (41) | 20 | 0.32 (0.15–0.72) |
| Dose reduction | 119 | 72 (61) | 47 | 0.97 (0.63–1.51) |
| Patient monitoring | 71 | 48 (68) | 23 | 1.23 (0.74–2.05) |
| Start drug | 14 | 8 (57) | 6 | 0.78 (0.28–2.23) |
| Stop drug | 114 | 77 (68) | 37 | 1.39 (0.86–2.14) |
| Therapeutic drug monitoring | 17 | 10 (59) | 7 | 0.85 (0.32–2.22) |
| Timing of drug administration | 37 | 20 (54) | 17 | 0.72 (0.35–1.45) |
| * Pharmavista did not report on 48 additional interactions which were detected by the clinical pharmacologists. | ||||
Eighty-four ward rounds were attended and 1263 inpatient cases assessed for the presence of drug-related problems (fig. 1). In total 494 DRPs involving 704 individual drug prescriptions in 367 inpatient cases (median age 68.7 years, interquartile range 57.0–77.8 years) were identified. The principal diagnoses at admission were confirmed or suspected cerebral ischaemia or intracerebral bleeding (n = 145, 40%), Parkinson’s syndrome or extrapyramidal symptoms (n = 32), epilepsy (n = 29), primary or secondary brain tumours (n = 20), multiple sclerosis (n = 9), infectious nervous system disorders (n = 8), dementia (n = 7), essential tremor (n = 6), gait disturbance (n = 5), chronic headaches (n = 4) and chronic pain syndrome (n = 4). The remaining 98 patients had rarer diagnoses (less than 4 cases per diagnosis).
Figure 1
Study flow-chart.
Twenty-nine percent of the studied inpatient cases demonstrated one or more DRPs. Interventions were proposed for 467 (95%) DRPs. No intervention was proposed for the remaining 27 DRPs, as these were either related to serious adverse drug reactions for which the offending drug had already been discontinued (n = 15) or related to the need for additional information regarding individual pharmacotherapy (n = 12) (fig. 1).
There were 17 cases where an adverse drug reaction (ADR) was judged to have occurred, representing 1.3% of the cases studied. Fourteen of these were classified as non-allergic and 3 allergic. The ADRs were intracerebral bleeding (phenprocoumon n = 2, aspirin n = 2), sinus vein thrombosis (hormonal contraception n = 3) and one case each of retroperitoneal bleeding (valproate and phenprocoumon), acute renal failure (acyclovir), hepatotoxicity (amoxicillin/clavulanic acid), lithium toxicity, stroke (celecoxib), herpes simplex meningoencephalitis (etanercept), rash and liver enzyme increase (lamotrigin), unclear weakness (H1N1 vaccination), haemolytic anaemia (human immunoglobulin) and extrapyramidal syndrome (risperidone). Drug-related problems were the cause of admission to the neurology unit in 10 cases (representing 0.8% of all cases studied).
The drugs most frequently implicated are listed in table 2 and included analgesics, antiplatelet agents, anticonvulsants, lipid-lowering medication, proton-pump inhibitors and night-sedation. The types of DRPs, their causes and the resulting interventions carried out by the treating physicians classified according to the Pharmaceutical Care Network Europe (PCNE) Classification for Drug-related problems version 6.2 (revised 14.01.2010) [7] are shown in table 3. The table also shows the distribution of these parameters according to implementation of proposed recommendations. 289 (62%) of the 467 proposed interventions were implemented by the treating neurologists. The commonest drug-drug interactions are given in table 4 along with interaction severity grade and implementation. Drugs for which all, none, greater than 50% or less than 50% of recommendations were carried out are listed in table 5.
| Table 2: Top 10 drugs featuring in the 494 drug-related problems (in total 704 drug prescriptions were involved in the drug-related problems). | |||
| Drug | Class | Number | Percentage of prescriptions |
| Zolpidem | Sedative | 62 | 8.8% |
| Paracetamol | Antipyretic/analgesic | 48 | 6.8% |
| Aspirin | Antiplatelet agent | 28 | 4% |
| Phenytoin | Anticonvulsant | 23 | 3.3% |
| Atorvastatin | Lipid lowering agent | 22 | 3.1% |
| Diclofenac | Antipyretic/analgesic | 21 | 3% |
| Clopidogrel | Antiplatelet agent | 20 | 2.9% |
| Esomeprazole | Proton pump inhibitor | 18 | 2.6% |
| Ibuprofen | Antipyretic/analgesic | 17 | 2.4% |
| Carbamazepine | Anticonvulsant | 16 | 2.3% |
| Domperidone* | Antiemetic | 16 | 2.3% |
| *Dopamine antagonist, not licensed in USA | |||
| Table 3: Classification of the 494 drug-related problems according to Pharmaceutical Care Network Europe Classification for Drug-Related Problems Version 6.2. | ||||
| Characteristic | Entire group | No proposal made | Proposal accepted | Proposal not accepted |
| Number of drug-related problems | 494 | |||
| Number of proposals | 467 | 27 | 289 | 178 |
| The Problem | ||||
| P1: Treatment effectiveness: There is a (potential) problem with the (lack of) effect of the pharmacotherapy. | ||||
| P1.1 No effect of drug treatment/therapy failure P1.2 Effect of drug treatment not optimal P1.3 Wrong effect of drug treatment P1.4 Untreated indication | 5 (all manifest) 78 (2 manifest) 0 8 | 2 10 0 0 | 3 47 0 5 | 0 21 0 3 |
| P2: Adverse reactions: Patient suffers, or will possibly suffer, from an adverse drug event. | ||||
| P2.1 Non-allergic P2.2 Allergic P2.3 Toxic | 27 (14 manifest) 41 (3 manifest) 321 | 8 2 5 | 14 16 199 | 5 23 117 |
| P3: Treatment costs: | ||||
| P3.1 Drug treatment more costly than necessary P3.2 Unnecessary drug treatment | 10 4 | 0 0 | 3 2 | 7 2 |
| The Cause | ||||
| C1: Drug selection | ||||
| C1.1 Inappropriate drug (including contra-indicated) C1.3 Inappropriate combination of drugs C1.4 Inappropriate duplication of therapeutic group or active ingredients C1.5 Indication for drug-treatment not noticed C1.7 More cost-effective drug available C1.8 Synergistic/preventive drug required and not given C1.9 New indication for drug treatment presented | 61 50 30 5 10 8 1 | 0 0 0 0 0 0 0 | 38 34 19 3 3 6 0 | 23 16 11 2 7 2 1 |
| C2: Drug form | ||||
| C2.1 Inappropriate drug form | 11 | 5 | 6 | |
| C3: Dose selection | ||||
| C3.1 Drug dose too low C3.2 Drug dose too high C3.3 Dosage regimen not frequent enough C3.4 Dosage regimen too frequent C3.5 No therapeutic drug monitoring C3.6 Pharmacokinetic problem requiring dose adjustment | 1 22 1 5 15 120 | 1 0 0 0 0 9 | 0 17 0 2 8 66 | 0 5 1 3 7 45 |
| C5: Drug use process | ||||
| C5.1 Inappropriate timing of administration and/or dosing intervals | 28 | 18 | 10 | |
| C8: Other | ||||
| C8.1 Other cause* C8.2 No obvious cause | 126 | 17 | 70 | 39 |
| The Intervention | ||||
| I0.0: No intervention | 27 | 27 | – | – |
| I1. At prescriber level | ||||
| I1.1 Prescriber informed only I1.2 Prescriber asked for information I1.3 Intervention proposed, approved by Prescriber I1.4 Intervention proposed, not approved by Prescriber I1.5 Intervention proposed, outcome unknown | 12 0 289 178 0 | – – – – – | – – – – – | – – – – – |
| I3: At drug level | ||||
| I3.1 Drug changed I3.2 Dose changed I3.3 Formulation changed I3.4 Instructions for use changed I3.5 Drug stopped I3.6 New drug started | 34 70 8 19 78 8 | – – – – – – | 34 70 8 19 78 8 | – – – – – – |
| I4: Other intervention or activity | ||||
| I4.1 Other intervention** I4.2 Side effect reported to authorities | 72 15 | – – | 72 | – – |
| * Predictable adverse reactions were classified under this heading** Other interventions consisted of therapeutic drug monitoring, documentation of allergies and patient monitoring.The Problems:The CausesThe Interventions | ||||
Factors potentially influencing the implementation of recommendations could be grouped into the following categories: (1.) type of medication-prescription, (2.) nature or type of DRP, (3.) cause of DRP and (4.) recommended intervention for minimising the DRP (table 1). Univariate analysis taking potential clustering around patient and ward into account showed prescriptions involving only regularly administered drugs, prescriptions involving at least one anticoagulant or one antiplatelet agent, DRPs which were adverse drug events, DRPs which caused manifestation of a known drug side-effect, DRPs caused by a grade 1 or 2 drug-drug interaction and interventions involving changing a drug were all associated with an increased likelihood of implementing the clinical pharmacologists’ and pharmacists’ recommendations (table 1). Similarly, factors associated with a reduced chance of implementation were prescriptions involving a drug given on an “as required” basis, a DRP which had the potential to cause an adverse drug event, recommendations to change the administered drug formulation and recommendations to document drug allergies and intolerances in the appropriate place (table 1 – see Methods for definition of interaction grades).
While 71% of recommendations involving “regular” medication were implemented, only 49% of recommendations involving at least one “as required” medication were accepted. Multivariate analysis showed the type of prescription (whether for “regular” or “as required” medication) was the sole independent determinant of acceptance. After adjustment for the factors positively associated with implementation shown in table 1 and adjustment for ward, the odds ratio for “regular” medication was 2.31 (95% CI 1.51–3.53). After adjustment for the factors which were negatively associated with implementation (table 1) and adjustment for ward, the odds ratio for “as required” medication was 0.47 (95% CI 0.3–0.73) (table 6). The entire multivariable model and the associated adjusted odds-ratios and p-values are shown in table 6.
There were 38 cases where a contraindicated drug-therapy was prescribed. In twenty-two cases prescriptions were changed on the basis of our recommendations and included all recommendations regarding contraindicated drug-drug combinations. Recommendations which were not implemented were where the product information cited underlying conditions or diseases as precluding drug use such as tramadol or metoclopramide in epilepsy (n = 5), ACE inhibitor, nonsteroidal anti-inflammatory drugs, eplerenone or metformin in renal impairment (n = 6), anticoagulation in the setting of thrombocytopenia or recent history of bleeding (n = 2), metamizole in the setting of agranulocytosis (n = 1), domperidone in the setting of QTc prolongation (n = 1) and reserpine in the setting of depression (n = 1).
Although not systematically examined for the purposes of this study, there were examples where implementation of the proposed intervention led to a clear benefit for the patient during the period of hospitalisation. This included a case where symptomatic hypoglycaemia developed after the introduction of a fibrate to on-going glibenclamide therapy. On conversion of the fibrate to a statin as recommended, no further hypoglycaemic events occurred. In a further case an elevation in serum transaminases normalised after the recommended atorvastatin dose reduction was carried out.
| Table 4: Ten commonest drug-drug interactions and implementation of the resulting suggestions. The total number of detected drug-drug interactions for which interventions were proposed was 182. | ||||
| Interacting drugs | Potential consequence | Severity grade* | Number of cases (% total interactions) | Number of proposals accepted |
| Clopidogrel – esomeprazole | Reduction in clopidogrel efficacy | 2 | 15 (8.2) | 14 |
| Aspirin – ibuprofen | Reduction in aspirin efficacy | 3 | 13 (7.1) | 8 |
| Phenytoin – paracetamol | Increased paracetamol-induced hepatotoxicity | 4 | 12 (6.6) | 7 |
| Zolpidem – lorazepam | Over-sedation | ** | 9 (4.9) | 5 |
| Levothyroxine – cations (calcium, magnesium) | Reduction in levothyroxine absorption | 3 | 8 (4.4) | 4 |
| Carbamazepine – paracetamol | Increased paracetamol-induced hepatotoxicity | 4 | 7 (3.8) | 3 |
| Domperidone – atypical neuroleptics | Increased risk of Torsades de Pointes | 3 | 7 (3.8) | 4 |
| Amiodarone – atorvastatin | Increased atorvastatin toxicity (rhabdomyolysis) | 3 | 5 (2.7) | 4 |
| Ciprofloxacin – olanzapine | Increased risk of Torsades de Pointes | 5 | 3 (1.6) | 2 |
| Phenobarbital – paracetamol | Increased paracetamol-induced hepatotoxicity | 4 | 2 (1.1) | |
| Valproate – topiramate | Risk of hyperammonaemia | 3 | 2 (1.1) | 2 |
| Metformin – radioopaque contrast medium | Risk of acute renal failure and lactic acidosis | ** | 2 (1.1) | 2 |
| * Grade 1 = Contraindicated drug combination; grade 2 = relatively contraindicated drug combination; grade 3 = this drug combination requires dose adjustment and/or monitoring for adverse drug reactions; grade 4 = in patients with risk factors, this drug combination requires dose adjustment and/or monitoring for adverse drug reactions; grade 5 = this drug combination requires monitoring for adverse drug reactions. | ||||
| Table 5: Acceptance of recommendation according to the drugs involved in the drug-related problems. Only drugs which featured in more than 1 drug-related problem are shown. | |||
| All recommendations accepted | At least 50% of recommendations accepted | Less than 50% of recommendations accepted | No recommendations accepted |
| Aciclovir | Acetaminophen | Citalopram | Amitriptylline |
| Aldactone | Amiodarone | Dalteparin | Azathioprine |
| Alendronate | Amoxicillin/clavulanate | Domperidone | Betainterferon |
| Amiloride | Aspirin | Hydrochlorothiazide | Finasteride |
| Amphotericin | Atorvastatin | Levothyroxine | Paraffin fecal softener |
| Escitalopram | Calcium supplements | Phenobarbital | |
| Folic acid | Captopril | Primidone | |
| Gingko biloba | Carbamazepine | Trimipramine | |
| Indapamide | Celecoxib | ||
| Iodine-containing radioopaque contrast medium | Ciprofloxacin | ||
| Levetiracetam | Clopidogrel | ||
| Oxcarbazepine | Clozapine | ||
| Phosphate-based bowel preparation | Diclofenac | ||
| Potassium supplements | Enalapril | ||
| Quetiapine | Enoxaparin | ||
| Saccharomyces boulardii | Esomeprazole | ||
| Simvastatin | Ibuprofen | ||
| Topiramate | Indomethacin | ||
| Valsartan | Lisinopril | ||
| Lithium | |||
| Lorazepam | |||
| Magnesium supplements | |||
| Metamizole | |||
| Metformin | |||
| Metoclopramide | |||
| Mirtazapine | |||
| Morphine | |||
| Olanzapine | |||
| Perindopril | |||
| Phenprocoumon | |||
| Phenytoin | |||
| Pipamperone | |||
| Ramipril | |||
| Rasagiline | |||
| Tamsulosin | |||
| Tizanidine | |||
| Tramadol | |||
| Trazodone | |||
| Trimethoprim/sulfamethoxazole | |||
| Valproate | |||
| Venlafaxine | |||
| Zolpidem | |||
| Table 6: Multivariate models for factors A) positively and B) negatively affecting implementation of proposed interventions. | ||
| Factor | Adjusted odds ratio (95% confidence interval)* | p value |
| A Positive model: Proposed intervention involved: A drug which was given regularly | 2.31 (1.51–3.53) | 0.00011 |
| At least one anticoagulant or antiplatelet agent | 1.30 (0.61–2.77) | 0.5 |
| A drug which had caused an adverse drug event** | 2.08 (0.84–5.17) | 0.1 |
| A drug which had caused the patient to suffer a known side-effect of that drug** | 0.90 (0.43–1.89) | 0.8 |
| A drug which had led to a grade 1 or 2 drug-drug interaction | 1.46 (0.42–5.08) | 0.6 |
| Changing a drug | 2.26 (0.92–5.56) | 0.08 |
| B Negative model: Proposed intervention involved: A drug which was given as required | 0.47 (0.3–0.73) | 0.0007 |
| A drug potentially leading to an adverse drug event | 0.76 (0.47–1.21) | 0.2 |
| A drug which had led to a grade 3, 4 or 5 drug-drug interaction | 0.90 (0.56–1.43) | 0.7 |
| Changing the administered drug formulation | 0.39 (0.15–1.02) | 0.06 |
| Documentation of drug allergies and intolerances | 0.50 (0.21–1.21) | 0.1 |
| * adjusted for potential dependence on patient ward ** the difference between these two is the level of the parameter – the adverse drug event described the problem itself, while a known side-effect of the drug described the underlying cause of a problem. While there is necessarily large overlap, the parameters are not the same. | ||
This study describes the role of clinical pharmacologists and clinical pharmacists in the detection and avoidance of DRPs among neurology inpatients. Twenty-nine percent of cases demonstrated at least one DRP. This compares more favourably with the 80% seen in a large study of 827 patients hospitalised with internal medical or rheumatological conditions [10] and a study of geriatric inpatients which found a DRP prevalence of 78% [11]. Both these latter studies defined DRPs according to the PCNE system as in the current study, however, DRPs were solely detected through chart reviews and not attendance on ward rounds. It is likely that attendance on ward rounds enables a more accurate identification of clinically relevant DRPs, which could be an explanation for the lower DRP prevalence seen in our study. In attending ward rounds, clinical pharmacologists and pharmacists are able to gain an insight into the patient case as a whole and can thereby provide patient-specific recommendations and avoid false positive DRP detection.
It is well known that the vast majority of DRPs are avoidable, as we also found in this study. Root causes of the DRPs in this patient group were not specifically analysed but were likely to have been due in part to continued prescription of problematic drug regimes initiated prior to hospital admission, switching to “hospital list” medication and thereby causing a new drug-drug interaction and use of standardised prescriptions for “as required” medication (a function facilitated by electronic prescribing). This latter aspect accounts for the high number of DRPs arising from “as required” prescriptions for zolpidem and paracetamol for example, in which dose adjustment for age or the presence of concomitant enzyme-inducing agents are not automatically carried out.
The adverse drug reaction frequency of 1.3% was smaller than in our previous study of medical inpatients admitted to the same hospital (3.7%) [4] but in keeping with a previous study in internal medicine and surgery inpatients (1.7%) [12]. A recent review of DRPs in hospitals has collated data from a number of studies reporting the frequency of ADRs detected and found a range of 1.3 to 60.7% [13]. The data presented here clearly lie at the lower limit of this range and may reflect the fact that the patients were being cared for in a specialist unit. Adverse drug reactions as the cause for admission (0.8%) were also fewer than in other observational studies conducted in Switzerland (4.1% of admissions to internal medicine wards in a study conducted between 1996 and 2000) [14]. Another large study conducted in the UK found 5.2% of all hospital admissions to be directly related to an ADR with the most common cause for an ADR-related admission being gastrointestinal bleeding [15]. The lower prevalence of ADRs as the cause of admission in our study most likely reflects the fact that adverse drug events less commonly present as an isolated neurological problem requiring specialist neurologist care (sinus vein thrombosis in association with hormonal contraception being a notable exception).
DRPs arose mainly in medication not specifically licensed for the treatment of neurological conditions (table 2). Seventy-nine percent of the drugs where all recommendations were implemented (15 out of 19) were not ones primarily prescribed for the treatment of a neurological condition (table 5). These observations not only provide evidence for good pharmaceutical practice in the speciality but also provide evidence that clinical pharmacologists and pharmacists can contribute significantly to non-speciality aspects of patient pharmacotherapeutics.
The acceptance of recommendations for improving medication-safety in this study of neurology inpatients was 62% which is in line with our previous study of hospitalised medical inpatients cared for using electronic prescription charts [4]. For drugs administered regularly, the acceptance was 71%, while for drugs administered on an “as required” basis the acceptance was significantly lower at 49%; this association remained after adjustment for other univariate factors, most likely reflecting the study power for this variable conferred by the large numbers (247 regular prescriptions and 193 “as required”). Nonetheless, examination of factors which were associated with increased acceptance and those associated with decreased acceptance provide interesting information. Recommendations regarding a potential adverse event, for example, were less likely to be implemented and could signal over-alerting. High-risk drug-drug interactions, on the other hand, were more likely to be implemented and are a good example of where a clinical pharmacologist can bring specialist knowledge to patient care.
It is known from studies of electronic clinical decision support systems that over-alerting is associated with overriding of recommendations for improving drug safety, particularly as the alerts are often not clinically relevant [16–18]. Indeed as many as 91% of electronically generated alerts pertaining to drug-drug interactions may be ignored [16]. The danger in such cases is that important, clinically relevant drug-related problems are missed and the appropriate action to stop or prevent adverse events is not taken when it should be. By providing a physician- and/or pharmacist-led service for flagging-up relevant drug-related problems and providing suggestions for avoiding these, situations such as the latter should hopefully be avoided. Indeed, while electronic decision support appears to have a very low implementation, face-to-face clinical pharmacist interventions have been associated with rates as high as 83% for general medical hospital inpatients [19] and 96% for outpatients attending a specialist hypertension clinic [20]. These studies were however smaller than the current study and it is not clear whether “regular” and “as required” medication or solely “regular” medication was commented upon. The acceptance rate in specialist neurology units has not been formally assessed and reported before.
Clinical pharmacologists’ and clinical pharmacists’ recommendations for improving medication-safety ought to focus on the likelihood of outcomes in order to alert clinicians appropriately about potential adverse drug events. For drugs which are prescribed to be administered on an “as required” basis, the likelihood of outcomes is by definition low, as the exposure is low compared to drugs which are given daily.
In order to improve the implementation of recommendations for improving medication-safety, the underlying processes need to be considered. De Almeida Neto and Chen have reviewed the likely role of the treating-physicians’ psychological “reactance” to recommendations by clinical pharmacists [21]. Reactance is defined as “a reaction to a recommendation to take a certain course of action which is affected by a motivational state compelling a response in which freedom of choice is maintained” [21]. The greater the number of seemingly non-beneficial recommendations, the greater the physicians’ reactance to them is likely to be. One method of reducing reactance would be to restrict recommendations to those with the highest clinical relevance and most likely benefit. A further method, as suggested by de Almeida Neto is to provide prescribing physicians with choices, so that their sense of freedom of choice is maintained [21].
Being carried out over 12 consecutive months could mean that a learning effect of the neurologists cannot be ruled out. However, we do not think this played a significant role as the junior physicians, who have the main prescribing role, changed positions in 3 to 6 month cycles and their supervising seniors changed positions in 6 to 9 month cycles. A further limitation is the lack of systematic long-term follow-up data regarding the effect of clinical pharmacologist-initiated interventions and patient outcome. Whether the study findings are likely to be generalisable to other patient settings, other clinical pharmacology and clinical pharmacist services and other prescribers is not apparent. There was also a power-dominance of the “regular” and “as-required” prescriptions in the multivariable analysis in this study. Further, larger studies in different settings focussing particularly on regular prescriptions are warranted in order to more accurately determine factors affecting prescriber decision-making to accept or reject clinical pharmacologists’ and clinical pharmacists’ recommendations.
Clinical pharmacologists and pharmacists can play an important role in identifying DRPs and optimising medication-safety among neurology inpatients. Their recommendations for optimising medication-safety are most likely to be accepted for regular prescriptions, prescriptions associated with an adverse event and high-risk drug combinations.
1 Bladh L, Ottosson E, Karlsson J, et al. Effects of a clinical pharmacist service on health-related quality of life and prescribing of drugs: a randomised controlled trial. BMJ Qual Saf. 2011;20:738–46.
2 Westerlund T, Marklund B. Assessment of the clinical and economic outcomes of pharmacy interventions in drug-related problems. J Clin Pharm Ther. 2009;34:319–27.
3 Kaboli PJ, Hoth AB, McClimon BJ, et al. Clinical pharmacists and inpatient medical care: a systematic review. Arch Intern Med. 2006;166:955–64.
4 Taegtmeyer AB, Curkovic I, Rufibach K, et al. Electronic prescribing increases uptake of clinical pharmacologists’ recommendations in the hospital setting. Br J Clin Pharmacol. 2011;72:958–64
5 http://www.pharmavista.ch/content/default.aspx accessed 18th October 2010
6 Hansten PD, Horn JR, Hazlet TK. ORCA: OpeRational ClassificAtion of drug interactions. J Am Pharm Assoc. (Wash) 2001;41:161–5.
7 Classification for Drug-Related Problems V6.2 (revised 14-01-2010) http://www.pcne.org/sig/drp/documents/drp/PCNE%20classification%20V6-2.pdf. Pharmaceutical Care Network Europe Foundation [November 2011]
8 Micromedex® Healthcare Series, Thomson Reuters, Greenwood Village, Colorado (Edition expired 2010).
9 Halekoh U, Hojsgaard S, Yan J. The R Package geepack for Generalized Estimating Equations. J Stat Softw. 2006;15:1–11.
10 Blix HS, Viktil KK, Reikvam A, et al. The majority of hospitalised patients have drug-related problems: results from a prospective study in general hospitals. Eur J Clin Pharmacol. 2004;60:651–8.
11 Chan DC, Chen JH, Kuo HK, et al. Drug-related problems (DRPs) identified from geriatric medication safety review clinics. Arch Gerontol Geriatr. 2012;54:168–74.
12 Bjornson DC, Hiner WO, Jr., Potyk RP, et al. Effect of pharmacists on health care outcomes in hospitalized patients. Am J Hosp Pharm. 1993;50:1875–84.
13 Krahenbuhl-Melcher A, Schlienger R, Lampert M, et al. Drug-related problems in hospitals: a review of the recent literature. Drug Saf. 2007;30:379–407.
14 Hardmeier B, Braunschweig S, Cavallaro M, et al. Adverse drug events caused by medication errors in medical inpatients. Swiss Med Wkly. 2004;134:664–70.
15 Pirmohamed M, James S, Meakin S, et al. Adverse drug reactions as cause of admission to hospital: prospective analysis of 18 820 patients. BMJ. 2004;329:15–9.
16 Isaac T, Weissman JS, Davis RB, et al. Overrides of medication alerts in ambulatory care. Arch Intern Med. 2009;169:305–11.
17 Mille F, Schwartz C, Brion F, et al. Analysis of overridden alerts in a drug-drug interaction detection system. Int J Qual Health Care. 2008;20:400–5.
18 Guzek M, Zorina OI, Semmler A, et al. Evaluation of drug interactions and dosing in 484 neurological inpatients using clinical decision support software and an extended operational interaction classification system (Zurich Interaction System). Pharmacoepidemiol Drug Saf. 2011;20:930–8.
19 Lampert ML, Kraehenbuehl S, Hug BL. Drug-related problems: evaluation of a classification system in the daily practice of a Swiss University Hospital. Pharm World Sci. 2008;30:768–76.
20 Von Muenster SJ, Carter BL, Weber CA, et al. Description of pharmacist interventions during physician-pharmacist co-management of hypertension. Pharm World Sci. 2008;30:128–35.
21 de Almeida Neto AC, Chen TF. When pharmacotherapeutic recommendations may lead to the reverse effect on physician decision-making. Pharm World Sci. 2008;30:3–8.
Funding / potential competing interests: Funding for this study was through internal resources of the Department of Clinical Pharmacology and Toxicology, University Hospital Zürich. The authors have no conflicts of interest that are directly relevant to the content of this study.