Secondary MRI-findings, volumetric and spectroscopic measurements in mesial temporal sclerosis
DOI: https://doi.org/10.4414/smw.2012.13549
Maria Luisa
Lopez-Acevedo, Manuel
Martinez-Lopez, Rafael
Favila, Ernesto
Roldan-Valadez
Summary
INTRODUCTION: Primary- and secondary MR findings, volumetric measurements and MR spectroscopy data of each hippocampus represent more a dozen of variables that radiologists should consider in a quantitative MR report of temporal lobe epilepsy (TLE). There is a paucity of data about the significance of secondary MR findings simultaneously evaluated with volumetry and MR spectroscopy. We analyzed the influence of qualitative-secondary MR findings simultaneously with quantitative (volumetry and spectroscopy) data in MRI positive- and negative patients with mesial temporal sclerosis (MTS).
METHODS: Analytic and transversal study of 59 patients with TLE and suspiciousness of MTS. 13 variables were analyzed for each hippocampus: age, gender, cerebral hemisphere, temporal lobe atrophy, choroidal fissure dilatation, mamillary body atrophy, collateral white matter atrophy, fornix asymmetry; Naa/Cr, Cho/Cr, mI/Cr, Naa/(Cr+Cho); and hippocampus volume (mm3). Multivariate discriminant analysis (DA) was performed with the aim to identify specific morphologic and metabolic attributes in hippocampi with and without MTS.
RESULTS: Discriminant function significantly differentiated the hippocampi with- and without MTS (Wilks’ λ = 0.211, χ2 (11) = 116.072, p = < .001. The model explained 79.03% of the variation in the grouping variable. The pooled within-groups correlations showed the highest influence of discriminating function for the secondary MR findings over metabolite indices and hippocampal volumes, the overall predictive accuracy was 93.9%.
DISCUSSION: Due of the large number of variables (qualitative and quantitative) to which a radiologist is exposed in a conventional hippocampal MR-report, such evaluation might benefit from the use of predictive models generated by unconventional statistical methods, such as DA.
A multivariate discriminant analysis
Introduction
Temporal lobe epilepsy (TLE) is the most prevalent cause of focal epilepsy [1], about 70% of TLE cases are represented by mesial hippocampal sclerosis (MTS) characterized by neuronal loss and gliosis [2, 3]. Conventional magnetic resonance (MR) imaging had been considered the preferred imaging technique in the detection of an abnormal hippocampus with a sensitivity of 85% to 98% [4]. Nowadays quantitative MR imaging utilizing volumetric measurements and MR spectroscopy (MRS) in addition to conventional inspection are the current imaging techniques used in the assessment of patients with TLE suspicious to have MTS [5–7].
Two primary MR findings are required to diagnose MTS: the presence of an atrophic hippocampus and a hyperintense signal confined to the hippocampus [8–13]. Some studies have report the presence of other brain morphologic alterations (ipsilateral to the affected hippocampus) that have been considered as secondary MR findings of MTS: temporal lobe volume loss; choroidal fissure dilatation; narrowed collateral white matter; asymmetry of the fornix; and an atrophic mammillary body [10, 14–17]. One reason that these findings are relegated to the category of secondary findings is because mild asymmetries of these structures have been found in healthy subjects [18, 19].
Although several studies about the prevalence of imaging findings in MTS have been published in patients with TLE, to the best of our knowledge there is a paucity of data about the significance of the secondary MR findings simultaneously evaluated with quantitative data, the majority of studies have reported descriptive statistics or bivariate analysis with no more deep multivariate analysis or variable reduction techniques [20, 21]. We believe these secondary findings might have a quantitative role in the diagnosis of MTS.
Linear discriminant analysis (DA), first introduced by Fisher [22], is a multivariate technique to classify study participants into groups to describe group differences and to assess the relative importance of variables for discriminating between groups. DA undertakes the same task as multiple linear regression by predicting an outcome; however, multiple linear regression is limited to cases where the dependent variable on the Y axis is an interval variable so that the combination of predictors will, through the regression equation, produce estimated mean population numerical Y values for given values of weighted combinations of X values [23]. In medical imaging many interesting variables are categorical, such as presence of hyperintensity, dilatation, loss of volume, etc.; in those cases DA can be applied.
Multivariate analysis of quantitative and qualitative MR data may further our understanding of MTS, considering we can assess different kind of variables and may be able to discover findings and associations that cannot in a partial-regional assessment, be recognized at surgery, neurologic and/or pathologic examination [24]. These might yield important information in terms of the pathophysiology, diagnosis, and prognosis of MTS.
The aim of the study was to analyze the importance of secondary MR findings in a combined evaluation with hippocampi volumes and MRS data of TLE-patients with- and without MTS. We used DA to present a new discriminating model that explains as much of the variance in the original data set as possible considering quantitative and qualitative MR findings.
Subjects and methods
Retrospective, analytic and transversal study which included consecutive brain MR evaluations of patients referred with clinical diagnosis of symptomatic Limbic epilepsy according to the standardized classification of the International League Against Epilepsy (ILAE) [25]. According to medical records, clinical diagnosis was based on a hemispheric lateralization during an interictal EEG and, depending on each case: an ictal or intracranial EEG activity, the semiology of the seizures and/or a positive PET scan. Patients with brain MR findings of neoplastic, infectious, traumatic or inflammatory lesions were excluded from the study. Clinical information recorded age, gender, and affected cerebral hemisphere.

Figure 1
Primary- and secondary findings in mesial temporal sclerosis. A and B, Coronal T2 and Flair brain MR images showing atrophy and hyperintensity in the right hippocampus (white arrows). C, choroidal fissure dilatation. D, temporal lobe atrophy (white contour) and collateral white matter atrophy (white arrow heads). E, mamillary body asymmetry. F, fornix asymmetry.
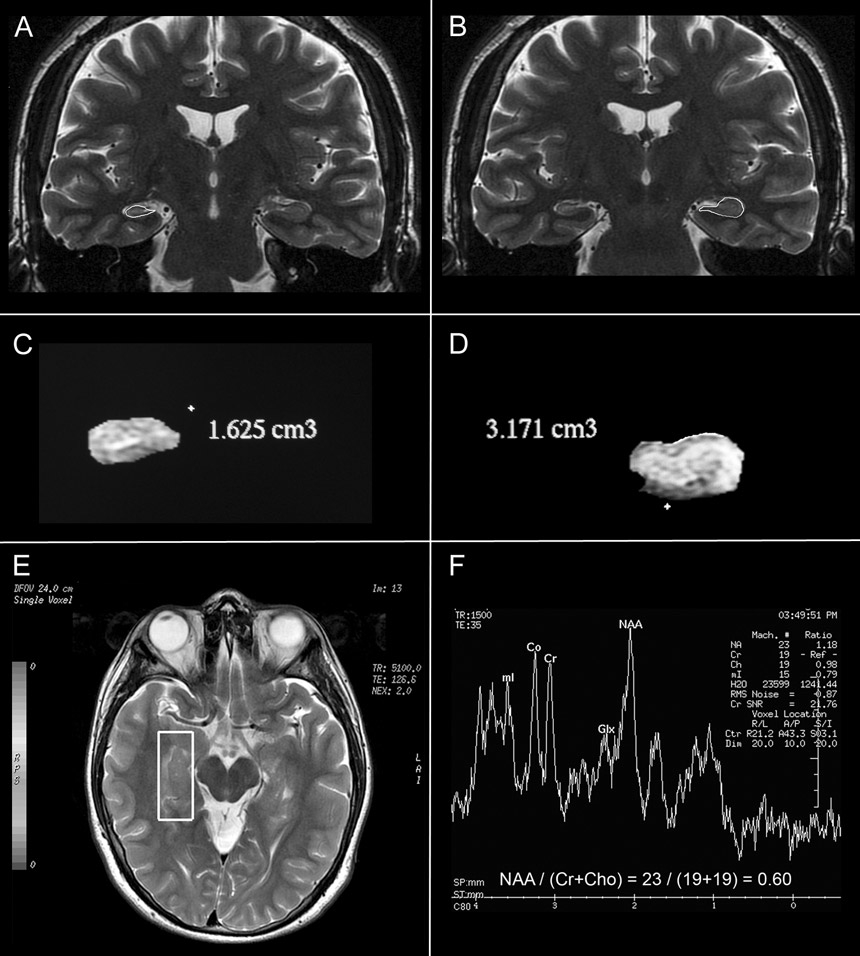
Figure 2
A and B coronal T2-weighted MRI showing the countours of hippocampi as part of the 3D volumetry. C and D, 3D reconstruction of the hippocampus showing a decreased-volume hippocampus and a superior normal limits hippocampus. E, axial-oblique plane showing the location and size of the voxel. F, MR spectrum in a case with MTS depicts an abnormal spectrum with decreased NAA/(Cr+Cho) ratio and increase in the mI.
Conventional brain MR imaging
Conventional evaluation of non-enhanced MR for brain was performed using a 3.0T GE Sigma HDxt scanner (General Electric Healthcare, Milwaukee, WI). All images were acquired with an MRI 8-channel high-resolution brain array coil. The standard clinical sequences consisted of a sagittal T1-weighted fluid attenuated inversion recovery (FLAIR) (TE/TR/TI: 9.9 ms/2500 ms/920 ms; thickness/gap: 5 mm/0.3 mm gap; FOV: 24 cm; matrix: 384x224 pixels), axial 3D spoiled gradient echo (FSPGR) (TE/TR/TI: 3.9 ms/ 9.4 m/450 ms; thickness: 1.3 mm; FOV: 24x18 cm; matrix: 352x224 pixels), coronal T2-weighted fast spin-echo (FSE) (TE/TR: 153 ms/2600 ms; thickness/gap: 3.0 mm/0 mm; FOV: 22x16.5 cm; matrix: 768x384 pixels) and axial T2-weighted FLAIR (TE/TR/TI: 112 ms/1100 ms/2600 ms; thickness/gap: 3 mm/1 mm; FOV: 22 cm; matrix: 288x225 pixels). Two radiologists visually assessed hippocampi atrophy and signal changes, considering MTS is a straightforward MR diagnosis, only cases with full agreement were included in the analysis.
Volumetric and spectroscopic hippocampal measurements
High-spatial-resolution MR images for hippocampal volumetry were acquired by using 3D T2 weighted coronal technique on a 3T unit (GE healthcare, Milwaukee, WI) with all sections obtained perpendicular to the long-axis of the hippocampus (TR/TE/ECO/NEX = 5000/140/30/4, FOV 20, Matrix 384x384). The MR imaging data were transferred to a GE Advantage Workstation and analyzed using the software FuncTool 9.4.04b (GE Medical Systems, Milwaukee, WI).
The boundaries of the hippocampus were manually traced by one radiologist (M.L.A.); all images were coded so that the operator was blind to each patient. The anterior boundary was the first section where the amygdala was not seen. The in-plane boundary, adapted from the definition proposed by Jack [26], was traced laterally along the temporal horn, superiorly by CSF in the choroidal fissure, medially by the CSF in the uncal and ambient cistern, and inferiorly by the gray-white matter in the parahippocampal gyrus. The posterior boundary, an intrinsic landmark proposed by Watson et al. [27] in 1992, was the section before the crus of the fornix. Each individual subject had two measures of hippocampi; one gave the smaller side of hippocampus volume (HV) and the other the contralateral, larger side of HV. The diagnosis of MTS was defined by the presence or absence in each hippocampus of two simultaneous findings: the presence of atrophy (small volume) and a hyperintense signal confined to the hippocampus [8–13].
Single-voxel proton MR spectroscopy was performed by using a point-resolved spectroscopic sequence technique (PRESS) (TR/TE/NEX, 1500/35/8; matrix 1x1; voxel size 10x10x25, 2500 mm3) with region of interest specifically conforming to the volume of each hippocampus. Brain spectra contained five peaks: one primarily from the N-trimethyl protons of choline-containing metabolites at 3.2 ppm (Cho), one from the N-methyl protons of creatine and phosphocreatine at 3.0 ppm (Cr), one primarily from the methyl protons of NAA at 2.0 ppm and two primarily from protons of myo-inositol (mI) at 3.56 and 4.06 ppm [28]. Relative quantification of NAA, Cho, Cr and mI signals was performed after Gaussian curve fitting by using standard spectroscopic analysis software FuncTool 9.4.04b, (GE Healthcare, Milwaukee, WI). Additional NAA/(Cho + Cr) ratios were calculated for each hippocampus. The voxel was placed in that plane and its size was tailored to the approximate size of the body of each hippocampus, figure 1.
Statistical analysis
Dependent variable (DV’s)
The categorical variable used in the DA was the presence or absence of an imaging diagnosis of MTS.
Independent variables (IV’s)
A total of 13 IV’s were evaluated for each hippocampus: age (in years); 7 categorical variables: gender, cerebral hemisphere, temporal lobe atrophy, choroidal fissure dilatation, mamillary body atrophy, cholateral white matter atrophy, fornix asymmetry; and 5 metabolite-indices: Naa/Cr, Cho/Cr, mI/Cr, Naa/(Cr+Cho); and hippocampus volume (mm3).
All categorical and continuous variables underwent simultaneous multivariate DA with the predictive aim to identify specific morphologic and metabolic attributes in hippocampi with and without MTS [23]. The effect-size measure for discriminant analysis was done using the squared canonical correlation as the equivalent of the R2 in regression [29]. By convention, effect sizes of 0.02, 0.15, and 0.35 were termed small, medium, and large, respectively [30]. All analyses were carried out using the IBM® SPSS® Statistics software (version 19.0.0.1 IBM Corporation; Armonk, NY). Presentation of data was done according to the guidelines of the American Psychological Association [31, 32]. Statistical significance was indicated by p <0.05 (two-tailed).
Results
The study was conducted in 59 patients: 29 males (mean age, 30.36 ± 15.96 years; range, 1–58 years) and 30 females (mean age, 22.85 ± 14.40 years; range, 2–52 years), 13 independent variables were evaluated for each of the 118 hippocampi; after the preliminary test of DA 36 hippocampi were excluded (at least one missing discrimination variable). Final DA analysis was conducted in 82 hippocampi (22 with- and 60 without MTS).
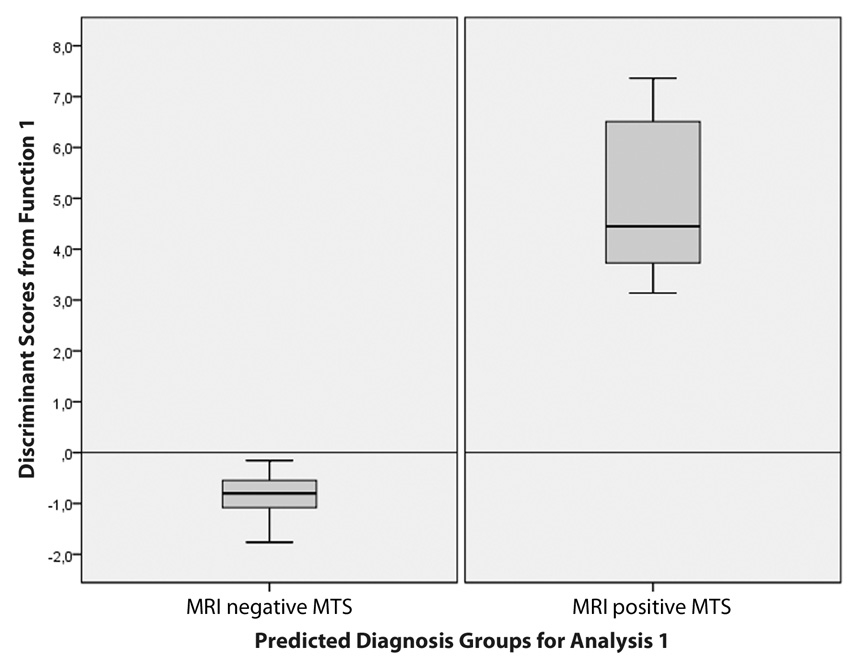
Figure 3
Box plots of the average D scores of DA illustrate the distribution of the discriminant function scores for each group. There is a visual demonstration of an excellent discrimination by showing the absence of overlap between groups.
Discriminant analysis
The DA was performed by entering the 13 independent variables (continuous and categorical) together and revealed one discriminant function. This discriminant function significantly differentiated the hippocampi with- and without MTS: Wilks’ λ = 0.211, χ2 (11) = 116.072, p = < .001. By indicating the significance of the discriminant function, Wilks’ lambda provided a low proportion of total variability not explained by the model of only 20.97%. A canonical correlation of .889 suggested the model explains 79.03% of the variation in the grouping variable.
Summary of discriminant functions
The Tests of equality of group means provided statistical evidence of significant differences between means of MTS and non-MTS groups for all the IVs with secondary-findings and hippocampi volumes producing the highest F’s values; table 1.
Standardized Canonical Discriminant Function Coefficients showed an index of the importance of each predictor of diagnosis with the sign indicating the direction of the relationship. A non-significant decrease in NAA/Cr was the strongest diagnostic predictor while a non-significant positive value for NAA/(Cho+Cr) and a significant choroidal fissure dilatation were next in importance as diagnostic predictors. The variables with large coefficients stand out (for these data) as those that strongly predict allocation to the with- or without MTS group. For these coefficient score the rest of variables were decreasingly less successful as diagnostic predictors; table 2.
Structure Matrix Table provided another way of indicating the relative importance of the diagnostic predictors by showing the correlations (Pearson coefficients) of each variable with each discriminate function. Many researchers consider the structure matrix correlations more accurate than the Standardized Canonical Discriminant Function Coefficients [23]. By identifying the largest loadings for each discriminate function it can be seen a different pattern of loading variables. Here we have secondary-findings and metabolite-indices scores, which suggest a label of qualitative and quantitative MR values as the function that discriminates between with- and without-MTS. A value of 0.30 is considered as the cut-off between important and less important variables [23]; table 3.
Canonical discriminant function coefficients table show the unstandardized coefficients (b) that are used to create the discriminant function (equation), operating just like a regression equation. In this study we observed:
D = (0.011 x Age) + (0.639 x gender) + (0.314 x cerebral hemisphere) + (–8.211 x Naa/Cr) + (5.906 x Cho/Cr) + (0.280 x mI/Cr) + (16.384 x Naa/(Cr+Cho)) + (3.154 x Temporal lobe atrophy) + (5.131 x Choroidal fissure dilatation) + (0.147 x Mamillary body atrophy) + (0.304 x Hippocampus volume) + (–9.435 Constant).
The discriminant function coefficients (b) indicate the partial contribution of each variable to the discriminate function controlling for all other variables in the equation; table 4.
Group centroids table, we also describe each group in terms of its profile, using the group means of the predictor variables called centroids. The cut-off value was considered the mean of the two centroids; if the discriminant score of the function is less than or equal to the cut-off the case is classed as 0 (absent MTS), whereas if it is above, it is classed as 1 (present MTS). In our study, non-MTS had a mean of –0.672 while MTS produced a mean of 5.447; table 5.
We finished the DA performing a classification phase using the cross validated set of data to present the power of the discriminant function. The classification results revealed that 93.9% of patients were classified correctly into “MTS” or “non-MTS” groups, this value corresponded to the overall predictive accuracy of the discriminant function; additional calculations for sensitivity, specificity, positive- and negative predictive values reported values of 97.2%, 70.0%, 95.8% and 77.8% respectively. Box plots of the average D scores for each group were used as visual demonstrations of the effectiveness of the discriminant function, the absence of overlap of the plots revealed an excellent discrimination, figure 3.
|
Table 1: Multivariate analysis of secondary MR findings, hippocampal volumetry and spectroscopy shows the statistical differences between means of MTS and non-MTS groups for the independent variables included in the analysis. |
| Variable |
Wilks’ Lambda |
Fisher’s test |
p-value
|
| Age |
0.998 |
.138 |
0.711 |
| Gender |
0.971 |
2.388 |
0.126 |
| Cerebral hemisphere |
0.962 |
3.165 |
0.079 |
| Naa/Cr |
0.974 |
2.100 |
0.151 |
| Cho/Cr |
0.999 |
0.079 |
0.780 |
| mI/Cr |
0.993 |
0.600 |
0.441 |
| Naa/(Cr+Cho) |
0.978 |
1.825 |
0.181 |
| Temporal lobe atrophy |
0.584 |
56.976 |
< 0.001 |
| Choroidal fissure dilatation |
0.281 |
204.878 |
< 0.001 |
| Collateral white matter atrophy |
0.584 |
56.976 |
< 0.001 |
| * Fornix asymmetry |
– |
– |
– |
| Mamillary body atrophy |
0.683 |
37.066 |
< 0.001 |
| Hippocampus volume |
0.759 |
25.446 |
< 0.001 |
| *Could not be computed because this variable was constant in each group. |
|
Table 2: Independent variables included in the discriminant analysis ordered by their Standardized Canonical Discriminant Function Coefficients (variables with larger coefficients stand out as those that strongly predict allocation to each diagnosis). |
|
Standardized Canonical Discriminant Function Coefficients
|
| Naa/Cr |
–1.673 |
| Naa/(Cr+Cho) |
1.542 |
| Choroidal fissure dilatation |
0.973 |
| Cho/Cr |
0.865 |
| Temporal lobe atrophy |
0.526 |
| Gender |
0.315 |
| Age |
0.173 |
| Cerebral hemisphere |
0.156 |
| Hippocampus volume |
0.131 |
| mI/Cr |
0.062 |
| Mamillary body atrophy |
0.029 |
|
Table 3: Within-groups correlation matrix depicts the participant variables ordered by absolute size of correlation (Pearson coefficients) within function. The largest loadings for each discriminate function (pattern of secondary-findings followed by metabolite-indices scores) suggest a label of qualitative and quantitative MR values as the function that discriminates between with- and without-MTS. A value of 0.30 is considered as the cut-off between important and less important variables. |
|
Structure Matrix
|
| Choroidal fissure dilatation |
0.826 |
| Temporal lobe atrophy |
0.436 |
| Collateral white matter atrophy* |
0.436 |
| Mamillary body atrophy |
0.352 |
| Hippocampus volume |
–0.291 |
| Cerebral hemisphere |
0.103 |
| Gender |
–0.089 |
| Naa/Cr |
–0.084 |
| Naa/(Cr+Cho) |
–0.078 |
| mI/Cr |
–0.045 |
| Age |
0.021 |
| Cho/Cr |
–0.016 |
| * variable not used in the analysis. |
|
Table 4: Canonical discriminant function coefficients table represent the unstandardized coefficients used to create a discriminant function operating just like a regression equation. Coefficients indicate the partial contribution of each variable to the discriminate function controlling for all other variables in the equation. |
|
Canonical discriminant function coefficients
|
| Age |
0.011 |
| Gender |
0.639 |
| Cerebral hemisphere |
0.314 |
| Naa/Cr |
–8.211 |
| Cho/Cr |
5.906 |
| mI/Cr |
0.280 |
| Naa/(Cr+Cho) |
16.384 |
| Temporal lobe atrophy |
3.154 |
| Choroidal fissure dilatation |
5.131 |
| Mamillary body atrophy |
0.147 |
| Hippocampus volume |
0.304 |
| (Constant) |
–9.435 |
|
Table 5: Means of the predictor variables (centroids) used to describe each group in terms of its profile. The cut-off value is considered the mean of the two centroids; if the discriminant score of the function is less than or equal to the cut-off a new case can be classed as 0 (absent MTS), whereas if it is above, it is classed as 1 (present MTS). |
|
Diagnosis of MTS
|
Functions at group centroids
|
| Absent |
–0.672 |
| Present |
5.447 |
| Cut-off value |
4.775 |
Discussion
In this study we applied DA to predict (or discriminate) a dependent variable (diagnosis of patients with- or without MTS) from a set of 13 IV’s (morphologic MR findings, metabolite indices, age, gender, cerebral hemisphere and hippocampus volumes). To achieve this purpose we calculated the underlying linear dimensions of the IV’s. These linear combinations of IV´s are known as variates, latent variables or factors [23].
It would be interesting to read more reports about TLE using multivariate analysis techniques, considering the advances in medical imaging related with the limbic system and hippocampus. Most of the publications about TLE and MR imaging of hippocampi have reported only main effects of volumetric and/or spectroscopic variables, however a formal statistic analysis considering the simultaneous influence (interactions) of several independent variables (categorical and continuous) that can influence results to the best of our knowledge have not been reported [5, 33–36]. These moderator variables are very important because they might help to explain why some researchers obtain statistically significant results while others do not [37].
DA is a statistics tool not commonly reported in medical literature, however we believe physicians will become more familiar with this method in the coming years. This technique characterizes two or more classes of events; the variates with high canonical correlations contribute most to group separation representing the relative contribution of each variable. Interestingly in this study we found a non-significant influence of the metabolite indices defining a diagnosis of MTS, that is, MRS data follow the secondary MR findings in their usefulness for diagnosis. This information might complement previous reports that showed a low NAA/(Cho+Cr) ratio as the most consistent parameter in the assessment of TLE, representing the most sensitive index to detect the abnormalities caused by TLE [4, 38] also a decrease in Cho and Cr related to reactive astrocytosis and decrease in ml associated with reactive gliosis and astrocytosis have been reported.(38) In our analysis a decrease in Naa/Cr was the main discriminant variable after secondary findings and before Naa/(Cr+Cho) and mI/Cr.
The fact that we did not find a higher influence of the different metabolite indices in DA could be related with the findings that about 30% of the patients with TLE present with negative MR findings [7, 24] also MR spectroscopy might have been underestimated because of the partial volume effect in our spectroscopic data that included the whole hippocampus where many areas were intact.
The main influence of secondary findings in this study occurs in the context of a multivariate assessment; the daily inclusion of these MR features will certainly improve the sensitivity and positive predictive value in TLE patients. Some patients with MTS have either absent or equivocal primary MR findings of mesial temporal sclerosis [24].
Unlike logistic regression which is limited to a dichotomous dependent variable, DA can use more than two dependent variable categories; also the independent variables in DA can be of any level of measurement; when its underlying derivational assumptions are satisfied, DA is considered to have greater statistical power than logistic regression [39]. If we express the variates of DA in terms of a linear regression equation the standardized discriminant function coefficients are equivalent to the standardized betas (b) in a regression model. We present to our readers a DA model that attempts to summarize the differentiation between groups, while overlooking within-group variation. Our model achieves the best discrimination of individuals into pre-defined groups [22, 40].
When DA is applied to combined qualitative and quantitative imaging data, theoretically we could uncover underlying patterns of metabolic changes due to diseases over specific brain regions, generating “functions,” the scores of which can represent regional changes or associations between variables. It is in this regard that DA attempts to ascertain unobserved-neurologic assessments. The fornix and mammillary bodies are part of the major efferent system of the hippocampus, while the entorhinal cortex, temporal lobe, and collateral white matter contribute to the afferent pathway. The evidence of a significant influence of secondary MR findings indicates that one should think about MTS as a process involving diffuse regions of the brain rather than as one limited to the hippocampus [24].
This study has some limitations that need to be addressed: although our model was able to explain an important proportion of the variability in the data, it may still have some errors at predicting individual diagnosis, so model validation should be done in subsequent studies. We did not link our findings with a postoperative outcome. It could be interesting to know the interaction of secondary signs, and quantitative measurements with the history of previous insults (febrile seizures, encephalitis) in the long-term outcome of TLE patients, specially considering that MTS is an end stage process and most of our patients are young adults. Also, those MRI-negative TLE patients could benefit from surgery, as recent studies report in this group of patients better surgical outcomes [41–45]. Some questions remains unanswered, for example, if there are no primary MR findings, what is the likelihood (considering the presence of secondary MR findings) of becoming seizure free after temporal lobectomy?
We believe the evidence showed in this study (quantitative and qualitative imaging variables of the limbic system have an influence in the diagnosis of MTS) might be part of the follow up in clinical settings not only in research of TLE. The participation of IV’s in this study, ordered by absolute size of correlation (metabolites and volumetric measurements) might now received closed surveillance by the different specialists interacting with TLE patients: neurologists, neurosurgeons, pediatricians, radiologists; specially in patients with non-lesional TLE in order to detect subtle interactions announcing the conversion of normal hippocampus to MTS.
We are aware that the usefulness of research lies primarily in the generalisation of the findings rather than in the information gained about studies performed in particular individuals. Clinicians should remember that clinical variations (age, gender, time of diagnosis, geographical group, etc.) are likely to affect the size of benefit of a diagnosis or treatment, not whether any benefit exists. The extent to which it is wise or safe to generalise must be judged in individual circumstances, and there may not be a consensus [46]. For example, changes in case mix over time can affect the properties of a diagnostic test [47].
In this study, DA used an approach similar to regression analysis in order to derive a model for predicting diagnosis from two explanatory variables. The discriminant model, represented by an equation, is strictly valid only within the range of the observed data on the explanatory variables. When a measurement is included in a regression model it is possible to make predictions for patients outside the range of the original data (perhaps inadvertently). This numerical form of generalisation is called extrapolation. It can be seriously misleading. With more than two variables, it is not possible to be sure that the original data included any patients with the combination of values of a new patient. Nevertheless, it is reasonable to use such models to make predictions for patients whose important characteristics are within the range in the original data [46]. Clinicians willing to apply this proposal in their own centers, might benefit to enhance generalisability by: using broad inclusion criteria, maximizing the sample size, undertaking the research in the context of their National Health Service settings, and making required procedures or special training protocol driven. Generalisability faces a challenge in medical research because few studies describe well the details of how a change of a concept (simultaneous imaging evaluation of qualitative and quantitative data of hippocampi in this case) and other aspects of the bundle (acceptance and use by radiologists and neurologists for example) are interpreted locally or the details of implementation [48]. Additional studies might help to understand adaptation in different contexts in order to produce knowledge about implementation and outcomes which is generalisable beyond one setting.
In conclusion, we believe the current MR evaluation of hippocampi in patients with TLE should combine a comprehensive qualitative-quantitative analysis with predictive models. Due of the large number of variables (qualitative and quantitative) to which a radiologist is exposed in a conventional hippocampal MR-report, such evaluation might benefit from the use of unconventional statistical methods, such as DA.
References
1 Engel J, Jr. Surgery for seizures. N Engl J Med. 1996;334(10):647–52.
2 Achten E, Boon P, Van De Kerckhove T, Caemaert J, De Reuck J, Kunnen M. Value of single-voxel proton MR spectroscopy in temporal lobe epilepsy. AJNR Am J Neuroradiol. 1997;18(6):1131–9.
3 Vainio P, Usenius JP, Vapalahti M, Partanen K, Kalviainen R, Rinne J, et al. Reduced N-acetylaspartate concentration in temporal lobe epilepsy by quantitative 1H MRS in vivo. Neuroreport. 1994;5(14):1733–6.
4 Thompson JE, Castillo M, Kwock L, Walters B, Beach R. Usefulness of proton MR spectroscopy in the evaluation of temporal lobe epilepsy. AJR Am J Roentgenol. 1998;170(3):771–6.
5 Henry TR, Chupin M, Lehericy S, Strupp JP, Sikora MA, Sha ZY, et al. Hippocampal sclerosis in temporal lobe epilepsy: findings at 7 T(1). Radiology. 2011;261(1):199–209. Epub 2011/07/13.
6 Doelken MT, Stefan H, Pauli E, Stadlbauer A, Struffert T, Engelhorn T, et al. (1)H-MRS profile in MRI positive- versus MRI negative patients with temporal lobe epilepsy. Seizure. 2008;17(6):490–7. Epub 2008/03/14.
7 Hammen T, Kerling F, Schwarz M, Stadlbauer A, Ganslandt O, Keck B, et al. Identifying the affected hemisphere by (1)H-MR spectroscopy in patients with temporal lobe epilepsy and no pathological findings in high resolution MRI. Eur J Neurol. 2006;13(5):482–90. Epub 2006/05/26.
8 Jack CR, Jr., Sharbrough FW, Cascino GD, Hirschorn KA, O’Brien PC, Marsh WR. Magnetic resonance image-based hippocampal volumetry: correlation with outcome after temporal lobectomy. Ann Neurol. 1992;31(2):138–46.
9 Jack CR, Jr. Epilepsy: surgery and imaging. Radiology. 1993;189(3):635–46.
10 Bronen RA. Epilepsy: the role of MR imaging. AJR Am J Roentgenol. 1992;159(6):1165–74.
11 Jackson GD, Berkovic SF, Duncan JS, Connelly A. Optimizing the diagnosis of hippocampal sclerosis using MR imaging. AJNR Am J Neuroradiol. 1993;14(3):753–62.
12 Berkovic SF, Andermann F, Olivier A, Ethier R, Melanson D, Robitaille Y, et al. Hippocampal sclerosis in temporal lobe epilepsy demonstrated by magnetic resonance imaging. Ann Neurol. 1991;29(2):175–82.
13 Bronen RA, Fulbright RK, Spencer DD, Spencer SS, Kim JH, Lange RC, et al. Refractory epilepsy: comparison of MR imaging, CT, and histopathologic findings in 117 patients. Radiology. 1996;201(1):97–105.
14 Baldwin GN, Tsuruda JS, Maravilla KR, Hamill GS, Hayes CE. The fornix in patients with seizures caused by unilateral hippocampal sclerosis: detection of unilateral volume loss on MR images. AJR Am J Roentgenol. 1994;162(5):1185–9.
15 Kim JH, Tien RD, Felsberg GJ, Osumi AK, Lee N. Clinical significance of asymmetry of the fornix and mamillary body on MR in hippocampal sclerosis. AJNR Am J Neuroradiol. 1995;16(3):509–15.
16 Mamourian AC, Brown DB. Asymmetric mamillary bodies: MR identification. AJNR Am J Neuroradiol. 1993;14(6):1332–5; discussion 6–42.
17 Mamourian AC, Rodichok L, Towfighi J. The asymmetric mamillary body: association with medial temporal lobe disease demonstrated with MR. AJNR Am J Neuroradiol. 1995;16(3):517–22.
18 Bronen RA, Cheung G. MRI of the temporal lobe: normal variations, with special reference toward epilepsy. Magn Reson Imaging. 1991;9(4):501–7.
19 Bronen RA, Cheung G. MRI of the normal hippocampus. Magn Reson Imaging. 1991;9(4):497–500.
20 Baxendale S. The role of functional MRI in the presurgical investigation of temporal lobe epilepsy patients: a clinical perspective and review. Journal of clinical and experimental neuropsychology. 2002;24(5):664–76. Epub 2002/08/21.
21 Powell HW, Koepp MJ, Richardson MP, Symms MR, Thompson PJ, Duncan JS. The application of functional MRI of memory in temporal lobe epilepsy: a clinical review. Epilepsia. 2004;45(7):855–63. Epub 2004/07/03.
22 Fisher RA. The use of multiple measurements in taxonomic problems. Ann Eugen. 1936;7:179–88.
23 Field A. Discriminant function variates. In: Field A, editor. Discovering statistics using SPSS. London: SAGE Publications Inc.; 2009. p. 599–624.
24 Bronen R. MR of mesial temporal sclerosis: how much is enough? AJNR Am J Neuroradiol. 1998;19(1):15–8.
25 Engel J, Jr. A proposed diagnostic scheme for people with epileptic seizures and with epilepsy: report of the ILAE Task Force on Classification and Terminology. Epilepsia. 2001;42(6):796–803. Epub 2001/06/26.
26 Jack CR, Jr., Bentley MD, Twomey CK, Zinsmeister AR. MR imaging-based volume measurements of the hippocampal formation and anterior temporal lobe: validation studies. Radiology. 1990;176(1):205–9.
27 Watson C, Andermann F, Gloor P, Jones-Gotman M, Peters T, Evans A, et al. Anatomic basis of amygdaloid and hippocampal volume measurement by magnetic resonance imaging. Neurology. 1992;42(9):1743–50.
28 Brandao LA, Domingues RC. Brain metabolites and their significance in spectral analysis. In: Brandao LA, Domingues RC, editors. MR Spectroscopy of the Brain. Philadelphia, PA: Lippincott Williams & Wilkins; 2004. p. 10–1.
29 Field A. Output from the discriminant analysis. In: Field A, editor. Discovering statistics using SPSS. London: SAGE Publications Ltd; 2009. p. 618–21.
30 Cohen J. Statistical power analysis for the behavioral sciences. 2nd ed. Hillsdale, NJ: Lawrence Erlbaum Associates; 1988.
31 Wilkinson L. Statistical methods in psychology journals. Task force on statistical inference. APA Board of Scientific Affairs. American Psychologist. 1999;54(8):594–604.
32 APA. Publication manual of the American Psychological Association. American Psychological Association. 6 ed2009.
33 Mamourian AC, Cho CH, Saykin AJ, Poppito NL. Association between size of the lateral ventricle and asymmetry of the fornix in patients with temporal lobe epilepsy. AJNR Am J Neuroradiol. 1998;19(1):9–13.
34 Lee DH, Gao FQ, Rogers JM, Gulka I, Mackenzie IR, Parrent AG, et al. MR in temporal lobe epilepsy: analysis with pathologic confirmation. AJNR Am J Neuroradiol. 1998;19(1):19–27. Epub 1998/02/12.
35 Castillo M, Smith JK, Kwock L. Proton MR spectroscopy in patients with acute temporal lobe seizures. AJNR Am J Neuroradiol. 2001;22(1):152–7.
36 Wu WC, Huang CC, Chung HW, Liou M, Hsueh CJ, Lee CS, et al. Hippocampal alterations in children with temporal lobe epilepsy with or without a history of febrile convulsions: evaluations with MR volumetry and proton MR spectroscopy. AJNR Am J Neuroradiol. 2005;26(5):1270–5.
37 Pallant J. Multivariate analysis of variance. SPSS SURVIVAL MANUAL. 4th ed. Crows Nest, NSW, Australia.: Allen & Unwin; 2011. p. 283–97.
38 Achten E. Aspects of proton MR spectroscopy in the seizure patient. Neuroimaging Clin N Am. 1998;8(4):849–62.
39 Lix LM, Sajobi TT. Discriminant analysis for repeated measures data: a review. Frontiers in psychology. 2010;1:146. Epub 2010/01/01.
40 Lachenbruch PA, Clarke WR. Discriminant analysis and its applications in epidemiology. Methods of information in medicine. 1980;19(4):220–6. Epub 1980/10/01.
41 Lopinto-Khoury C, Sperling MR, Skidmore C, Nei M, Evans J, Sharan A, et al. Surgical outcome in PET-positive, MRI-negative patients with temporal lobe epilepsy. Epilepsia. 2012;53(2):342–8. Epub 2011/12/24.
42 Vale FL, Effio E, Arredondo N, Bozorg A, Wong K, Martinez C, et al. Efficacy of temporal lobe surgery for epilepsy in patients with negative MRI for mesial temporal lobe sclerosis. Journal of clinical neuroscience: official journal of the Neurosurgical Society of Australasia. 2012;19(1):101–6. Epub 2011/12/14.
43 Kuba R, Tyrlikova I, Chrastina J, Slana B, Pazourkova M, Hemza J, et al. “MRI-negative PET-positive” temporal lobe epilepsy: invasive EEG findings, histopathology, and postoperative outcomes. Epilepsy Behav. 2011;22(3):537–41. Epub 2011/10/04.
44 Immonen A, Jutila L, Muraja-Murro A, Mervaala E, Aikia M, Lamusuo S, et al. Long-term epilepsy surgery outcomes in patients with MRI-negative temporal lobe epilepsy. Epilepsia. 2010;51(11):2260–9. Epub 2010/12/24.
45 Brodbeck V, Spinelli L, Lascano AM, Pollo C, Schaller K, Vargas MI, et al. Electrical source imaging for presurgical focus localization in epilepsy patients with normal MRI. Epilepsia. 2010;51(4):583–91. Epub 2010/03/04.
46 Altman DG, Bland JM. Generalisation and extrapolation. BMJ. 1998;317(7155):409–10. Epub 1998/08/08.
47 Begg CB. Biases in the assessment of diagnostic tests. Statistics in medicine. 1987;6(4):411–23. Epub 1987/06/01.
48 Ovretveit J, Leviton L, Parry G. Increasing the generalisability of improvement research with an improvement replication programme. BMJ quality & safety. 2011;20 Suppl 1:i87–91. Epub 2011/04/06.