Prevalence of multimorbidity in medical inpatients
DOI: https://doi.org/10.4414/smw.2012.13533
Florian
Schneider, Vladimir
Kaplan, Roksana
Rodak, Edouard
Battegay, Barbara
Holzer
Summary
OBJECTIVE: To validate the estimates of the prevalence of multimorbidity based on administrative hospital discharge data, with medical records and chart reviews as benchmarks.
DESIGN: Retrospective cohort study.
SETTING: Medical division of a tertiary care teaching hospital.
PARTICIPANTS: A total of 170 medical inpatients admitted from the emergency unit in January 2009.
MAIN MEASURES: The prevalence of multimorbidity for three different definitions (≥2 diagnoses, ≥2 diagnoses from different ICD-10 chapters, and ≥2 medical conditions as defined by Charlson/Deyo) and three different data sources (administrative data, chart reviews, and medical records).
RESULTS: The prevalence of multimorbidity in medical inpatients derived from administrative data, chart reviews and medical records was very high and concurred for the different definitions of multimorbidity (≥2 diagnoses: 96.5%, 95.3%, and 92.9% [p = 0.32], ≥2 diagnoses from different ICD-10 chapters: 86.5%, 90.0%, and 85.9% [p = 0.46], and ≥2 medical conditions as defined by Charlson/Deyo: 48.2%, 50.0%, and 46.5% [p = 0.81]). The agreement of rating of multimorbidity for administrative data and chart reviews and administrative data and medical records was 94.1% and 93.0% (kappa statistics 0.47) for ≥2 diagnoses; 86.0% and 86.5% (kappa statistics 0.52) for ≥2 diagnoses from different ICD-10 chapters; and 82.9% and 85.3% (kappa statistics 0.69) for ≥2 medical conditions as defined by Charlson/Deyo.
CONCLUSION: Estimates of the prevalence of multimorbidity in medical inpatients based on administrative data, chart reviews and medical records were very high and congruent for the different definitions of multimorbidity. Agreement for rating multimorbidity based on the different data sources was moderate to good. Administrative hospital discharge data are a valid source for exploring the burden of multimorbidity in hospital settings.
Validation of estimates based on administrative data
Abbreviations
ICD-10: International classification of diseases – 10th version
Introduction
With continuous improvement in medical care and increasing longevity, a growing proportion of patients present to health care providers with multiple chronic co-existing diseases and conditions (multimorbidity). The term multimorbidity was coined 1996 by van den Akker et al. as the co-occurrence of two or more diseases or medical conditions within the same person, where one condition is not more important than the other [1, 2]. Since then, multimorbidity has become a mounting health phenomenon, particularly among the elderly.
Estimates of the magnitude of this health problem demonstrate a broad variation regarding the prevalence of multimorbidity depending on the data source (questionnaires, medical records, patient charts, and administrative data) and the definition of multimorbidity (type and number of diseases included in the definition) [3–7]. The population-based estimates of the prevalence of multimorbidity are between 20–30% for the entire population, and 55–98% for persons older than 65 years [8]. Most studies reporting these estimates, especially those in primary care, used self-reports [1, 9–11] and general practitioners’ records [1, 4, 12, 13] as data sources.
Although hospitalised patients are very often multimorbid, estimates of the prevalence of multimorbidity in hospital settings are scarce. Studies from the United States and the Netherlands report prevalence rates of two or more chronic conditions in 22–65% of all inpatients [4, 14, 15]. These estimates of multimorbidity among hospitalised patients were based on administrative data. However, administrative data have not been validated regarding their consistency and congruency in estimating multimorbidity in hospital settings.
Therefore, the aim of the present study was to validate the estimates of multimorbidity based on administrative hospital discharge data for different definitions of multimorbidity, using medical records (physicians’ notes) and comprehensive chart reviews as a benchmark. Our hypothesis was that the estimates of the prevalence of multimorbidity will be congruent with a high degree of agreement for all three data sources.
Methods
Setting
The University Hospital Zurich is a tertiary teaching hospital, serving the north-eastern part of Switzerland. The emergency unit is run by general internists and general surgeons. Patients with psychiatric problems and patients with suspected stroke are managed separately. About 40,000 patients are treated yearly in the emergency unit. Almost 50% of these patients are treated by general internists and more than 2000 patients have to be admitted to medical wards. Those admitted from the emergency unit comprise about 80% of all admissions to medical wards of the University Hospital Zurich.
Patient selection
We included all consecutive adult patients (age ≥18 years) admitted from the emergency unit to the medical wards of the University Hospital Zurich between January 1st and January 31st, 2009. We excluded patients managed primarily in the resuscitation room, and those with missing diagnostic information.
Data source
In a first step, we extracted the following variables from the medical record (physicians’ notes) of each patient into a spreadsheet calculation programme (Microsoft-Excel®, http://www.microsoft.com ): Patient number, case number, date of admission, mode of referral (self, ambulance, physician), gender, age (years), length of hospital stay (days), transfer to another acute care unit, and all diagnoses as cited in the physicians’ notes based on the International classification of diseases - 10th version (ICD-10) (medical record). In a second step, two medical residents reviewed the medical record, medical chart, imaging and laboratory tests of each participant and appended diagnoses not mentioned in the medical record (comprehensive chart review). In a third step, we extracted all diagnoses from administrative hospital discharge data generated by the professional hospital coding team within 30 days of patient discharge (administrative data).
Definition of multimorbidity
We defined multimorbidity as either present or absent using three different methodologies: 1) co-occurrence of two or more diagnoses (health conditions that imply a diagnostic or therapeutic procedure or need consideration regarding further medical management during the current hospitalisation) within one patient based on the ICD-10 disease classification system [2]; 2) co-occurrence of two or more diagnosis from different organ-specific chapters of the ICD-10 classification system (chapter I to XIV and chapter XVII) within one patient [16]; 3) co-occurrence of two or more chronic medical conditions within one patient as defined by the Charlson/Deyo comorbidity index based on the ICD-10 disease classification system [17–19].
Data management and statistical analysis
We managed data using Microsoft Excel® (Microsoft® Corp, Redmond, WA; http://www.microsoft.com ) and conducted statistical analyses using SPSS© (SPSS Inc., Chicago, IL; http://www.spss.com ) and Stata® (Stata Corporation, College Station, TX; http://www.stata.com ) statistical software. Continuous data are presented as means and standard deviations, or medians and ranges, and categorical data as counts and proportions, with their 95% confidence intervals. We compared continuous data using t-tests and categorical data using chi-square statistics. Cohen’s Kappa statistics were used to assess agreement (agreement adjusted for chance agreement) between different data sources. We assumed a significance level at a p-value <0.01 because of multiple comparisons.
Results
Patient selection
In January 2009, 1520 non-surgical patients were managed in the emergency unit of the University Hospital Zurich. Of these, 1196 were treated as outpatients. Of the remaining 324 inpatients, we excluded 92 patients who were managed by doctors other than internists, 38 patients who were managed by the resuscitation team in the resuscitation room, 22 patients who had an incomplete documentation, and 2 patients who were younger than 18 years. Overall, 170 patients remained for the analysis (fig. 1).

Figure 1
Identification and construction of the study cohort.
In the study cohort, we included all adult patients (age ≥18 years) admitted from the emergency unit to the medical wards of the University Hospital Zurich between January 1st and January 31st, 2009. Patients managed primarily by an anaesthesiologist in the resuscitation room, and those with missing diagnostic information were excluded.
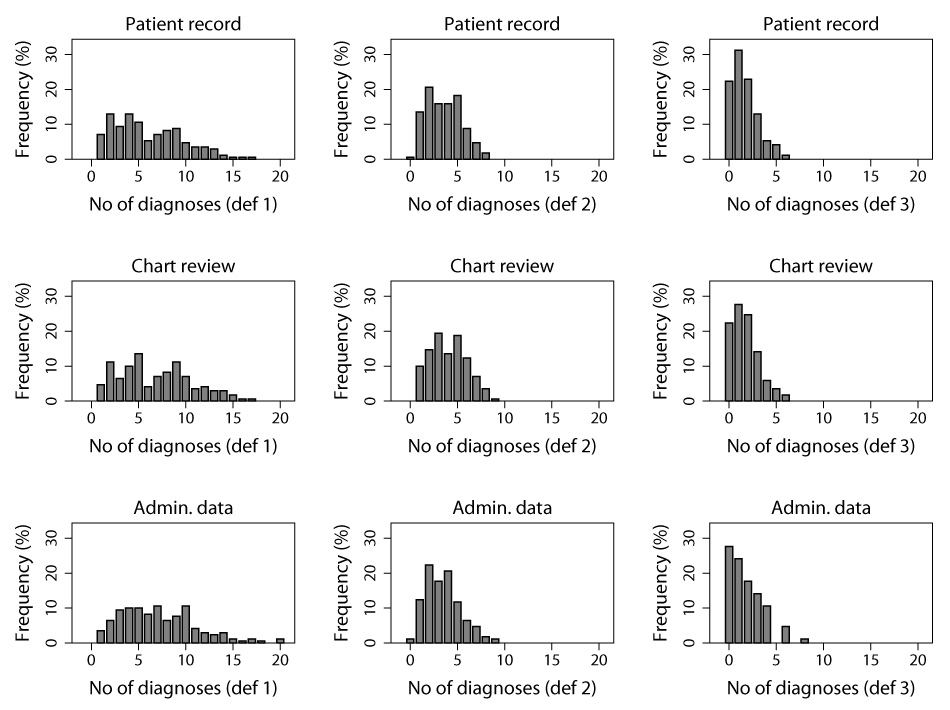
Figure 2
Frequency distribution of the number of diagnoses per patient based on three different data sources (rows) and three different definitions of multimorbidity (columns).
The first column represents the frequency distribution of the number of diagnoses from the ICD-10 disease classification system within one patient (def 1). The second column represents the frequency distribution of the number of diagnoses from different organ-specific chapters of the ICD-10 classification system within one patient (def 2). The third column represents the frequency distribution of the number of diagnoses within one patient as defined by the Charlson/Deyo comorbidity index (def 3). Data sources for the first row are patient records (notes as cited by the treating physician), for the second row comprehensive chart reviews (two medical residents reviewed physician’s notes, medical charts, imaging and laboratory tests and appended diagnosis not mentioned in patient’s records), and for the third row administrative hospital discharge data (generated by a professional hospital coding team within 30 days of patient discharge from the hospital). The frequency distribution of the number of diagnoses within one patient is mainly determined by the definition of multimorbidity and not by the data source used.
Patient characteristics
Among the 170 participants, 98 were men (57.6%) and 72 were women (42.4%) (table 1). The mean age was 61.7 years, with no age difference between men and women (p = 0.98). Patients between 60 and 79 years represented 42.9% of the study cohort. About one third of the patients did not see a physician before visiting the emergency department (walk-in patients) (35.9%), more than one third of the patients were referred by a physician (38.2%), and less than one third were admitted by ambulance/police (25.9%). Prior to admission, 94.1% (95%CI 90.5–97.7%) were living at home. Common reasons for the emergency encounter were chest pain, dyspnea, fever/shivering and abdominal pain, accounting for more than half of all leading symptoms (table 1). Chest pain and fever were the most common symptoms in men, whereas dyspnea and abdominal pain were the most common symptoms in women (table 1).
The median hospital length of stay was 7 days (range 1 to 201 days), with no difference between men and women (p = 0.15). One third of all patients (35.3%) stayed in the hospital for less than four days, and 10% of all patients stayed in the hospital for more than 25 days. Of all patients, 62.7% (95%CI 55.4–70.1%] were discharged to home, 23.7% (95%CI 17.2–30.1%) were transferred to other hospitals, and 8.3% (95%CI 4.1–12.5%) were discharged to other health care facilities (table 1).
Comparison of data sources
Medical records: Overall from 170 medical records, we extracted 1026 diagnoses from 17 different ICD-10 chapters. The median number of diagnoses per patient was 5 (range 1 to 17). The frequency of the most common specific diagnoses is provided in table 2. Hypertension (I10) was the most frequently coded diagnoses (45.3% of all patients), followed by chronic renal failure (N18) (22.4% of all patients), and anaemia (D64) (20.0% of all patients).
Chart reviews: Based on chart reviews, another 127 diagnoses were added to those already extracted from the medical records, increasing the total number of diagnoses to 1153. The median number of diagnosis was 6 (range 1 to 17). In more than one third of all cases one to three diagnoses were added, and in one case seven diagnoses were added. The diagnoses most often supplemented were anaemia (D64) in 1 out of 5 patients, and unspecified renal failure (N19), obesity (E66) and drug allergy (Z88), each in 1 out of 10 patients (table 2).
Administrative data: The total number of diagnoses extracted from administrative data increased to 1221. The median number of diagnoses was 7 (range 1 to 20) per patient. The most obvious differences were fewer patients with the diagnosis of anaemia (D64) (3.0% of all patients), hypertension (I10) (33.5% of all patients), unspecified renal failure (N19) (no patient), drug allergy (Z88) (no patient), and more patients with the diagnosis of a history of medical treatment (Z92) (17.6% of all patients) and presence of cardiac or vascular grafts (Z95) (19.4% of all patients) (table 2).
Number of diagnoses per patient
The frequency distribution of the number of diagnoses per patient based on the three definitions of multimorbidity and the three data sources was mainly determined by the definition of multimorbidity and was very similar for the different data sources (fig. 2). As the specificity of the definition of multimorbidity increased (from ≥2 diagnosis, to ≥2 diagnosis from different organ specific ICD-10 chapters, and ≥2 chronic medical conditions as defined by Charlson-Deyo) the distribution narrowed progressively, which means that a more limited number of specific diseases included in the definition of multimorbidity resulted in a narrower distribution.
Prevalence of multimorbidity
The prevalence rates of multimorbidity extracted from administrative data, chart reviews and medical records for the three different definitions of multimorbidity: 1) co-occurrence of ≥2 diagnosis within one patient, 2) co-occurrence of ≥2 diagnosis from different organ specific ICD-10 chapters within one patient, 3) co-occurrence of ≥2 chronic medical conditions as defined by Charlson-Deyo within one patient, are presented in table 3. Independent of the data source, the prevalence rates of multimorbidity decreased from definition 1 to definition 3 (p <0.01). The prevalence rates of multimorbidity based on definition 3 were higher for those ≥65 years (61.0% vs. 39.0%, p = 0.002) and for those admitted from other hospitals/health care facilities (80.0% vs. 46.3%, p = 0.04), however, the rates were the same for definition 1 and 2. Furthermore, the location after discharge was not associated with the prevalence rates of multimorbidity.
Agreement for rating of multimorbidity
The prevalence rates of multimorbidity defined as ≥2 diagnosis within one patient based on the ICD-10 classification system were 96.5% (95%CI 93.7–99.3%), 95.3% (95%CI 92.1–98.5%), and 92.9% (95%CI 89.0–96.8%), for administrative data, chart reviews, and medical records, respectively, with no significant differences for the various data sources explored (table 3). Agreement for the rating of multimorbidity between administrative data and chart reviews, and administrative data and medical records was 94.1% and 93.0%. Kappa statistics for the three data sources were 0.47 (95%CI 0.37–0.58).
The prevalence rates of multimorbidity defined as ≥2 diagnosis from different organ-specific chapters of the ICD-10 classification system (chapter I to XIV and chapter XVII) within one patient were 86.5% (95%CI 81.3–91.7%), 90.0% (95%CI 85.4–94.6%), and 85.9% (95%CI 80.6–91.2%), for administrative data, chart reviews, and medical records, respectively, with no significant differences among the various data sources (table 3). Agreement for the rating of multimorbidity between administrative data and chart reviews, and administrative data and medical records was 86.0% and 86.5%. Kappa statistics for the different data sources were 0.52 (95%CI 0.39–0.59).
The prevalence of multimorbidity defined as ≥2 chronic medical conditions within one patient as described by Charlson/Deyo based on the ICD-10 classification system was 48.2% (95%CI 40.6–55.8%), 50.0% (95%CI 42.4–57.6%), and 46.5% (95%CI 38.9–54.0%) for administrative data, chart reviews, and medical records, respectively. Again, no significant differences regarding prevalence of multimorbidity were found among the different data sources (table 3). Agreement for rating of multimorbidity between administrative data and chart reviews, and administrative data and medical records was 82.9% and 85.3%. Kappa statistics for the different data sources were 0.69 (95%CI 0.66–0.71).
|
Table 1: Baseline characteristics of the study participants* (N = 170). |
| |
Men (N = 98)
Proportion (%)
|
Women (N = 72)
Proportion (%)
|
p-value
|
| Age |
|
|
0.92 |
| 18–39 yr |
16.3 |
15.3 |
|
| 40–59 yr |
20.4 |
25.0 |
|
| 60–79 yr |
43.9 |
41.7 |
|
| ≥80 yr |
19.4 |
18.1 |
|
| Location prior to admission |
|
|
0.94 |
| Home |
93.9 |
94.4 |
|
| Other hospital |
5.1 |
4.2 |
|
| Other healthcare facility |
1.0 |
1.4 |
|
| Type of referral |
|
|
0.36 |
| Self |
39.8 |
30.6 |
|
| By practitioner/hospital |
37.8 |
38.9 |
|
| By ambulance/police |
22.4 |
30.5 |
|
| Reason of referral |
|
|
0.37 |
| Chest pain |
21.4 |
8.3 |
|
| Dyspnea |
12.2 |
20.8 |
|
| Fever/shivering |
13.3 |
9.7 |
|
| Abdominal pain |
7.1 |
13.9 |
|
| Altered consciousness |
6.1 |
9.7 |
|
| Other |
39.9 |
37.6 |
|
| Location after discharge |
|
|
0.51 |
| Home |
63.9 |
61.1 |
|
| Other hospital |
25.8 |
20.8 |
|
| Other healthcare facility |
6.2 |
11.1 |
|
| Death |
4.1 |
6.9 |
|
| * Study participants were all adult patients (age ≥18 years) admitted from the emergency unit to the medical wards of the University Hospital Zurich between January 1st and January 31st, 2009. |
|
Table 2: Frequency (count, [%]) of common diagnoses extracted from three different data sources (medical record, chart review, administrative data). |
|
|
Medical record*
|
Chart review†
|
Admin. data‡
|
|
|
Diagnosis (ICD-10 code)
|
N
|
(%)
|
N
|
(%)
|
N
|
(%)
|
p-value
|
| Anemia (D64) |
34 |
(3.32) |
62 |
(5.36) |
5 |
(0.41) |
<.001 |
| Purpura and other conditions (D69) |
11 |
(1.07) |
19 |
(1.64) |
8 |
(0.66) |
0.073 |
| Hypothyroidism (E03) |
10 |
(0.98) |
13 |
(1.12) |
5 |
(0.41) |
0.129 |
| Diabetes mellitus (E11) |
28 |
(2.73) |
28 |
(2.42) |
26 |
(2.14) |
0.061 |
| Obesity (E66) |
16 |
(1.56) |
24 |
(2.08) |
12 |
(0.99) |
0.097 |
| Disorders of lipid metabolism (E78) |
27 |
(2.63) |
27 |
(2.34) |
13 |
(1.07) |
0.016 |
| Sleep disorders (G47) |
10 |
(0.98) |
17 |
(1.47) |
3 |
(0.25) |
0.006 |
| Hypertension (I10) |
77 |
(7.51) |
79 |
(6.83) |
57 |
(4.69) |
0.015 |
| Hypertensive heart disease (I11) |
17 |
(1.66) |
18 |
(1.56) |
18 |
(1.48) |
0.945 |
| Acute myocardial infarction (I21) |
12 |
(1.17) |
12 |
(1.04) |
15 |
(1.23) |
0.901 |
| Chronic ischemic heart disease (I25) |
26 |
(2.54) |
26 |
(2.25) |
41 |
(3.37) |
0.219 |
| Atrial fibrillation and flutter (I48) |
24 |
(2.34) |
24 |
(2.08) |
25 |
(2.06) |
0.879 |
| Heart failure (I50) |
16 |
(1.56) |
16 |
(1.38) |
20 |
(1.65) |
0.870 |
| Atherosclerosis (I70) |
18 |
(1.76) |
19 |
(1.64) |
9 |
(0.74) |
0.068 |
| Pneumonia (J18) |
18 |
(1.76) |
18 |
(1.56) |
20 |
(1.65) |
0.936 |
| Chronic obstructive lung disease (J44) |
17 |
(1.76) |
17 |
(1.64) |
14 |
(1.15) |
0.588 |
| Chronic renal failure (N18) |
38 |
(3.71) |
42 |
(3.63) |
29 |
(2.39) |
0.127 |
| Unspecified renal failure (N19) |
15 |
(1.46) |
23 |
(1.99) |
|
(0.00) |
<.001 |
| Drug allergy (Z88) |
13 |
(1.27) |
20 |
(1.73) |
|
(0.00) |
<.001 |
| History of medical treatment (Z92) |
|
(0.00) |
|
(0.00) |
30 |
(2.47) |
<.001 |
| Transplanted organ and tissue (Z94) |
19 |
(1.85) |
21 |
(1.82) |
17 |
(1.40) |
0.638 |
| Presence of grafts (Z95) |
9 |
(0.88) |
9 |
(0.78) |
33 |
(2.72) |
<.001 |
| Admin. data = administrative hospital discharge data (ICD-10 classification system).
* Two medical residents extracted, from the physicians’ notes, all diagnoses as cited by the treating physician based on the ICD-10 classification system (medical record).
† Two medical residents reviewed the medical records, medical charts, imaging and laboratory tests of all participants and appended diagnoses not mentioned in the medical record (comprehensive chart review).
‡ We extracted all ICD-10 codes from the administrative data generated by a professional coding team within 30 days of patients’ discharge (administrative data). |
|
Table 3: Prevalence of multimorbidity based on three different definitions of multimorbidity and three different data sources (medical record, chart review, administrative data). |
| |
Admin. data*
|
Chart review†
|
Medical record‡
|
|
| ≥2 diagnosis from the ICD-10 classification system (def 1) |
96.5% |
95.3% |
92.9% |
0.32 |
| ≥2 diagnosis from different organ chapters of the ICD-10 classification system (def 2) |
86.5% |
90.0% |
85.9% |
0.46 |
| ≥2 chronic medical conditions as defined by Charlson-Deyo (def 3) |
48.2% |
50.0% |
46.5% |
0.81 |
| |
<0.01 |
<0.01 |
<0.01 |
p-value |
| Admin. data = administrative hospital discharge data (ICD-10 classification system).
def = definition.
* We extracted all ICD-10 codes from the administrative data generated by a professional coding team within 30 days of patient discharge (administrative data).
‡ Two medical residents extracted, from the physicians’ notes, all diagnoses as cited by the treating physician based on the ICD-10 classification system (medical record).
† Two medical residents reviewed the medical records, medical charts, imaging and laboratory tests of all participants and appended diagnoses not mentioned in the medical record (comprehensive chart review). |
Discussion
Our results show a high prevalence of multimorbidity among patients admitted from the emergency unit to the medical ward of a tertiary care hospital, with a wide variation mainly due to the underlying definition. The prevalence was close to 95%, 90%, and 50% for co-occurrence of two or more diagnoses, co-occurrence of two or more diagnoses from different ICD-10 organ chapters, and co-occurrence of two or more chronic medical conditions as defined by Charlson/Deyo, respectively (table 3). On the contrary, estimates of multimorbidity based on the same definition but derived from the different data sources were congruent, which means that the medical records and the chart reviews were not more comprehensive than the administrative hospital discharge data to detect multimorbid patients (table 3). Agreement for rating of multimorbidity based on the different definitions was moderate for ≥2 diagnoses (kappa = 0.47 [95%CI 0.37–0.58]) and ≥2 diagnoses from different ICD-10 chapters (kappa = 0.52, [95%CI 0.39–0.59]), and good for ≥2 medical conditions as defined by Charlson/Deyo (kappa = 0.69, [95%CI 0.66–0.71]). The lower agreement for ≥2 diagnoses and ≥2 diagnoses from different ICD-10 chapters was mainly due to the high prevalence of multimorbidity for these two definitions (85–95%) causing high sensitivity for a few misclassifications with corresponding wide 95% confidence intervals (see above).
The decreasing prevalence of multimorbidity based on the three different definitions was expected and explained by the decreasing number of diagnoses included in the underlying definition of multimorbidity. The largest number of diagnoses were based on the entire ICD-10 classification system, lower numbers if only diagnoses from different organ chapters were considered, and the lowest numbers of diagnoses were observed for the Charlson/Deyo index with only 17 different conditions [17].
We found dissimilarities between the administrative data and medical records or chart reviews regarding the frequency of specific diagnoses, with a lower prevalence of anaemia, disorders of lipid metabolism, sleep disorders, hypertension, unspecified renal failure and drug allergy, and a higher prevalence of history of medical treatment and presence of grafts in the administrative data (table 2). The lower prevalence rates regarding specific diagnoses in the administrative data were mainly due to diagnoses, which were not considered by the professional coding team to imply a diagnostic or therapeutic procedure or to need consideration regarding further medical management during the current admission. The higher prevalence rates were mainly due to the presence of vascular implants not mentioned in the medical records or chart reviews, and also due to prior medical treatments considered by the coding team to be relevant to the current admission. However, these differences were usually found among patients with multiple other diagnoses and conditions, and had therefore little impact on the rating of multimorbidity (data not shown).
The frequencies of the diagnoses found in our data were comparable to those found in a Dutch hospital registry, which recorded 185 specific chronic conditions at admittance, with hypertension, ischemic heart disease, chronic renal failure, diabetes, and atrial fibrillation being the most prevalent chronic conditions [15], and therefore might be representative for medical emergency unit settings.
Although there is no validation of administrative data for rating multimorbidity, a validation of administrative data using chart reviews as a benchmark was performed by Quan et al. for chronic medical conditions that constitute the Charlson-Deyo Comorbidity index [20]. It showed a wide variation in agreement, ranging from fair to excellent (kappa statistics 0.34–0.87) for the 17 specific co-morbid conditions included. The data sources were not identical, with under-reporting in the administrative data. However, the agreement for a Charlson-Deyo score of more than one (presumable multimorbid patients) was over 90%, and was comparable to our result of close to an 85% agreement for co-occurrence of two or more chronic medical conditions as defined by Charlson-Deyo. Other authors have explored the validity of specific co-morbidities derived from administrative data, focusing only on patients who underwent a specific procedure such as prostatectomy [21], carotid endarterectomy [22], and percutaneous coronary interventions [23]. In general, kappa statistics for the specific co-morbidities were lower than those reported by Quan et al. [20] and those reported in our study. This might relate to the improvement of coding accuracy in recent years. Furthermore, some differences might be explained by variation in coding accuracy for the specific conditions explored, with higher accuracy for life-threatening conditions and lower accuracy for asymptomatic, non-specific conditions [24].
We compared our estimates of multimorbidity based on the second definition (co-occurrence of two or more diagnoses from different ICD-10 organ specific chapters) with prior estimates from our institution, based on chart reviews of 600 patients hospitalised in medical wards during the year 2000 [16]. In this patient population the prevalence of multimorbidity was 84% and to some extent lower than the prevalence of 90% found in our study. Reasons for the slight difference might be the increasing complexity of patients in recent years, and a selection bias due to exclusion of elective admissions in the current study, which might represent a population with a lower severity of illness.
In the future, exploration of longitudinal administrative hospital discharge data (linked across time) might allow researchers to gain a deeper understanding of multimorbidity [25] and its time trends in hospital settings. This might also allow investigators to explore the impact of multimorbidity on multiple outcomes, such as death, time spent in intensive care, time spent in hospitals and resource use.
The current study is subject to several limitations. Firstly, the sample size of our study population is relatively small, which reduces the precision of the estimates and the power to detect differences regarding prevalence of multimorbidity among the three distinct data sources explored. Secondly, the generalisability of our results to an in-patient population in primary and secondary care hospitals may be hampered by a selection bias of an extremely sick patient population, found in tertiary care, with a high prevalence of chronic medical conditions and multimorbidity. Thirdly, we used an open list of diseases for two of the definitions of multimorbidity and limited the number of diseases for the definition of multimorbidity based on Charlson-Deyo index. Therefore, we cannot generalise our observations to other definitions of multimorbidity, because the specific type of conditions and diagnoses included might have a major impact on the estimates, if there is under- or over-reporting in administrative data [24]. Forth, administrative hospital discharge data are subject to inherent errors in the data itself with loss of clinical details in the coding process. Furthermore, there is significant variance between different institutions (i.e., between rural and urban facilities) in the accuracy and specificity of hospital discharge coding [26, 27]. Therefore, the extent to which our findings can be generalised to other institutions and regions remains unknown. In Switzerland, the coding is usually performed by specialised staff and supervised by independent auditors, and there is no financial incentive for up-coding (reimbursement was not yet based on hospital discharge data in 2009). Therefore, we assume a high quality of administrative data coding (our institution is a teaching hospital for staff specialised in coding), which might not be inherent to all locations.
Conclusion
Multimorbidity is a highly prevalent disease pattern in patients admitted from the emergency unit to a tertiary care hospital. Estimates of prevalence of multimorbidity based on administrative data, comprehensive chart reviews or medical records, were congruent for all three different definition of multimorbidity explored. Agreement for rating of multimorbidity based on the three data sources was moderate to good. High quality administrative data appear to be a valid source for exploring the burden of multimorbidity in hospital settings and the impact it has on multiple outcomes.
References
1 van den Akker M, Buntinx F, Metsemakers JF, Roos S, Knottnerus JA. Multimorbidity in general practice: prevalence, incidence, and determinants of co-occurring chronic and recurrent diseases. J Clin Epidemiol. 1998;51(5):367–75.
2 van den Akker M, Buntinx F, Knottnerus JA. Comorbidity or multimorbidity: What’s in the name? A review of literature. Eur J Gen Pract. 1996;2(2):65–70.
3 De Groot V, Beckerman H, Lankhorst GJ, Bouter LM. How to measure comorbidity: A critical review of available methods. J Clin Epidemiol. 2003;56(3):221–9.
4 Schneider KM, O’Donnell BE, Dean D. Prevalence of multiple chronic conditions in the United States' Medicare population. Health Qual Life Outcomes. 2009;7:82.
5 Laux G, Rosemann T, Korner T, Heiderhoff M, Schneider A, et al. Detailed data collection regarding the utilization of medical services, morbidity, course of illness and outcomes by episode-based documentation in general practices within the CONTENT project. Gesundheitswesen. 2007;69(5):284–91.
6 Marengoni A, Winblad B, Karp A, Fratiglioni L. Prevalence of chronic diseases and multimorbidity among the elderly population in Sweden. Am J Public Health. 2008;98(7):1198–1200.
7 Laux G, Kuehlein T, Rosemann T, Szecsenyi J. Co- and multimorbidity patterns in primary care based on episodes of care: results from the German CONTENT project. BMC Health Serv Res. 2008;8:14.
8 Marengoni A, Angleman S, Melis R, Mangialasche F, Karp A, et al. Ageing with multimorbidity: a systematic review of the literature. Ageing Res Rev. 2011;10(4):430–9.
9 John R, Kerby DS, Hennessy CH. Patterns and impact of comorbidity and multimorbidity among community-resident american indian elders. Gerontologist. 2003;43(5):649–60.
10 Walker AE. Multiple chronic diseases and quality of life: patterns emerging from a large national sample, Australia. Chronic Illn. 2007;3(3):202–18.
11 Loza E, Jover JA, Rodriguez L, Carmona L. Multimorbidity: prevalence, effect on quality of life and daily functioning, and variation of this effect when one condition is a rheumatic disease. Semin Arthritis Rheum. 2009;38(4):312–9.
12 Fortin M, Bravo G, Hudon C, Vanasse A, Lapointe L. Prevalence of multimorbidity among adults seen in family practice. Ann Fam Med. 2005;3(3):223–8.
13 Uijen AA, van de Lisdonk EH. Multimorbidity in primary care: prevalence and trend over the last 20 years. Eur J Gen Pract. 2008;14(Suppl 1):28–32.
14 Wolff JL, Starfield B, Anderson G. Prevalence, expenditures, and complications of multiple chronic conditions in the elderly. Arch Intern Med. 2002;162(20):2269–76.
15 Schram MT, Frijters D, van de Lisdonk EH, Ploemacher J, de Craen AJ, et al. Setting and registry characteristics affect the prevalence and nature of multimorbidity in the elderly. J Clin Epidemiol. 2008;61(11):1104–12.
16 Horschik D. Die Bedeutung der Polymorbidität im internistischen Krankengut. Medizinische Fakultät. 2000;Universitätsspital Zürich.
17 Charlson ME, Pompei P, Ales KL, MacKenzie CR. A new method of classifying prognostic comorbidity in longitudinal studies: development and validation. J Chronic Dis. 1987;40(5):373–83.
18 Ramiarina RA, Ramiarina BL, Almeida RM, Pereira WC. Comorbidity adjustment index for the international classification of diseases, 10th revision. Rev Saude Publica. 2008;42(4):590–7.
19 Needham DM, Scales DC, Laupacis A, Pronovost PJ. A systematic review of the Charlson comorbidity index using Canadian administrative databases: a perspective on risk adjustment in critical care research. J Crit Care. 2005;20(1):12–9.
20 Quan H, Parsons GA, Ghali WA. Validity of information on comorbidity derived rom ICD-9-CCM administrative data. Med Care. 2002;40(8):675–85.
21 Malenka DJ, McLerran D, Roos N, Fisher ES, Wennberg JE. Using administrative data to describe casemix: a comparison with the medical record. J Clin Epidemiol. 1994;47(9):1027–32.
22 Kieszak SM, Flanders WD, Kosinski AS, Shipp CC, Karp H. A comparison of the Charlson comorbidity index derived from medical record data and administrative billing data. J Clin Epidemiol. 1999;52(2):137–42.
23 Humphries KH, Rankin JM, Carere RG, Buller CE, Kiely FM, et al. Co-morbidity data in outcomes research: are clinical data derived from administrative databases a reliable alternative to chart review? J Clin Epidemiol. 2000;53(4):343–9.
24 Jollis JG, Ancukiewicz M, DeLong ER, Pryor DB, Muhlbaier LH, et al. Discordance of databases designed for claims payment versus clinical information systems. Implications for outcomes research. Ann Intern Med. 1993;119(8):844–50.
25 Wong A, Boshuizen HC, Schellevis FG, Kommer GJ, Polder JJ. Longitudinal administrative data can be used to examine multimorbidity, provided false discoveries are controlled for. J Clin Epidemiol. Mar 29 2011.
26 Yiannakoulias N, Svenson LW, Hill MD, Schopflocher DP, Rowe BH, et al. Incident cerebrovascular disease in rural and urban Alberta. Cerebrovasc Dis. 2004;17(1):72–8.
27 Iezzoni LI. Assessing quality using administrative data. Ann Intern Med. 1997;127(8 Pt 2):666–74.