Health economic modelling of the cost-effectiveness of microalbuminuria screening in Switzerland
DOI: https://doi.org/10.4414/smw.2012.13508
Reto
Kessler, Gérald W
Keusch, Thomas D
Szucs, John S
Wittenborn, Thomas J
Hoerger, Urs
Brügger, Simon
Wieser
Summary
PRINCIPLES: Current evidence indicates that chronic kidney disease (CKD) can be detected by simple laboratory tests. This study aimed to evaluate the cost-effectiveness of microalbuminuria screening and subsequent treatment in different populations.
METHODS: Cost-effectiveness of microalbuminuria screening in a cohort of simulated subjects aged ≥50 years was assessed using a validated microsimulation model. Microalbuminuria screening was simulated for 1-, 2-, 5- or 10-year intervals and for 3 groups: diabetes (DM), hypertension but no diabetes (HTN), and no diabetes or hypertension. Positive microalbuminuria screening was followed by treatment with angiotensin-converting enzyme (ACE) inhibitors or angiotensin II receptor blockers (ARBs). The model outcomes evaluate costs from a health care system perspective.
RESULTS: Screening of risk groups is cost-effective at a 2-year interval for the DM group with an incremental cost-effectiveness ratio (ICER) of 54,000 CHF/ Quality-Adjusted-Life-Years (QALY) and at a 5-year interval for the HTN group with an ICER of 33,000 CHF/QALY. Screening of the remaining population is cost-effective at a 10-year interval with an ICER of 34,000 CHF/QALY. The ICER improves with longer screening intervals for all groups. A probabilistic sensitivity analysis (PSA) confirmed 2-year, 5-year and 10-year intervals as the most cost-effective for the DM group, the HTN group and the remaining population respectively.
CONCLUSIONS: Microalbuminuria screening can be considered cost-effective starting at the age of 50 years at bi-annual intervals for subjects with diabetes, at 5-year intervals for subjects with hypertension and at 10-year intervals for the remaining population. Our results indicate that early detection and treatment of CKD might lead to optimised patient care, and offer guidance for future implementation of CKD screening programmes.
Introduction
Chronic kidney disease (CKD) is a major public health problem with a worldwide prevalence of around 13% and enormous associated costs. Aging populations and the rise of diabetes, hypertension and obesity are expected to further increase the prevalence of CKD in the near future [1, 2].
End-stage renal disease (ESRD) is associated with high mortality and a significant cost burden. In Switzerland, ESRD subjects on dialysis represent about 0.05% of the population. Average yearly costs of 78,000 CHF per ESRD patient correspond to 1.1% of the total health care expenditure covered by social health insurance [3, 4]. Not only ESRD but also less severe CKD stages 2–4 are associated with high health care costs due frequent medical treatments [5, 6].
Currently there is no cure for CKD. However the rate of disease progression and associated morbidity and mortality can be reduced. Several studies have demonstrated that an early intervention, for example with angiotensin-converting enzyme (ACE) inhibitors or angiotensin II receptor blockers (ARBs), can slow the progression of renal decline and reduce the cardiovascular (CV) morbidity [1].
CKD is often unrecognised, but can be detected by simple tests with acceptable reliability [7, 8]. Since CKD is “common, harmful and treatable” it seems to be a condition predisposed for national screening programmes [7]. Public awareness campaigns for screening programmes of high risk groups such as people with diabetes, hypertension and a history of CV disease have recently been recommended for each country [2, 9, 10]. In addition to the high risk groups, broader targeted screening for people of an older age, with a family history of kidney disease or other cardiovascular risk factors has been suggested as well [9]. However before implementation, the cost-effectiveness of these programmes should first be evaluated in the frame of the country specific health care system and cost structure. Only a few health economic evaluations of such programmes have been performed to date. While a Dutch study indicated that microalbuminuria screening of the general adult population followed by treatment with ACE inhibitors could be cost-effective, other studies recommended only the testing and subsequent treatment of selected high risk populations such as people with diabetes or hypertension [11–14].
The aim of this study was to estimate, for the first time, the cost-effectiveness of microalbuminuria screening for CKD in different patient populations in the frame of the Swiss health care system. We adapted a recently developed CKD microsimulation model and report the results for different screening scenarios from a health care system perspective [15].
Methods
We performed a cost-effectiveness analysis of microalbuminuria screening in Switzerland by adapting a microsimulation model which was recently developed for the US [14, 15]. The adaptation to the Swiss context covered the following model parameters: 1) prevalence and incidence of risk factors for CKD, 2) demography (racial composition, all-cause mortality) and 3) cost of screening and treatment. When an adaptation was not possible due to lack of Swiss data, this is stated explicitly in the Tables 1 to 3 describing the model parameters.
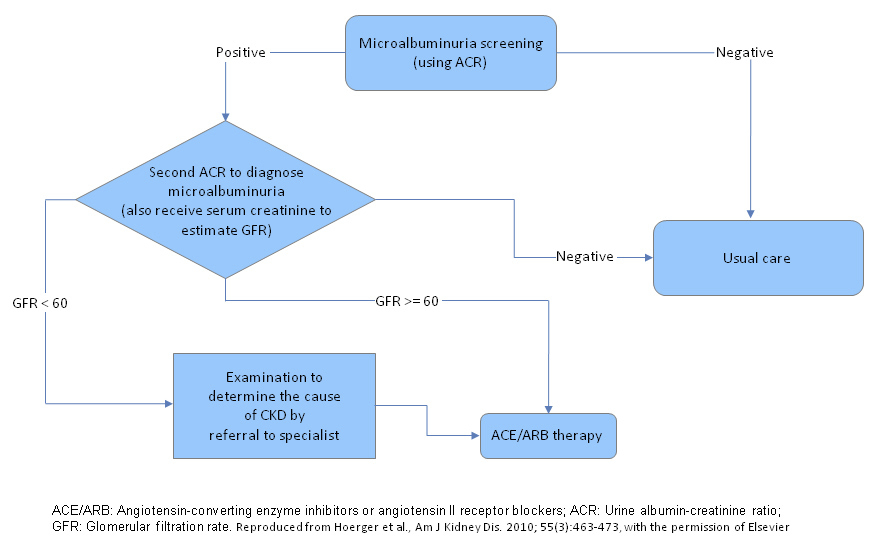
Figure 1
Scheme of screening and treatment interventions.
ACE/ARB: Angiotensin-converting enzyme inhibitors or angiotensin II receptor blockers; ACR: Urine albumin-creatinine ratio; GFR: Glomerular filtration rate.
The same screening and treatment scheme does apply for patients with macroalbuminuria. Such patients will also be detected in a microalbuminuria screening.
Modified and reproduced from Hoerger TJ, Wittenborn JS, Segel JE, Burrows NR, Imai K, Eggers P, et al.Am J Kidney Dis. 2010:55(3):463–73, with the permission of Elsevier.
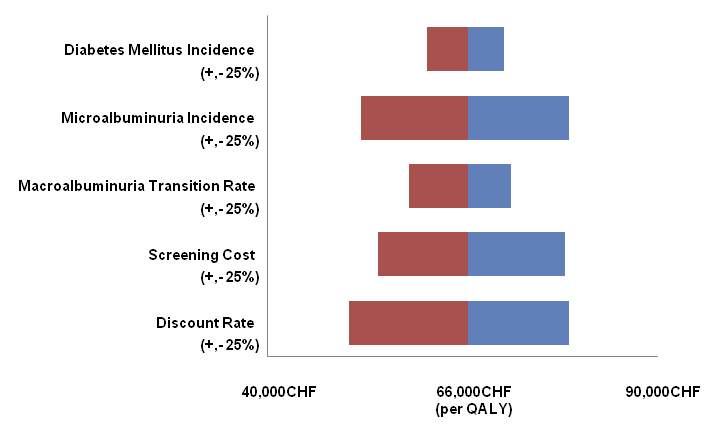
Figure 2
Sensitivity Analysis.
One-way sensitivity analysis, which shows the impact of a change in key parameters of plus or minus 25%, depicted by red and blue bars, on the cost-effectiveness ratio of annual screening versus no screening of the full population, starting at age of 50 years.
The current analysis was carried out from a Swiss health care system perspective.
Model structure
The model has been described in detail previously [14, 15]. Briefly, the model simulates a cohort of persons from age 30 until age 90 or death. The model includes seven states: no CKD, CKD stages 1–5, and death. The classification of CKD stages is based on the Kidney Disease Outcomes Quality Initiative (KDOQI) guidelines and is defined by glomerular filtration rate (GFR) and the presence of kidney damage/albuminuria. Disease parameters are derived from the epidemiological literature, clinical trials, and a previous cost-effectiveness study by Boulware et al. [13].
Progression through CKD stages is governed by kidney damage status and estimated GFR (eGFR). Kidney damage is typically ascertained by testing for the presence of elevated albumin (albuminuria) in the urine. The model tracks kidney damage based on two levels of albuminuria; persistent microalbuminuria (sustained albumin-creatinine ratio [ACR] between 30 and 299 mg/g) and macroalbuminuria (ACR ≥300 mg/g). We simulated kidney damage by initially assigning the prevalence of microalbuminuria at age 30 years and then including an annual incidence of persistent microalbuminuria and an annual rate of progression from micro- to macroalbuminuria.
Death is simulated by assigning each individual an annual background mortality rate. CKD multipliers reflecting the elevated mortality risk from CKD, cardiovascular disease (CVD) mortality rates determined by myocardial infarction (MI) and stroke events, and ESRD mortality rates were applied per subject according to their status during simulation. Risk factors and medical events are simulated annually based on probability functions as described in the orginal publication [15]. Model risk factors include diabetes status, systolic blood pressure (SBP) and hypertension, left ventricular hypertrophy (LVH), total and high-density lipoprotein (HDL) cholesterol, and smoking status. Discrete medical events that are modelled include stroke and coronary heart disease (CHD), including MI and angina. Individual-level risk factors and events are simulated for all CKD stages except ESRD, which is modelled by assigning mean population cost, mortality, and utility values. We assume that patients who survive 1 year in stage 5 begin ESRD (we do not model improvement in eGFR following transplant) [15].
The model is programmed in TreeAge Pro 2008 (TreeAge Software, http://www.treeage.com ).
Screening and treatment interventions
In our simulation, confirmed micro- or macroalbuminuria was followed by treatment with ACE inhibitors or ARBs (fig. 1). We analysed the cost-effectiveness of different screening rates beginning at age 50, ranging from 10-year screening intervals to an annual screening. The different intervals were applied universally to the total cohort or specifically to subgroups with varying risk factors for CKD: subjects with diabetes, subjects with hypertension and no diabetes, and subjects with neither diabetes nor hypertension. The impact of universal screening was also investigated at various starting ages.
In order not to overestimate the benefit of microalbuminuria testing, the modelled screening interventions were compared to a “no-screening” scenario (in this scenario CKD would only be diagnosed at the advanced stage of renal failure/ESRD) as well as to a “usual care” scenario. The “usual care” scenario takes into account that there is already a base level of microalbuminuria screening in daily clinical practice. For the model, the probability for base screening activity was taken from the US Renal Data System, which is 23% for subjects with diabetes and hypertension, 22% for subjects with diabetes only, 2% for subjects with hypertension and no diabetes and 0% for subjects with neither diabetes nor hypertension [14].
The model takes into account the published sensitivity (73%) and specificity (96%) of microalbuminuria testing [16]. Screening and treatment parameters of the model are depicted in table 1 and include potential benefits resulting from ACE inhibitor or ARB therapy after the diagnosis of CKD. Suboptimal treatment adherence is incorporated by the assumption that only 75% of subjects will initiate ACE inhibitor or ARB treatment after diagnosis. The model accounts for potential harm of screening as well. The probability and associated costs for both side effects secondary to ACE inhibitor or ARB and complication due to renal biopsy have been integrated into the model (Boulware et al., 2006 [13] for probability of complications secondary to ACE inhibitor and ARB; personal communication Prof. Andreas Bock for cost of biopsy complication; personal communication Dr. Andrea Albinger for cost of side effects to ACE inhibitor and ARB).
In the model, subjects with confirmed micro- or macroalbuminuria are referred to a nephrologist by the general practitioner (GP). To assess the probability of a patient to undergo renal biopsy after referral in Switzerland, we sent out a questionnaire to 12 heads of nephrology departments in University hospitals or large cantonal hospitals as well as to one private dialysis unit (Swiss survey 2010). We received responses from 5 centres, representing approximately 10% of all Swiss dialysis subjects, and took the average of the 5 answers as input for the model (table 1).
|
Table 1: Screening and treatment parameter incorporated into the model. |
|
Parameter
|
Value°
|
Source
|
Swiss specific data source
|
|
Usual care (annual screening rates) for subjects with:
|
| DM
HTN
DM and HTN
No DM, no HTN |
0.22
0.02
0.23
0 |
[45]
[45]
[45]
assumption |
no
no
no
no |
|
Probability of biopsy during screening:
|
| Age <65, macroalbuminuria, no DM, no HTN
Age <65, no macroalbuminuria, no DM, no HTN
Age 65+, no DM, no HTN
DM or HTN |
0.90
0.50
0.30
0.10 |
[4]
[4]
[4]
[4] |
yes
yes
yes
yes |
|
Treatment adherence
|
0.75 |
[46] |
no |
|
Effect of Treatment*:
|
| Micro- to macroalbuminuria transition
Mortality
Annual glomerular filtration rate |
0.45
0.77
0.67 |
[47]
[46]
[48, 49, 50] |
no
no
no |
| DM: Diabetes Mellitus; HTN: Hypertension
° Value represents the relative risk/probability of an event, effect or behaviour.
* Assumed treatment with ACE inhibitor or Angiotensin II receptor blocker; relative risks are multiplied by baseline rates of patients with no treatment (e.g. baseline probability of transition from micro- to macroalbuminuria for a patient with DM is 0.0284. Treatment with an ARB reduces this probability by 55% to 0.0128 (0.0284x0.45). |
Population characteristics, epidemiology of CKD and associated risk factors
To adapt the US model of Hoerger et al. [15] to the Swiss specific situation, we modified certain demographic parameters. Demographic data for age 30 years was taken as available from the demographic tables published by the federal office of statistics for 2008 [17]. Race was also modified as follows: Caucasian men: 50.193% (male population from age 20 to 39 years minus Afro-Caribbean and Hispanic male proportion), Afro-Caribbean men: 0.005% (Afro-Caribbean origin males without age distinction), Hispanic men: 0.002% (South American origin males without age distinction), Caucasian women: 49.792% (female population from age 20 to 39 years minus Afro-Caribbean and Hispanic female proportion), Afro-Caribbean women: 0.004% (Afro-Caribbean origin females without age distinction), Hispanic women: 0.004% (South American females without age distinction).
The model takes into account the annual probability of death for each subject. The all-cause mortality rates for men and women were taken from the Swiss Federal Office of Statistics [18]. The calculations for the incremental mortality risk in subjects with CV disease and/or CKD were performed according to the original publication [15]. Due to the lack of published Swiss data for ESRD mortality, we used data from the USA [15].
The prevalence of smoking for Switzerland was taken from the Swiss health survey 2007for people between 25 and 64 years. The prevalence was 32.2% for men and 23.6% for women, respectively [19].
Prevalence data of micro- and macroalbuminuria in men and women with or without diabetes or hypertension were extracted from the CoLaus study [20]. The CoLaus cohort consists of 6,188 subjects aged 35 to 75 years from the Caucasian population of Lausanne. Thus, although this population is suitable for our analysis, it is not perfectly representative for Switzerland. The urban CoLaus cohort from Western Switzerland represents neither the rural regions nor the Swiss German and Swiss Italian parts of the country. To calculate the prevalence of microalbuminuria, the same definitions as in the original paper were applied [15]. Microalbuminuria was defined as an albumin-creatinine ratio (ACR) of 30 to 299 mg/g and macroalbuminuria as an ACR of ≥300 mg/g, respectively. Data for the model were gathered in a post-hoc analysis (Murielle Bochud, personal communication, September 2010). We calibrated microalbuminuria incidence and micro- to macroalbuminuria transition rates such that the model replicated the age and risk-factor specific prevalence of micro and macroalbuminuria observed in the CoLaus study. The baseline prevalence of persistent microalbuminuria at an age of 30 years applied in the model was in the range of 0 to 1.9% for the different risk groups. We transformed age category specific micro and macroalbuminuria prevalence rates identified in the CoLaus study into incidence rates. We then used linear programming to identify micro to macroalbuminuria transition rates that would most closely match overall macroalbuminuria prevalence. Finally we inflated the microalbuminuria incidence and macroalbuminuria transition rates to account for elevated mortality in these groups as observed in the model. In certain risk groups of the CoLaus study the prevalence of macroalbuminuria was lower among older patients. Possible explanations for this result include uncertainty in the point estimates due to the small sample size, selection bias among older age groups, and an artefact of higher mortality rates among persons with high levels of albuminuria. Although our model includes higher mortality due to the direct and indirect results of macroalbuminuria, the model nonetheless could not replicate the level of decline observed in the CoLaus sample, and thus might overestimates macroalbuminuria at older ages. However, the model’s predicted age, race and risk-factor specific macroalbuminuria prevalence remains well below the prevalence observed in the large US-based NHANES sample [21].
An important risk factor of CKD is diabetes. It accelerates CKD progression and results in higher rates of CV complications and mortality. In order to adjust the model to the Swiss-specific situation, the data input was changed. Due to a lack of similar published Swiss data, based on identical definitions of diabetes (sum of diagnosed diabetes and undiagnosed diabetes, defined as fasting plasma glucose ≥7 mmol/L), the comparative prevalence data (diabetes defined as fasting plasma glucose ≥7 mmol/L) from the diabetes atlas of the International Diabetes Federation for 2010 were considered [22]. For the USA, the given prevalence rate of diabetes is 10.3% for 2010, while it is 8.9% for Switzerland. Thus, we multiplied the prevalence and incidence data in the model by 0.86 for men in order to adjust the values for Switzerland. To reflect the lower diabetes prevalence in women [24], a coefficient of 0.72 was applied to multiply the US incidence. The baseline diabetes prevalence at the age of 30 years applied in the model was 1.4% for men and 0.6% for women, respectively.
The original model uses systolic blood pressure values per age and sex groups. Hypertension is assigned in the model if systolic blood pressure is >140 mm Hg. We were not able to identify identical Swiss data. However, since a comparison of two analogous studies from the USAand Switzerland showed almost identical data, we used the original values from the model [23, 24]. The coefficients from the two studies for different age groups lay between 0.99 to 1.01 for men and 0.93 to 1.0 for women.
In our simulation, positive screening for microalbuminuria is followed by a second physician visit to confirm its presence (fig. 1). Subjects with confirmed microalbuminuria and diabetes received an ARB and subjects with confirmed microalbuminuria and with or without hypertension received an ACE inhibitor. All subjects with confirmed microalbuminuria and an estimated glomerular filtration rate (GFR) of <60 mL/min/1.73 m2 were referred to a nephrologist for further diagnostic tests. Each patient with confirmed microalbuminuria and neither hypertension nor diabetes received three GP visits per year and every diagnosed patient had an extra annual specialist visit. An additional GP visit was not incorporated for patients with diabetes or hypertension, since it was assumed that they were already under routine care.
The described annual follow-up visits of patients with confirmed microalbuminuria are based on the daily clinical practice of CKD management in the USA [13] and in Switzerland (personal communication Dr. G. Keusch, Dr. Thomas Saner, Nicole Leuzinger and Yuki Tomonaga).
Costs
The following types of costs were included in the model: annual expected medical costs for early CKD stages and those for stage 5 and ESRD, direct screening costs and related medical treatment costs. Screening and medical costs were inflated to 2010 CHF using an annual inflation rate of 3.1%. This inflation rate represents the average increase of the health care costs for people between 25 to 35 years from 2001 to 2009 [25].
The costs for early CKD stages in the original publication of the model were derived from a privately insured non-profit group model HMO (Health Maintenance Organisation), which provides comprehensive health care coverage to 450,000 Americans in the Northwest area of the USA [6, 15, 26]. The US derived data were adjusted to the Swiss situation where possible. The costs used for the model are depicted in table 2. The base costs (intercept) were derived from health care costs of people between ages 25 to 35 [25]. Since no published costs data for CKD stages 3 to 5 exist for Switzerland, we multiplied the intercept with the corresponding coefficients from the US data.
The incremental costs for age and sex were derived from a publication dealing with health costs risk adjustment in Switzerland [27]. Additional costs for CKD risk factors diabetes and hypertension were extracted from the defined pharmaceutical cost groups (PCG) 10 and 13 [28–30] and deviated by only 3% from the US data [14]. Annual costs for further complications were calculated using the coefficients from the publication by Hoerger et al. [14]
The costs for ESRD were calculated based on data obtained by the Swiss Association for Shared Responsibilities of Health Insurance Providers (SVK) [3]. SVK has defined a flat fee of 497 CHF for one haemodialysis (HD) session in a centre. We assumed that a patient has 3 sessions per week for the whole year. The annual costs for peritoneal dialysis (PD) are also based on a SVK flat fee and were taken from a recent publication [31]. Costs for erythropoietin treatment were added to the dialysis costs. Average dosages for HD and PD subjects were extracted from the SVK database [3] (Gabriela Krähemann, personal communication). The average dose per week amounted to 30.4 µg for HD subjects and 18.5 µg for PD subjects. The average doses were multiplied by the average price to the public per microgram for the originator drugs Aranesp®, Eprex®, Recormon® and Mircera®. To convert from international units (Eprex® and Recormon®) to microgram (Aranesp® and Mircera®), a conversion factor of 200:1 was applied. At the time of analysis no biosimilars of erythropoietin were prescribed to subjects in the SVK database. Annual costs for ESRD with a renal transplant were taken from Sandoz et al. and inflated for 2010 [31]. Annual costs for HD, PD and transplantation were weighted by their prevalence to calculate average costs for ESRD subjects (table 2) [3].
No data on CKD stage 5 pre-ESRD have been published for Switzerland. We therefore applied the coefficient from Hoerger et al. [14] between CKD stage 4 and stage pre-ESRD.
Screening costs included an initial visit with a GP to measure microalbuminuria with an ACR test. If initial testing was positive, a second visit was scheduled with the GP to confirm the microalbuminuria and to estimate the GFR. Further GP and specialist follow up visits and associated costs for laboratory analysis, radiological and pathological testing were also incorporated [13, 14]. Laboratory costs were based on the List of Analysis (AL) from the Federal Office of Public Health (Bundesamt für Gesundheit, BAG) [32]. In July 2010, the BAG announced interims add on fees, which were taken into consideration. In addition, the costs for complications of renal biopsy were taken into consideration.
Costs for physician visits, radiological and pathological examinations were extracted from the Tarmed list [33]. The different relevant positions were applied according to daily practice as communicated by Nicole Leuzinger (MPA, practice of Dr. T. Saner) for GP related costs and by Dr. Gérald Keusch (Nephrologist, Praxis and Dialysezentrum Zürich-City) for specialist related costs (table 3).
To calculate annual drug costs, we assumed that ACE inhibitors and ARBs were prescribed in the largest available pack. The approved prices to the public were extracted from the official List of Specialities (SL) in summer 2010 [34]. It was assumed that the medications were dispensed quarterly through pharmacies. The cost stabilisation contribution of 2.5%, as well as the service based remuneration to pharmacists (Leistungsorientierte Abgeltung, LOA) according to the declaration of the BAG effective since 2007 [35] were considered. For both ACE inhibitors and ARBs, the prices for originator drugs as well as corresponding generics were included in the analysis, given that the drugs had a renal indication in their summary of product characteristics [36]. Annual drug costs were calculated for the dosage used in the registration study and/or recommended in the respective summary of product characteristics (table 3). To estimate average costs per drug group, the different drug prices were weighted by their sales market share between July 2009 and July 2010 according to Swiss IMS data [37]. For example, while the approved prices of 9 available Losartan generics were very similar, their market share varied from 0.05% to 7.2%. Thus, the price of the generic Losartan market share leader, Losartan Mepha, was weighted with the cumulative market share for the group of Losartan generics.
|
Table 2: General medical cost equation. |
|
Cost item
|
Cost (CHF/patient/year)*
|
Source
|
Swiss specific data source°
|
| Intercept |
+2,418 |
[25] |
yes |
|
Demographic influence
|
| Age (per increasing year) |
+82 |
[27] |
yes |
| Gender (male) |
-246 |
[27] |
yes |
|
Influence of chronic kidney disease stage 2-4
|
| GFR 15-29 |
+15,719 |
[14, 26] |
no |
| GFR 30-59 |
+8,464 |
[14, 26] |
no |
| GFR 60-89 |
+6,288 |
[14, 26] |
no |
|
Influence of morbidities/behaviour
|
| Proteinuria |
+7,013 |
[14, 26] |
no |
| DM |
+2,931 |
[28] |
yes |
| HTN |
+1,856 |
[28] |
yes |
| Smoking |
+725 |
[14, 26] |
yes |
|
Influence of chronic kidney disease x morbidities
|
| DM X GFR 15-29 |
+5,804 |
[14, 26] |
no |
| HTN X GFR 60-89 |
-1,935 |
[14, 26] |
no |
| HTN X GFR 30-59 |
-2,902 |
[14, 26] |
no |
| HTN X GFR 15-29 |
-4,353 |
[14, 26] |
no |
|
Influence of chronic kidney disease stage 5
|
| Pre ESRD |
+31,079 |
[14, 26] |
no |
| ESRD |
+78,049 |
[3, 31, 32] |
yes |
| GFR: Glomerular filtration rate in ml/min; DM: Diabetes Mellitus; HTN: Hypertension; ESRD: End stage renal disease
* In the model, for each subject costs were added to or subtracted from the intercept according to the corresponding sex, age and morbidities.
° For parameters, where no Swiss specific data source exists, we multiplied the Swiss specific intercept with the corresponding coefficients from the US data. |
|
Table 3: Medical intervention costs. |
|
Cost item
|
Cost per item (CHF)
|
Source
|
Swiss specific data source
|
|
Screening by generalist
|
| Initial visit |
44.14 |
[13, 14, 33], Nicole Leuzinger, personal communication (July 2010) |
yes |
| Second visit if positive during first visit |
53.50 |
yes |
|
Diagnosis visit by specialist if GFR <60
|
| DM or HTN#
|
886.26 |
[13, 14], Gérald Keusch, personal communication (July 2010) |
yes |
|
Neither DM nor HTN but
|
| Macroalbuminuria and age <65* |
2,587.99 |
[13, 14], Gérald Keusch, personal communication (July 2010) |
yes |
| Microalbuminuria and age <65° |
1,737.12 |
yes |
| Age ≥65§
|
1,311.69 |
yes |
|
Annual specialist follow-up if GFR <60
|
| All diagnosed patients |
389.03 |
[13, 14], Gérald Keusch, personal communication (July 2010) |
yes |
|
3 annual generalist visits for diagnosed patients with
|
| Neither DM nor HTN |
62.43 |
[13, 14, 33], Nicole Leuzinger, personal communication (July 2010) |
yes |
|
Drug therapy
|
| DM |
569.77 |
[32, 36, 37] |
yes |
| Diagnosed patients with no DM |
244.92 |
yes |
| DM: Diabetes Mellitus; GFR: Glomerular filtration rate in ml/min; HTN: Hypertension
# Diagnostic tests + 10% chance of kidney biopsy *Diagnostic tests + 90% chance of kidney biopsy; ° Diagnostic tests + 50% chance of kidney biopsy; § Diagnostic tests + 30% chance of kidney biopsy
Example of a diagnosed patient with macroalbuminuria at age <65 years with neither HTN nor DM: CHF44.14 for initial screening visit + CHF53.50 for second screening visit + CHF2,587.99 for diagnosis visit by specialist = CHF2,685.63 total costs for screening and diagnosis. |
Quality-Adjusted-Life-Years
Quality-Adjusted-Life-Years (QALYs) were calculated as the present value of future life-years, taking into consideration the utility values for the different GFR levels as well as for CKD related complications such as myocardial infarction (MI), non-MI coronary heart disease and stroke [14].
Outcomes and statistics
Incremental cost-effectiveness ratios
The primary outcome was the incremental cost-effectiveness ratio, expressed in the additional lifetime costs resulting from an intervention divided by the impact on QALYs. Lifetime costs and QALYs were simulated for 1 million individuals for the different screening scenarios. Simulation of subjects started from the age of 30 years, but costs and QALYs were only calculated from 50 years onwards.
An annual discount rate of 3% was applied for both costs and QALYs.
Sensitivity analysis
We conducted a 1-way sensitivity analysis to evaluate the impact of various key parameters on the cost-effectiveness results. Figure 2 shows the range of ICERs for annual screening compared to routine screening in the overall population while changing key parameters + and – 25%. The following parameters were investigated:
1. CKD risk and progression factors: diabetes incidence, microalbuminuria incidence and progression to macroalbuminuria.
2. Screening costs.
3. Annual discount rate: the annual discount rate varied from 0%–5%
We also conducted a limited probabilistic sensitivity analysis (PSA) by introducing second-order variability in major parameters, including all medical costs, microalbuminuria incidence and progression to macroalbuminuria. In the PSA, we varied parameter groups simultaneously using independent multiplier values based on normal distributions for event costs and lognormal distributions for annual costs. Distributions were imputed such that the 95% confidence interval (CI) for each value ranged + or – 20% [38]. We also varied the incidence of microalbuminuria and the transition rate to macroalbuminuria. As these values were calibrated using the model, we did not have relevant sample size statistics necessary for estimating a beta distribution and therefore varied these parameters based on a normal distribution with a 95% CI with a range of + or – 20%. We ran the model as a 2-dimentional simulation with inner loop populations of 10,000 replicated 10,000 times and cost-effectiveness acceptability curves (CEACs) based on the PSA were derived. CEACs depict the probability that each scenario is the most cost-effective at any particular willingness to pay (WTP) per QALY gained based on the expected net monetary benefits, which is calculated as ΔQALY * WTP – Δcost [39].
Results
Costs and incremental cost-effectiveness ratios (ICER) were calculated for each screening intervention and compared to no screening, compared to the usual care scenario, and compared to the next less costly intervention (table 4). Costs were rounded to the nearest 100 CHF and cost-effectiveness ratios to the nearest 1,000 CHF/QALY.
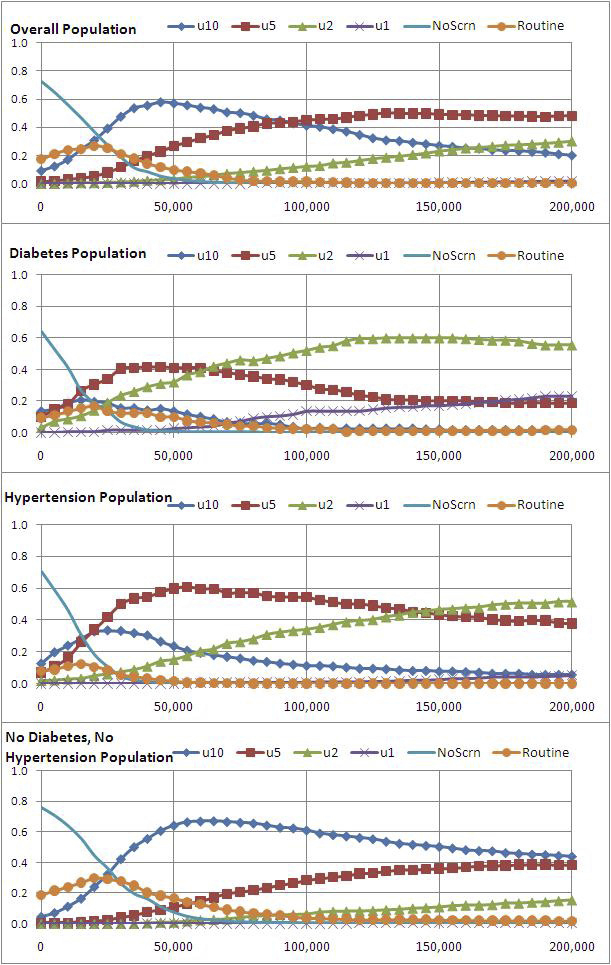
Figure 3
Cost-effectiveness Acceptability Curves.
U10: screening at 10-year interval, u5: screening at 5-year interval; u2: screening at 2-year interval: u1 annual screening; Noscrn: No screening scenario; Routine: usual care scenario
Cost-effectiveness acceptability curves show the probability of each scenario having the highest net monetary benefits (y-axis) based on willingness to pay from 0 CHF to 200,000 CHF (x-axis).
All screening scenarios increased both costs and QALYs for the total population. An annual screening has an ICER of 83,000 CHF/QALY relative to usual care and 66,000 CHF/QALY compared to no screening. Prolonging the screening interval decreases the ICER. A 10-year interval brings down the ICER to below 30,000 CHF/QALY relative to both no screening and usual-care. This screening frequency reduces the cumulative lifetime incidence of ESRD by 5%, from 0.0365 to 0.0348, compared to no screening. A 5% decrease in ESRD patients would represent a reduction of 184 ESRD subjects and associated annual costs of 14.35 million CHF.
The ICERs for screening of CKD high risk groups are also listed in table 4. For subjects with diabetes all screening scenarios have an ICER below 50,000 CHF/QALY and below 30,000 CHF/QALY compared to usual care and no screening, respectively. Due to the high expected rate of screening in usual care, a 10-year screening interval results in lower costs than usual care while achieving slightly higher QALYs.
For subjects with hypertension (no current diabetes at age 50) screening at all tested frequencies leads to an ICER of below 50,000 CHF/QALY compared to no or usual rates of screening. Screening intervals ≥5-years further reduce the ICER to ≤19,000 CHF/QALY relative to both usual care and no screening. In contrast to the CKD high risk groups, screening of subjects with neither diabetes nor hypertension is not cost-effective unless performed at an interval of at least 2 years.
Costs for the initial microalbuminuria screening visit amount to 44.14 CHF (table 3), comprising of the costs for the physician visit and the ACR testing. If the quantitative microalbuminuria test could be integrated into an ordinary scheduled check-up visit, the screening costs could be reduced to the pure ACR testing cost of 15.00 CHF. Such an approach would further improve the cost-effectiveness and bring down the ICER for an annual screening of the total population beginning at age 50 years from 66,000 CHF/QALY to 32,000 CHF/QALY.
The costs associated with one year of ESRD at 78,049 CHF would cover 5,203 ACR tests provided during pre-scheduled practice visits, which would allow for >150 newly identified subjects with persistent microalbuminuria when screening the total population at an age of 50 years [20].
Sensitivity analyses
Figure 2 depicts the results of a 1-way sensitivity analysis. The ICER of the base case is 66,000 CHF/QALY and no parameter modifications result in a change of >23% or an increase of the cost-effectiveness ratio to >79,000 CHF. Modifications in only 3 parameters led to a change of ≥20% in the cost-effectiveness ratios: microalbuminuria incidence (+20% when increasing incidence by 25%), discount rate (–23% when setting rate at 0% and +20% when setting it at 5%). Results were least sensitive to changes in diabetes incidence and micro- to macroalbuminuria transition rate.
Figure 3 shows CEACs based on the outputs of the PSA. In the overall population, screening at 10-year intervals is most likely to have the highest net marginal benefits from a WTP per QALY gained of 20,000 CHF to about 90,000 CHF, when it is overtaken by 5-year screening. Among the population with diabetes incidence at age 50, the 5-year screening interval has the highest probability of being most cost-effective from a WTP of 15,000 CHF to 60,000 CHF, when 2-year interval screening is more cost-effective. In the population with hypertension, the 5-year screening interval is probably most cost-effective from a WTP of 17,500 CHF to 140,000 CHF. For the population with no current hypertension nor diabetes, the 10-year screening interval scenario becomes cost effective at WTP greater than 25,000 CHF. For the total population as well as for the different subgroups the probability of the most cost-effective screening interval remained below 65% at the proposed ICER threshold of 71,000 CHF.
|
Table 4: Cost-effectiveness results, from 50 years onwards. |
|
|
Lifetime Costs
(CHF)
|
QALYs
|
Incremental Cost-Effectiveness Ratio (CHF/QALYs)
|
ESRD Incidence
|
|
vs. no screening
|
vs. usual care
|
vs. next less costly
|
|
Total population
|
| No Screening |
247,000 |
17.515 |
|
|
|
0.036 |
| Usual Care |
247,468 |
17.520 |
29,000 |
|
|
0.036 |
| 10-year screening |
247,682 |
17.529 |
27,000 |
26,000 |
|
0.035 |
| 5-year screening |
247,792 |
17.530 |
32,000 |
33,000 |
68,000 |
0.035 |
| 2-year screening |
248,021 |
17.531 |
44,000 |
51,000 |
231,000 |
0.034 |
| Annual screening |
248,392 |
17.531 |
66,000 |
83,000 |
1,295,000 |
0.034 |
|
DM population
|
| No Screening |
297,200 |
16.173 |
|
|
|
0.145 |
| 10-year screening |
297,800 |
16.202 |
18,000 |
|
|
0.140 |
| Usual Care |
297,870 |
16.202 |
22,000 |
|
|
0.140 |
| 5-year screening |
297,890 |
16.208 |
18,000 |
3,000 |
|
0.139 |
| 2-year screening |
298,100 |
16.211 |
22,000 |
22,000 |
54,000 |
0.139 |
| Annual screening |
298,400 |
16.213 |
29,000 |
49,000 |
241,000 |
0.138 |
|
HTN population
|
| No Screening |
252,400 |
16.888 |
|
|
|
0.054 |
| Usual Care |
252,600 |
16.895 |
27,000 |
|
|
0.052 |
| 10-year screening |
252,700 |
16.906 |
18,000 |
11,000 |
|
0.051 |
| 5-year screening |
252,800 |
16.909 |
19,000 |
15,000 |
33,000 |
0.051 |
| 2-year screening |
253,000 |
16.910 |
26,000 |
25,000 |
163,000 |
0.050 |
| Annual screening |
253,300 |
16.910 |
40,000 |
47,000 |
1,339,000 |
0.050 |
|
No current DM or HTN
|
| No Screening |
247,200 |
18.201 |
|
|
|
0.017 |
| Usual Care |
247,300 |
18.203 |
31,000 |
|
|
0.017 |
| 10-year screening |
247,600 |
18.212 |
34,000 |
34,000 |
|
0.016 |
| 5-year screening |
247,700 |
18.213 |
41,000 |
43,000 |
155,000 |
0.016 |
| 2-year screening |
248,000 |
18.213 |
58,000 |
64,000 |
380,000 |
0.016 |
| Annual screening |
248,400 |
18.213 |
88,000 |
100,000 |
2,064,000 |
0.016 |
| QALYs: Quality-Adjusted-Life-Years; ESRD: End-stage renal disease; DM: Diabetes Mellitus; HTN: Hypertension
The scenarios are ranked according to increasing costs for each population. |
Discussion
In this study we demonstrated that microalbuminuria screening starting at an age of 50 years is cost-effective for subjects with diabetes or hypertension with intervals of 2 or 5 years, respectively. In contrast to the situation in CKD high risk groups, screening of the total population or subjects with neither diabetes nor hypertension can only be considered cost-effective when conducted at 10-year intervals.
Various definitions of the threshold for judging the cost-effectiveness of an intervention exist. While the National Institute for Health and Clinical Excellence (NICE) in the UK proposes a band width of £20,000/QALY to £30,000/QALY, the World Health Organization (WHO) considers a value below the annual per capita gross domestic product (GDP), which amounted to 71,000 CHF in 2008 in Switzerland, as very cost-effective [40]. Another reference value often used in the literature is $50,000/QALY [41]. In order to judge the cost-effectiveness of our results we relate to the WHO recommendation.
The cost-effectiveness ratios for annual screening of subjects with diabetes or hypertension are below 50,000 CHF/QALY and thus appear cost-effective according to the various thresholds proposed. However, the cost-effective screening frequency has to be determined by looking at the ICERs comparing a lower versus a higher screening frequency. The screening of the DM population is cost-effective at a 2-year frequency, as the ICER of 54,000 CHF is below the threshold of 71,000 CHF, while it is above the threshold at an annual frequency (ICER of 241,000 vs. 2-year frequency). This result is confirmed by the PSA as the 2-year screening has the highest probability of being the most cost-effective intervention starting from a threshold of around 50,000 CHF. The screening of the HTN population is cost-effective at a 5-year frequency (ICER of 33,000 vs. 10-year frequency) but not at a 2-year frequency as the ICER of 163,000 CHF is above the threshold. This result is confirmed by the PSA, where the 2-year frequency dominates the 5-year frequency from a threshold of around CHF 150,000. The screening of the non DM or HTN population is cost-effective at a 10-year frequency with an ICER of 34,000 versus usual care.
Since screening for micro-albuminuria will identify subjects at a very early disease stage, prolonging the screening interval will not have a major negative impact on the cumulative lifetime ESRD incidence.
Integrating quantitative ACR testing into pre-scheduled routine checkups would reduce initial screening costs and further improve the cost-effectiveness of the screening intervention in all patient groups. Hoerger et al. [14] demonstrated that initiating screening at the age of 50 years provides the optimal cost-effectiveness for subjects with diabetes and hypertension in the US setting. However, for the total population a starting age of 60 years would lead to an improved cost-effectiveness ratio.
Recent reports have shown that, as in many other countries, there is a high level of unrecognised renal disease in Switzerland. The investigators of the Swiss SALPADIA study found, in a large, healthy, general population (n = 6,317), a prevalence of CKD stages 3–5 (defined as eGFR <60 mL/min/1.73 m2) of 13% for men and 36% for women, at an age of ≥65 years [24]. In a large population based cohort (n = 6,188) of subjects aged 35 to 75 years from the city of Lausanne (the CoLaus cohort) that the prevalence of microalbuminuria was 6.3% [20]. Finally, in the frame of a pharmacy based screening activity, 22% of 800 voluntarily tested individuals had detectable microalbuminuria. According to an applied renal risk score, comprising of ACR level, familial and personal anamnesis and blood pressure, 75% of all screening participants had a moderate to high CKD risk and were referred to their GP for further testing [42]. Hence, there is a high prevalence of subjects with putative early stages of CKD in Switzerland, who could potentially benefit from a CKD screening programme and subsequent treatment interventions.
A further US study assessed macroalbuminuria screening using a dipstick test during a GP visit followed by ACE inhibitor or ARBs treatment for the general population or subjects with hypertension [13]. The initial screening costs amounted to $44.15 and were significantly lower than in the simulation of Hoerger et al. [14]. However, since the prevalence of macroalbuminuria is several times lower than the one for microalbuminuria, CKD subjects are only identified later in the disease progression and at higher costs, and have thus a reduced opportunity to benefit from medical interventions. Nevertheless, the results of Boulware et al. [13] support annual screening of subjects with hypertension, even starting at an age of 30 years, from a societal perspective. Screening of the general population only becomes favourable at longer screening intervals and/or when starting at an age of ≥50 years.
Based on data of the large PREVEND cohort (n = 8,592) of people aged 28 to 75 years, Dutch investigators described a total population-based, one-time microalbuminuria screening as being cost-effective over a period of 8 years with an estimated € 22,000 per life year gained [12]. In the frame of the PREVEND study, a cheap microalbuminuria pre-screening was done. Participants were invited to send a vial with their first morning void of urine to a central laboratory by mail. This approach allowed the initial screening costs to be limited to € 7, which is much lower than in the previously discussed studies. Another important difference in the Dutch study is the fact that they included hospitalisations for various CV events in the model costs. Adding these costs improves the cost-effectiveness of early CKD detection and subsequent medical intervention with ACE inhibitors. A clear strength of the model of Boersma et al. [12] is the integration of epidemiological and efficacy data out of a large population-based observational cohort.
The microsimulation model applied for this study has several strengths and limitations, which have previously been described [14, 15]. The most important strengths are the comprehensiveness of the model including all stages of CKD, risk factors, complications, treatment adherence and possible harm of interventions. The most important limitations are the extrapolation of data from shorter studies for long term modelling, not considering costs for CV complications and restricting costs to medical interventions. The study of Boulware et al. [13] demonstrated that indirect costs due to lost wages for nonworking subjects were an important contributor to the cost-effectiveness when analysing the situation from a societal perspective.
Our cost-effectiveness analysis for Switzerland has several limitations as well. Since we have not been able to gather identical Swiss specific information for all epidemiological data and medical intervention costs, we were in some cases obligated to run the model with data and assumptions from the USA. While it was possible to identify local epidemiological data for micro- and macroalbuminuria, we had to refer to the information from the International Federation of Diabetes to get comparable data for the diabetes incidence and prevalence. However, comparing other sources for diabetes prevalence in the USA and Switzerland points to a slightly lower coefficient than the one applied in this study [19, 23, 24]. This could have led to a slight overestimation of the cost-effectiveness. On the contrary, the ICER is not very sensitive to the diabetes incidence as shown in figure 2.
With regard to the rate of microalbuminuria screening in the usual care scenario, we applied the same values for subjects with diabetes (20%), subjects with hypertension (2%) and subjects with both diabetes and hypertension (23%) as used for the US modelling. Yet the medical practice might differ in Switzerland. A recent study showed that among Swiss and German subjects with hypertension referred to a cardiologist, 53.1% had a detectable macroalbuminuria on dipstick testing that had only been pre-diagnosed in 8.95% of cases [43]. In subjects with diabetes, a microalbuminuria screening rate of 15.5% was described in 2001 for Switzerland [44]. If the current medical practice in our country would still show a lower base screening activity compared to the implemented model parameters, the cost-effectiveness would be further improved compared to the reported results relative to usual care.
Due to the fact that we had no direct access to individual patient data for both clinical parameters and for costs of medical interventions, we had to extrapolate costs for the different early CKD stages using the coefficients from the US. Nevertheless, this should not have had an important impact on our results, given that the probability analysis showed that the real values may not be much different, and the cost-effectiveness results were not very sensitive to pre-ESRD CKD stage costs [14].
Screening programmes and secondary prevention activities often meet the resistance of health policy makers and authorities. While political pressure puts the focus of politicians on short term results and visibility, the public health and costs benefits of targeted screening programmes will only become evident in the long term. Our recommendation to screen subjects with diabetes for microalbuminuria is supported by a former Swiss study, which found that a multi-factorial intervention approach could be both cost- and life-saving [44].
In conclusion, our results suggest that microalbuminuria screening and subsequent treatment of subjects with diabetes or hypertension may be cost-effective, depending on the applied screening interval. For the general population screening only becomes clearly cost-effective, when using a prolonged interval of 10-years. Future health economic modelling might benefit as more detailed Swiss specific data become available, from choosing a low fee approach for initial screening and from including costs for CV complications and indirect costs due to lost wages and opportunistic expenses. Our results may provide health care policy makers with helpful information for considering the implementation of local CKD screening and treatment guidelines.
Acknowlegments: The authors would like to thank the CoLaus investigators Murielle Bochud, Vincent Mooser, Peter Vollenweider, and Gérard Waeber for data acquisition and additional analysis. We owe thanks to Nicole Leuzinger for insights about the medical practice and related costs in a GP practice. Feedback to the Swiss Survey related to the probability of biopsy during screening has been received by Patrice Ambühl, Isabelle Binet, Andreas Fischer, Pascal Meier and Jürg Steiger. Gabriela Krähenmann, SVK provided us with data about the usage of ESA dosages in dialysis patients.
References
1 James MT, Hemmelgarn BR, Tonelli M. Early recognition and prevention of chronic kidney disease. Lancet. 2010;375(9722):1296–309.
2 Weiner DE. Public health consequences of chronic kidney disease. Clin Pharmacol Ther. 2009;86(5):566–9.
3 Swiss Union for the Social Duties of the Insurance Funds (SVK). Annual Report 2010. Available from: http://www.svk.org/willkommen-beim-svk/?PHPSESSID=11badc1b771188a4f2c11991e1dd2034. Accessed July 4, 2011.
4 Kessler R, et al. Health economic modelling of the cost-effectiveness of microalbuminuria screening in Switzerland. 42nd Annual Meeting of the Swiss Society of Nephrology, Lugano, December 1–3, 2010. P-033.
5 Lin M-Y, Hwang S-J, Mau L-W, Chen H-C, Hwang S-C, Wu L-C, et al. Impact of late-stage CKD and aging on medical utilization in the elderly population: a closed-cohort study in Taiwan. Nephrology Dialysis Transplantation. 2010;25(10):3230–5.
6 Smith DH, Gullion CM, Nichols G, Keith DS, Brown JB. Cost of medical care for chronic kidney disease and comorbidity among enrollees in a large HMO population. J Am Soc Nephrol. 2004;15(5):1300–6.
7 Grootendorst DC, Jager KJ, Zoccali C, Dekker FW. Screening: why, when, and how. Kidney Int. 2009;76(7):694–9.
8 Jaar BG, Khatib R, Plantinga L, Boulware LE, Powe NR. Principles of screening for chronic kidney disease. Clin J Am Soc Nephrol. 2008;3(2):601–9.
9 Levey AS, Atkins R, Coresh J, Cohen EP, Collins AJ, Eckardt KU, et al. Chronic kidney disease as a global public health problem: approaches and initiatives – a position statement from Kidney Disease Improving Global Outcomes. Kidney Int. 2007;72(3):247–59.
10 Szczech LA, Harmon W, Hostetter TH, Klotman PE, Powe NR, Sedor JR, et al. World Kidney Day 2009: problems and challenges in the emerging epidemic of kidney disease. J Am Soc Nephrol. 2009;20(3):453–5.
11 Atthobari J, Asselbergs FW, Boersma C, de Vries R, Hillege HL, van Gilst WH, et al. Cost-effectiveness of screening for albuminuria with subsequent fosinopril treatment to prevent cardiovascular events: A pharmacoeconomic analysis linked to the prevention of renal and vascular endstage disease (PREVEND) study and the prevention of renal and vascular endstage disease intervention trial (PREVEND IT). Clin Ther. 2006;28(3):432–44.
12 Boersma C, Gansevoort RT, Pechlivanoglou P, Visser ST, van Toly FFJ, de Jong-van den Berg LTW, et al. Screen-and-treat strategies for albuminuria to prevent cardiovascular and renal disease: cost-effectiveness of nationwide and targeted interventions based on analysis of cohort data from the Netherlands. Clin Ther. 2010;32(6):1103–21.
13 Boulware LE, Jaar BG, Tarver-Carr ME, Brancati FL, Powe NR. Screening for proteinuria in US ydults: a cost-effectiveness analysis. JAMA. 2003;290(23):3101–14.
14 Hoerger TJ, Wittenborn JS, Segel JE, Burrows NR, Imai K, Eggers P, et al. A Health Policy Model of CKD: 2. The cost-effectiveness of microalbuminuria screening. Am J Kidney Dis. 2010;55(3):463–73.
15 Hoerger TJ, Wittenborn JS, Segel JE, Burrows NR, Imai K, Eggers P, et al. A health policy model of CKD: 1. model construction, assumptions, and validation of health consequences. Am J Kidney Dis. 2010;55(3):452–62.
16 Sarafidis PA, Riehle J, Bogojevic Z, et al. A comparative evaluation of various methods for microalbuminuria screening. Am J Nephrol. 2008;28(2):324–9.
17 Federal office of statistics. Annual report 2008: resident population. Demographics and migration. Available from: http://www.bfs.admin.ch/bfs/portal/de/index/themen/01/02.html. Accessed November 1, 2010.
18 Federal office of statistics, B. Annual Report 2007: statistics of cause of deaths. Available from: http://www.bfs.admin.ch/bfs/portal/de/index/themen/01/01/key.html. Accessed October 23, 2010.
19 Federal office of statistics, B. Swiss Health Survey 2007. Available from: http://www.bfs.admin.ch/bfs/portal/de/index/themen/14/22/publ.Document.118126.pdf. Accessed October 23, 2010.
20 Firmann M, Mayor V, Vidal PM, Bochud M, Pecoud A, Hayoz D, et al. The CoLaus study: A population-based study to investigate the epidemiology and genetic determinants of cardiovascular risk factors and metabolic syndrome. BMC Cardiovasc Disord. 2008;8:6.
21 Snyder JJ, Foley RN, Collins AJ. Prevalence of CKD in the United States: a sensitivity analysis using the National Health and Nutrition Examination Survey (NHANES) 1999–2004. Am J Kidney Dis. 2009;53:218–29.
22 International Diabetes Federation, Diabetes Atlas 2010: Proportion of people with diabetes (25–79 years), 2010 (comparative prevalence). Available from: http://www.diabetesatlas.org/map. Accessed November 1, 2010.
23 Cowie CCP, Rust KFP, Byrd-Holt DDB, Eberhardt MSP, Flegal KMP, Engelgau MMM, et al. Prevalence of diabetes and impaired fasting glucose in adults in the U.S. population: National Health and Nutrition Examination Survey 1999–2002. Diabetes Care. 2006;29(6):1263–8.
24 Nitsch D, Dietrich DF, von Eckardstein A, Gaspoz J-M, Downs SH, Leuenberger P, et al. Prevalence of renal impairment and its association with cardiovascular risk factors in a general population: results of the Swiss SAPALDIA study. Nephrol Dial Transplant. 2006;21(4):935–44.
25 Common institution health insurance law. Annual Report 2009: Risk adjustment statistics. Available from: http://www.kvg.org/ra/statistik/rastatistik2009_d.pdf. Accessed October 23, 2010.
26 Smith DH, et al. Predicting costs of care in chronic kidney disease: the role of comorbid conditions. Internet J Nephrol. 2007. 4, available from: http://www.ispub.com/ostia/index.php?xmlFilePath=journals/ijne/vol4n1/cost.xml. Accessed July 7, 2010.
27 Beck, K. Risiko Krankenversicherung – Risikomanagement in einem regulierten Krankenversicherungsmarkt. Bern: Haupt Verlag AG, 2004.
28 Beck, K. Nachhaltige Gestaltung des Risikoausgleichs in der Schweizer Krankenversicherung. Bern: hep Verlag AG, 2006.
29 Lamers LM, van Vliet RCJA. The pharmacy-based cost group model: validating and adjusting the classification of medications for chronic conditions to the Dutch situation. Health Policy. 2004;68(1):113–21.
30 Lamers LM, Vliet RCJA. Health-based risk adjustment Improving the pharmacy-based cost group. Eur J Health Economics. 2003;4(2):107–14.
31 Sandoz MS, Ess SM, Keusch GW, Schwenkglenks M, Szucs TD. Prevalence and direct medical costs of end-stage renal disease in patients with type 2 diabetes mellitus in Switzerland for 2001. Swiss Med Wkly. 2004;134(31-32):448–58.
32 Federal office of health (BAG). List of Analysis (AL). Available from: http://www.bag.admin.ch/themen/krankenversicherung/00263/00264/04185/index.html?lang=de Accessed October 23, 2010.
33 Tarmed Suisse. Online browser 2010: Tarmed list 2010. Available from: http://www.tarmedsuisse.ch. Accessed October 23, 2010.
34 Federal Office of Health (BAG). List of Pharmaceutical Specialties (SL). Available from: http://www.bag.admin.ch/themen/krankenversicherung/00263/00264/00265/index.html?lang=de. Accessed August 14, 2010.
35 Federal Office of Health (BAG). Service based remuneration to pharmacists (Leistungsorientierte Abgeltung, LOA). Available from: http://www.bag.admin.ch/aktuell/00718/01220/index.html?lang=de&msg-id=9928. Accessed August 14, 2010.
36 Documed AG. Small product characteristics. Available from: http://www.documedinfo.ch/content/default.aspx. Accessed August 8, 2010.
37 IMS Health. Swiss pharmaceutical market report, August 2010. Available from: http://www.imshealth.ch/Basis/Start.asp?Ber=News&Men2=News&Start=../Hnet/News100.asp&sitetype=s&gm=true. Accessed August 8, 2010.
38 Doubilet P, Begg CB, Weinstein MC, Braun P, McNeil BJ. Probabilistic sensitivity analysis using Monte Carlo simulation. A practical approach. Medical Decision Making. 1985;5(2):157–77.
39 Briggs A, Claxton K, Sculpher M. Decision modelling for health economic evaluation. Oxford: Oxford University Press, 2007.
40 Schaufler T, et al. Cinacalcet in the treatment of secondary hyperparathyroidism: a pharmaeconomic evaluation in the Swiss healthcare setting. 42nd Annual Meeting of the Swiss Society of Nephrology, Lugano, December 1–3, 2010. P-032.
41 Grosse SD. Assessing cost-effectiveness in healthcare: history of the $50,000 per QALY threshold. Expert Rev Pharmacoecon Outcomes Res. 2008;8(2):165–78.
42 Favre S, et al. Evaluation of a renal risk score in the Swiss population: consolidated results from a screening project in pharmacies in the years 2008–2010. 2010, 42nd Annual Meeting of the Swiss Society of Nephrology, Lugano, December 1–3, 2010. P-022.
43 Tebbe U, Pramlage P, Thoenes M, Paar WD, et al. Prevalence of microalbuminuria and its associated cardiovascular risk: German and Swiss results of the recent global i-SEARCH survey. Swiss Med Wkly. 2009;139(33-34):473–80.
44 Gozzoli V, Palmer AJ, Brandt A, Spinas GA. Economic and clinical impact of alternative disease management strategies for secondary prevention in type 2 diabetes in the Swiss setting. Swiss Med Wkly. 2001;131(21-22):303–10.
45 US Renal Data System. USRDS 2006 Annual Data Report: incidence of reported ESRD reference tables. Bethesda, MD: National Institutes of Health, National Institute of Diabetes and Digestive and Kidney Diseases; 2006. Table A.2, p 10. http://www.usrds.org/2006/ref/A_incidence_06.pdf. Accessed July 30, 2009.
46 Boulware LE, Jaar BG, Tarver-Carr ME, Brancati FL, Powe NR. Screening for proteinuria in US adults: a costeffectiveness analysis. JAMA. 2003;290(23):3101–14.
47 Strippoli GF, Craig M, Deeks JJ, Schena FP, Craig JC. Effects of angiotensin converting enzyme inhibitors and angiotensin II receptor antagonists on mortality and renal outcomes in diabetic nephropathy: systematic review. BMJ.2004;329:828.
48 Agodoa LY, Appel L, Bakris GL, et al. Effect of ramipril vs. amlodipine on renal outcomes in hypertensive nephrosclerosis: a randomized controlled trial. JAMA.2001;285:2719–28.
49 Ruggenenti P, Perna A, Mosconi L, et al; GISEN Group. Randomised placebo-controlled trial of effect of ramipril on decline in glomerular filtration rate and risk of terminal renal failure in proteinuric, non-diabetic nephropathy. Lancet.1997;349:1857–63.
50 Ruggenenti P, Perna A, Gherardi G, et al. Renoprotective properties of ACE-inhibition in non-diabetic nephropathies with non-nephrotic proteinuria. Lancet.1999;354:359–64.