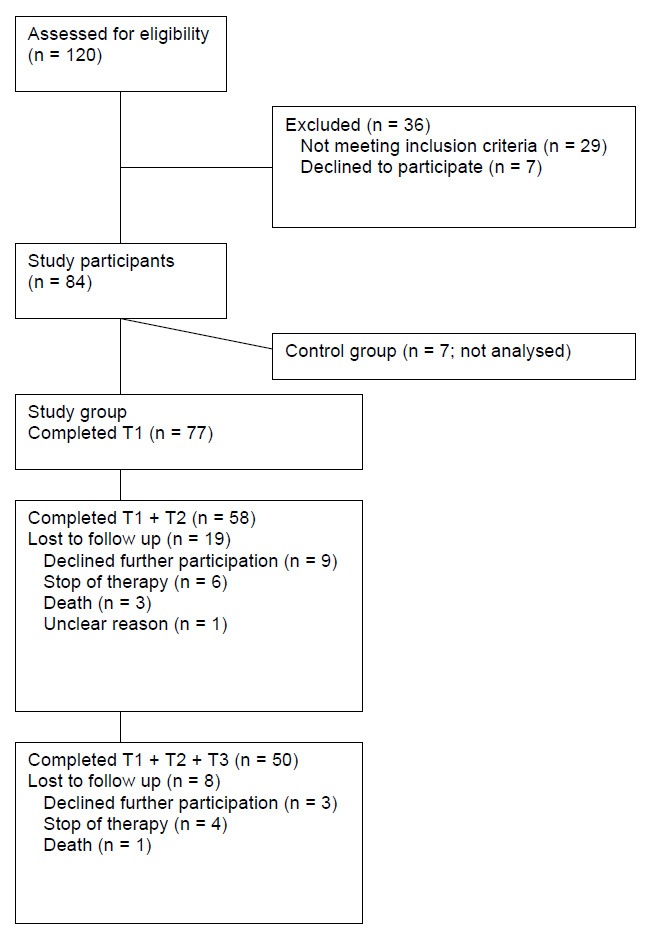
Figure 1
Overview of patient accrual and retention.
DOI: https://doi.org/10.4414/smw.2011.13303
Patients with cancer receiving chemotherapy commonly experience multiple symptoms; these symptoms are related to the disease itself as well as to side effects of antitumor treatments [1]. Symptom research has focused on single symptoms [2]. With a systematic literature review, we found only six studies that explored prevalence of a range of symptoms in patients with chemotherapy. One study showed that a mean number of six symptoms within 56 days of starting chemotherapy were present in 80 patients newly diagnosed with lung cancer; fatigue was most frequent (in 97% of patients), followed by pain, nausea, constipation, insomnia and poor appetite, which were present in more than 50% of the patients [3]. In 154 patients with lung cancer at any stage of their chemotherapy, lack of energy, coughing, pain, lack of appetite, nausea, feeling nervous, difficulty sleeping, feeling sad, and worrying were most common, lack of energy was most distressing [4]. Another study showed that in 192 patients with lymphoma, breast or gastrointestinal cancer starting their first ever chemotherapy, pain, tiredness and difficulty sleeping were most prevalent [5], while fatigue, oral problems and insomnia were most frequent in 462 patients starting chemotherapy with lung, gastrointestinal and gynaecological tumors [6]. In a longitudinal study, 25 Chinese American patients with different cancers experienced on average 14 symptoms over three weeks during the second or third chemotherapy cycle. Lack of energy was most prevalent at each measurement point; other frequent symptoms were dry mouth, hair loss, difficulty sleeping, lack of appetite, and feeling sad [7]. In 133 women with stage I and II breast cancer receiving adjuvant chemotherapy after primary breast surgery, fatigue, emotional upset, sleep problems, pain, drowsiness and problems with concentrating were most frequent pre-treatment, while fatigue, sleep problems, hair loss, change in taste, muscle weakness, drowsiness and hot flashes were most prevalent at the end of chemotherapy [8].
Although variability in samples, designs, measurement instruments, and health care systems [9–11] makes detailed comparisons of symptom prevalences difficult, it is clear that symptom experience is a common problem in this population, among which fatigue seems to be the most frequently occurring symptom. Fatigue is not only reported in 70% to 100% of chemotherapy patients [10], patients also experience fatigue as one of the most distressing symptoms associated with cancer and its treatment [10]. Moreover, fatigue has been associated with depression, other symptoms such as pain and sleep and it negatively impacts patients’ performance status [10, 12]. Fatigue can be a consequence of anemia, a highly prevalent and treatable condition in cancer patients [10, 13].
A good management of these symptoms will be in the interest of optimal treatment, because the treatment protocol can be followed (full dosage, at designated times), which will increase the patients’ chances for cure or sustained control of the cancer [14, 15]. Uncontrolled side effects may, in addition, lead to hospitalisations, causing great burden for patients and families and increase costs of health care [16]. Symptom management should thus be a cornerstone in the clinical management of patients during chemotherapy. However, symptom treatment in general and fatigue treatment in particular are often suboptimal, even when these are treatable [10, 16, 17].
Collecting data on symptom prevalence is recognised as a valuable basis for the development of symptom management programmes [18–20], whereby the change of symptom prevalence over time provides a picture of these symptom management programmes’ effectiveness. In our literature review, we did not find any Swiss comprehensive symptom prevalence data for cancer outpatients experienced over the course of chemotherapy treatment. Because this would be beneficial for improving symptom management in this patient group; the purpose of this study was to explore the prevalence of symptoms, with a specific focus on fatigue, over approximately three months, more specifically, at start and prior to the third and fourth cycle of chemotherapy. In addition, correlates of fatigue were examined prior to the third cycle of chemotherapy.
This prospective descriptive study was conducted from March 2006 to November 2007 in the oncology outpatient clinic of a Swiss tertiary care hospital. Symptom prevalence was measured during the patients’ visit to the outpatient clinic, when the first cycle of chemotherapy was started (T1), one week prior to the start of the third scheduled cycle (T2), and one week prior to the start of the fourth scheduled cycle (T3). With this design, the focus was on symptoms related to cell toxicity rather than on more short-term side-effects of chemotherapy. The recall period was “over the last week.”
Consecutively, all eligible patients were asked for participation. Included in the study were patients diagnosed with lymphoma, breast, lung or colorectal cancer irrespective of stage of disease, starting or starting again with chemotherapy. The sample was chosen to include patients with the four most frequent malignant diseases treated in this clinic to get a more homogenous sample. Additional inclusion criteria were: expected survival of more than 3 months as assessed by the physician, able to speak, read and write in German, 18 years of age or older. Excluded were patients having had chemotherapy or radio-therapy within the last two months, with cycles of planned chemotherapy shorter than three weeks, and patients who were per physician judgment considered cognitively impaired, or with visual and/or hearing impairment preventing adequate communication.
The study was approved by the appropriate ethics committee, all participants provided written informed consent, and procedures followed were in accordance with the Helsinki Declaration. Participants completed the study questionnaires at T1 during their visit at the clinic preferably by themselves; they got help from the study nurse if needed. At T2 and T3, questionnaires were mailed to the patients, and the study nurse called to answer any questions. In order to compare participants with nonparticipants, those who declined completion of questionnaires were asked to give consent for the collection of a few demographic and clinical data from their medical records.
Symptom prevalence.The Memorial Symptom Assessment Scale (MSAS) [21, 22] was used to assess 32 cancer-related symptoms. Frequency, severity and distress were rated for present symptoms. Eight symptoms were evaluated in terms of severity and distress alone as using a frequency scale was not meaningful for these items (e.g., mouth sores). Participants could also write down additional symptoms. Symptoms were scored on a four-point Likert scale (1–4) for frequency and severity, and on a five-point Likert scale (0–4) for distress. Following previous literature, and based on the fact that correlation between the three perspectives was high, symptom scores were derived by adding frequency, severity, and distress scores and dividing this sum by three. We did not calculate, as suggested by previous authors, one total score for the scale, as a principal component analysis on our data revealed that only 22% of the variability was shared among the items. Note that as a result of the many missing data, we decided to exclude the item “Problems with sexual interest or activity.” The following results thus are based on 31 symptoms.
Fatigue and other anemia-related symptoms.Two components of the Functional Assessment of Chronic Illness Therapy (FACIT) Measurement System, the FACIT-Fatigue scale and the Anemia Additional Concerns scale were used to measure fatigue and other anemia-related symptoms [23]. The FACIT-Fatigue scale is a unidimensional measure of fatigue that contains 13 items. With the Anemia Additional Concerns scale, 7 additional miscellaneous symptoms related to anemia were evaluated. Symptoms are rated on a five-point Likert scale; scores are summed yielding total scores from 0–52 and 0–28, respectively. Higher scores mean less fatigue and other anemia related symptoms i.e., a negative scale [23]. The instruments were validated in a sample of 50 patients with various malignancies. The FACIT-Fatigue scale showed good test-retest reliability (r =0.87) and internal consistency (α = 0.93). Convergent validity of the scale was supported by high correlations with validated measures of fatigue. The scale discriminated patients by haemoglobin (Hb) level and functional status. A cut-off score of 43 discriminated best between anemic cancer patients and the general United States population [24]. The Anemia Additional Concerns scale showed good stability (r = .84), the somewhat lower internal consistency (α = 0.59) is likely due to the rather diverse items (e.g., motivation for usual activity, chest pain). The scale differentiated patients by functional status and Hb level [23, 25]. Validated German versions of the FACIT-Fatigue scale and the Anemia Additional Concerns scale were used [26]. In the current study, Cronbach’s α was 0.93 for the FACIT-Fatigue scale and 0.54 for the Anemia Additional Concerns scale at T1.
Depression and anxiety. The Hospital Anxiety and Depression Scale (HADS) was used to measure anxiety and depression, two different but overlapping and often concurrently present conditions [27]. This screening instrument for non-psychiatric patients does not assess somatic symptoms, and the items focus on mild symptoms [28]. The subscales for anxiety and depression each contain 7 items, rated on a four-point Likert scale; scores are summed yielding total scores from 0–21 for each subscale. For this German version of the HADS; Cronbach’s α was 0.80 for the anxiety and 0.81 for the depression subscales [27]. Test-retest reliability was 0.72 for anxiety and 0.75 for depression, for an interval of ≤6 weeks. In a sample of 199 German speaking cancer patients; the HADS detected depressive disorders diagnosed by DMS IV by standardised clinical interview with a sensitivity of 79% and a specificity of 76% [29]. In the current study, Cronbach’s α was 0.81 for anxiety and 0.86 for depression.
Physical performance and clinical data.Participants estimated their physical performance on the scale of the Eastern Cooperative Oncology Group (ECOG-PS). The scale contains one item on a five-point scale using verbal descriptors, with 0 referring to “fully active” and 4 referring to “completely disabled” [30, 31]. The scale is usually completed by a clinician observing the patient, but patients’ self-report has also been used [32, 33]. Demographic and clinical data, including Hb when available and anemia treatments, were obtained from the medical records.
Since the ECOG-PS and the MSAS were not available in German, these instruments were translated into German in a culturally sensitive way with forwards and backwards translation [34–36].
Data were analysed using IBM SPSS Statistics version 14 and SAS (Statistical Analysis System) 9.1. Frequencies and descriptive statistics were generated for sample characteristics, symptom prevalence, symptom scores at item level, the FACIT-Fatigue scale, the Anemia Additional Concerns scale, the HADS, the ECOG-PS, Hb levels and anemia treatments. Correlations among frequency, severity and distress scores of single symptoms were explored with the Spearman rho coefficient. Random-intercept regression analysis with generalised estimation equations was used to model symptom and fatigue over time. Each patient was allowed to have its own random intercept. We also tested associations between fatigue at baseline and a number of possible correlates of fatigue using multiple regression analysis. For all analyses, P < .05 was considered statistically significant.
Seventy seven of 91 eligible patients participated in the study. Figure 1 provides an overview of accrual and retention. The demographic and clinical characteristics of participants are summarised in table 1. Data of co-variables are given in table 2.
Figure 1
Overview of patient accrual and retention.
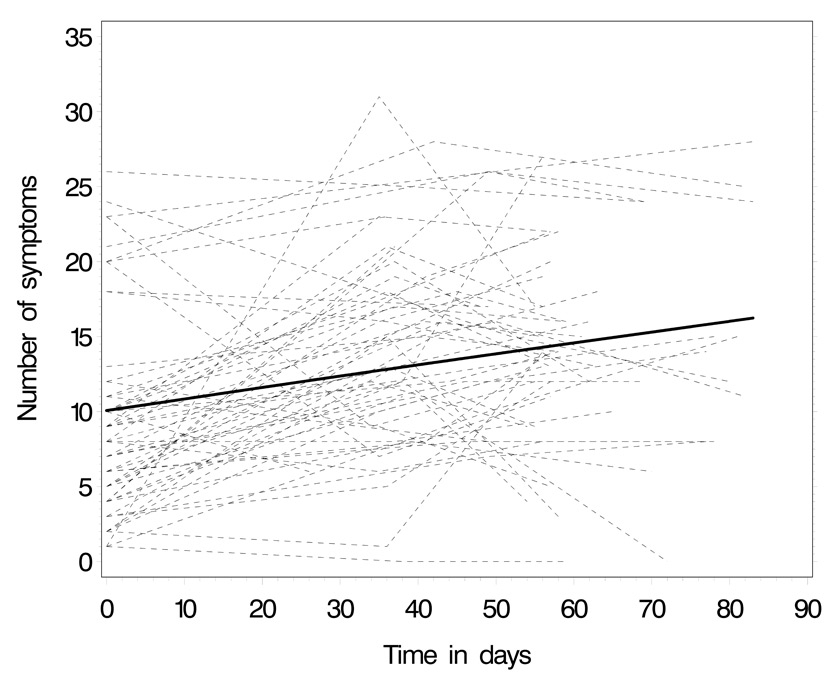
Figure 2
Predicted trend of number of symptoms over the three measurement points: thin lines represent patients’ individual trajectories, the thick line the average group trend.
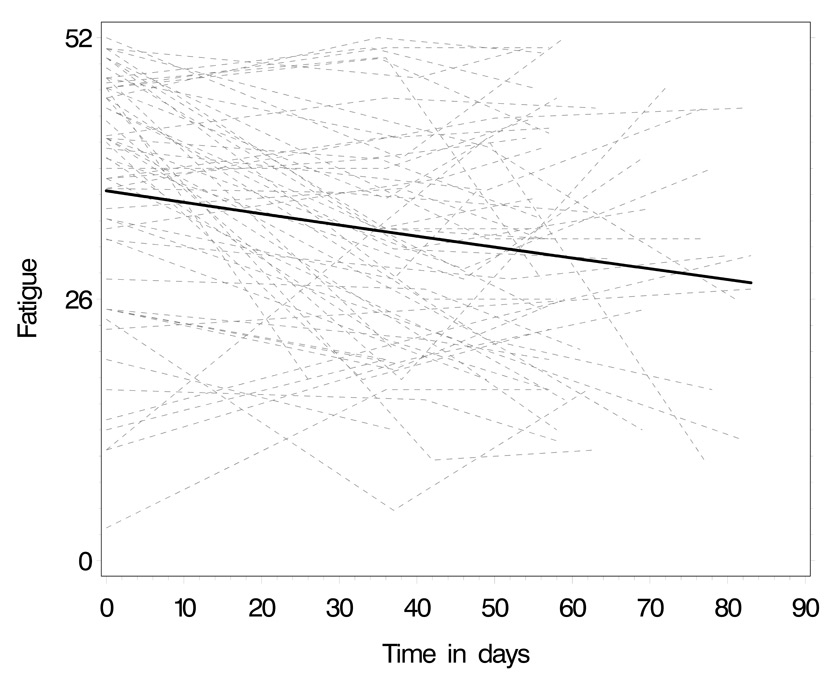
Figure 3
Predicted trend of fatigue over the three measurement points: thin lines represent patients’ individual trajectories, the thick line the average group trend. Lower scores indicate increase of fatigue.
50% of the patients had one or two comorbidities; most prevalent were diseases of the circulatory system. The performance status of most patients allowed them to be up and care for themselves. Patients were treated with a variety of chemotherapeutic agents in different combinations. Chemotherapy cycles were repeated for most patients after three to four weeks and for four patients after five weeks.
The average number of symptoms patients experienced was 9.8 (± 6.5; range 1–28) at T1, 14.4 (± 6.6; range 0–31) at T2, and 13.7 (± 6.2; range 0–27) at T3. Over the three measurement points, 25 patients reported a total of 25 additional symptoms on the “other symptoms” category of the MSAS; eye problems were mentioned six times, muscle cramps three times, dry nose, a cold, and changes in nails twice, and all other symptoms only once (e.g., fever, hiccups).
At T1, worrying was most prevalent (85.7%), followed by feeling drowsy (60.5%), lack of energy (57.9%), feeling sad (55.3%), difficulty sleeping (50.6%), and pain (49.4%). Table 3 provides an overview of patients’ experience at T2, when they indicated most symptoms. At T3, feeling drowsy was most prevalent (80%); lack of energy, worrying, difficulty sleeping, dry mouth, pain, numbness/tingling in hands/feet, feeling sad, change in the way food tastes, nausea, and difficulty concentrating were experienced by more than 50% of the patients.
Patients who experienced a certain symptom, indicated symptom scores >2 on a scale from 0 to 4 at T1, T2 and T3 for 10, 14, and 12 symptoms respectively. Scores were highest for constipation, shortness of breath, lack of appetite, changes in skin, pain, and worrying at T1, and for hair loss, changes in the way food tastes, lack of energy, numbness/tingling in hands/feet, mouth sores, and diarrhea at T3 (for scores at T2 see table 3). Scores for hair loss, diarrhea, change in the way food tastes, lack of energy, dry mouth, numbness/tingling in hands/feet, changes in skin, feeling drowsy, pain, and mouth sores were >2 at T2 and T3; lack of energy, changes in skin, pain, and feeling drowsy had symptom scores >2 at all measurement points.
Figure 2 illustrates the number of symptoms over the three measurement points. Over time, there was a significant increase in the number of symptoms reported (table 4; P = .003). Patients with a higher depression score reported more symptoms. Note that there was a lot of variation of symptom experience within patients compared to the between patient variability (intraclass correlation after adjustment = 0.27).
Exploration of symptoms over time was also conducted for all symptoms separately (data not shown). Symptom scores decreased significantly over time for cough, feeling bloated, worrying and lack of appetite. No symptom score increased significantly.
Patients’ mean fatigue scores were 36.3 (± 12.4; range 3–52) at T1, 30.2 (± 11.5; 5–52) at T2, and 31.3 (± 12.4; 10–52) at T3, with lower scores indicating more fatigue. Of 76 patients assessed at T1, 47 (62%) had fatigue scores <43; of 58 patients assessed at T2, 50 (86%) had fatigue scores <43; and of 50 patients assessed at T3, 38 (76%) had fatigue scores <43.
Figure 3 illustrates how patients’ fatigue score changed over the three measurement points. Again, the individual trajectory lines show that fatigue varied greatly within patients and among patients. A random-intercept regression model on the entire sample showed a statistically significant decrease in the fatigue scores, indicating the increase of patients’ fatigue over time (see table 5). Patients with a higher depression score on the HADS reported more fatigue. The intraclass correlation of 0.47 indicated that within-patient variability was somewhat smaller than in the symptoms model.
At T2, exploring associations between fatigue as outcome variable and the potential correlates anemia (variables Hb and other anemia-related symptoms), depression, number of symptoms, diagnosis, as well as additional clinical and demographic factors, yielded a multiple regression model with performance status (ECOG-PS) and depression (HADS) as significant factors (see table 6). The model explains 60% of the variance in fatigue.
| Table 1:Demographic and clinical characteristics of participants. | |||||
| Patient characteristics | No. | % | Mean | SD | Range |
| Total number of patients | 77 | ||||
| Age, years | 58.1 | 14.5 | 19-87 | ||
| Gender, female | 40 | 51.9 | |||
| Primary tumors Colorectal Breast Lymphoma Lung | 23 19 18 17 | 29.9 24.7 23.4 22.0 | |||
| Chemotherapy Alone Combined with biotherapy Combined with radiotherapy | 49 26 2 | 63.6 33.8 2.6 | |||
| Goal of therapy Palliative Adjuvant Curative Neo-adjuvant | 38 20 14 5 | 49.3 26.0 18.2 6.5 | |||
| Number of comorbidities* | 77 | 1.56 | 1.3 | 0-6 | |
| Body mass index° | 61 | 24.8 | 5.6 | 17.1–49.7 | |
| Note. *Comorbidities according to ICD 10. ° Body mass index = weight in kg / height in m². | |||||
| Table 2: Scores of depression, anxiety, other anemia-related symptoms, ECOG-PS, anemia and anemia treatments. | |||
| T1 (N = 77) Mean ± SD (range) | T2 (n = 58) Mean ± SD (range) | T3 (n = 50) Mean ± SD (range) | |
| Depression scores | 5.0 ± 4.0 (0-13) | 5.7 ± 3.6 (0-15) | 5.5 ± 3.7 (0-18) |
| Anxiety scores | 5.6 ± 3.8 (0-18) | 5.0 ± 3.6 (0-14) | 4.6 ± 3.4 (0-13) |
| Anemia Additional Concerns score | 20.6 ± 4.7 (10-28) | 19.4 ± 4.2 (9-28) | 20.0 ± 4.2 (11-27) |
| ECOG-PS score Median | 1.20 ± .88 1 | 1.38 ± .82 1 | 1.34 ± .87 1 |
| Anemia* Mild (Hb 11.9–10 g/dl) Moderate (Hb 9.9–8.0 g/dl) None (Hb ≥12 g/dl) | n = 67 (%) 14 (21) 2 (3) 51 (76) | n = 49 (%) 17 (35) 2 (4) 30 (61) | n = 37 (%) 16 (43) 2 (6) 19 (51) |
| Anemia treatments Iron Red blood cell transfusions Erythropoietin None | T1 to T2, n = 75 (%) 4 (5) 3 (4) 2 (3) 66 (88) | T2 to T3, n = 46 (%) 4 (9) 2 (4) 2 (4) 38 (83) | |
| *Anemia grading according to Berger [63] | |||
| Table 3: Symptom prevalence in descending order at T2, with number and percentages of patients experiencing a symptom and symptom scores. | |||
| Symptom | No. of patients with symp. N = 58 | % of patients with symp. | Symptom score(0-4) mean (SD) |
| Lack of energy | 49 | 84.5% | 2.16 (.81) |
| Feeling drowsy | 47 | 81.0% | 2.09 (.63) |
| Difficulty sleeping | 41 | 70.7% | 2.26 (.80) |
| Worrying | 40 | 69.0% | 2.03 (.78) |
| Dry mouth | 36 | 62.1% | 2.14 (.82) |
| Difficulty concentrating | 35 | 60.3% | 1.48 (.65) |
| Pain | 33 | 60.0% | 2.08 (.83) |
| Hair loss | 33 | 57.9% | 2.68 (.97) |
| Change in the way food tastes | 32 | 56.1% | 2.17 (.94) |
| Feeling sad | 31 | 53.5% | 1.84 (.64) |
| Numbness/tingling in hands/feet | 28 | 48.3% | 2.13 (.97) |
| Sweats | 28 | 48.3% | 1.76 (.79) |
| “I don’t look like myself” | 27 | 46.6% | 1.91 (.93) |
| Weight loss | 26 | 45.6% | 1.58 (.97) |
| Dizziness | 26 | 45.6% | 1.71 (.84) |
| Feeling nervous | 26 | 45.6% | 1.69 (.67) |
| Constipation | 26 | 44.8% | 1.90 (.95) |
| Feeling irritable | 25 | 43.9% | 1.60 (.59) |
| Nausea | 25 | 43.1% | 1.86 (.85) |
| Lack of appetite | 24 | 42.1% | 2.00 (1.03) |
| Mouth sores | 23 | 40.4% | 2.00 (1.04) |
| Shortness of breath | 22 | 38.6% | 2.29 (.85) |
| Diarrhea | 22 | 37.9% | 2.18 (.82) |
| Changes in skin | 20 | 34.5% | 2.13 (.84) |
| Difficulty swallowing | 19 | 33.9% | 1.98 (.68) |
| Cough | 19 | 33.3% | 1.75 (.83) |
| Feeling bloated | 19 | 32.8% | 1.82 (1.04) |
| Itching | 17 | 29.3% | 1.65 (.89) |
| Vomiting | 13 | 22.8% | 1.36 (.74) |
| Swelling of arms or legs | 12 | 21.1% | 1.58 (.70) |
| Problems with urination | 11 | 19.0% | 1.30 (.41) |
| Table 4: Results of the random-intercept regression model with number of symptoms as outcome variable. | |||||
| Estimate | Standard error | Degrees of freedom | T-value | P-value | |
| Intercept | 5.6167 | 0.8247 | 76 | 6.81 | <.0001 |
| Time (in days) | 0.3652 | 0.08897 | 105 | 4.11 | <.0001 |
| Depression (HADS score) | 0.8251 | 0.1257 | 105 | 6.57 | <.0001 |
| Table 5: Results of the random-intercept regression model with fatigue as outcome variable. | |||||
| Estimate | Standard error | Degrees of freedom | T-value | P-value | |
| Intercept | 47.455 | 1.1357 | 76 | 41.78 | <.0001 |
| Time (in days) | –0.0754 | 0.0207 | 104 | –3.64 | 0.0004 |
| Depression (HADS score) | –2.3017 | 0.1983 | 104 | –11.61 | <.0001 |
| Table 6: Multiple regression model at T2 with fatigue as outcome variable. | |||||
| Estimate | 95% Confidence Intervals | Chi² | P-value | ||
| Intercept | 46.0407 | 42.0689 | 50.0125 | 516.19 | <.0001 |
| Performance status (ECOG-PS) | –3.9005 | –6.7785 | –1.0225 | 7.06 | 0.0008 |
| Depression (HADS score) | –1.8497 | –2.4818 | –1.2175 | 32.89 | <.0001 |
According to our systematic literature review, this is the first prospective study exploring comprehensively symptom prevalence, and in particular fatigue, in Swiss outpatients with lymphoma, breast, lung, or colorectal cancer receiving chemotherapy.
Patients in this study already experienced a considerable number of symptoms (mean 9.8 ± 6.5, range 1–28) at the start of chemotherapy, likely related to the disease itself. Similarly, Breen et al. [5] and Gwede et al. [8] reported high symptom prevalence prior to chemotherapy. As it has to be expected in patients receiving side-effects causing chemotherapy, the number of symptoms increased significantly over time (mean 14.4 ± 6.6, range 0–31 at T2; mean 13.7 ± 6.2, range 0–27 at T3). With on average 14 symptoms over three weeks in patients receiving the second or third cycle of chemotherapy, Chou et al. [7] reported a similar number of symptoms. Additional comparisons do not seem adequate due to differences in study designs, samples and measurement instruments.
While worrying, feeling drowsy, lack of energy, feeling sad, difficulty sleeping, and pain (likely disease related, since almost 50% of the patients received palliative treatment) were most prevalent before the start of chemotherapy in this study, the most prevalent symptoms at T2 and T3 included lack of energy, feeling drowsy, worrying, difficulty sleeping, dry mouth, and pain. Lack of energy, oral problems, sleeping problems, and pain were also among the most prevalent symptoms in other studies [4–8]. Lack of energy or fatigue ranked highest regarding prevalence throughout and pain was highly prevalent in most other studies that included outpatients and/or patients receiving chemotherapy, while the prevalence of other symptoms differed [3, 18, 20, 21, 37–45].
Symptom scores for several symptoms were >2 at each measurement point, and for some symptoms, the score remained >2 over two or even all three measurements, indicating a considerable symptom burden for patients. The most burdensome symptoms changed over time; at T1, symptoms that may be related to the disease seem more pronounced, while symptoms with the highest scores seem primarily related to the cell toxicity of chemotherapeutic agents at T3. Few significant changes in the scores of single symptoms were found. This may be partly attributed to the small number of patients experiencing a symptom; it may also show options for improving symptom control.
The regression model showed that patients with a higher depression score reported more symptoms. While Breen et al. [5] showed physical symptoms as predictors of depression, and Yamagishi et al. [6] found a relationship between changes in physical symptoms and change in the Distress Thermometer, a screening measure for major depression and adjustment disorder. The association of symptoms and depression was rarely explored in other prevalence studies. In addition, several symptoms that are common in patients with advanced cancer are also known as symptoms of depression, and furthermore, pain and fatigue may be predictors of depression [12, 46].
Remarkably, symptom experience varied widely over time in individual patients and also among patients, as clearly illustrated in figure 2. While this aspect has rarely been demonstrated before, it strongly supports the need for individual symptom management.
In our study, fatigue was common, starting already with more fatigue before start of chemotherapy than the average score of 43 of the general United States population [47]. This average fatigue level at T1 may have been related to the disease itself or to surgery, since the majority of patients were receiving adjuvant or palliative chemotherapy. In 85 patients with breast cancer, Ancoli-Israel et al. [48] also found some fatigue prior to the start of neoadjuvant or adjuvant chemotherapy.
Fatigue scores in our study decreased significantly from baseline to one week prior to the third cycle of chemotherapy, meaning that patients experienced more fatigue at T2 and T3. Cella et al. [49] determined a change of three points as minimal clinically important difference on the FACIT-Fatigue score, using objective measures as anchors (Hb level, functional status, response to treatment). Reddy et al. [50] used the subjective perspective of 194 patients with advanced cancer to determine an increase of 10 points in the FACIT-Fatigue score as clinically important improvement. The mean fatigue score decrease of 6.1 points from T1 to T2 in our study may, thus, be considered as barely reaching clinical relevance. In several cross-sectional studies, using diverse samples of patients treated with chemotherapy for various length of time, fatigue was also common and frequently the most prevalent symptom [51–55]. Equally in accordance with our findings, most previous studies showed an increase of fatigue over several cycles of chemotherapy [51, 55, 56]. As an exception, Berger [57] did not find an increase in fatigue over three cycles of chemotherapy in 72 women with breast cancer after surgery.
Again, as illustrated in figure 3, fatigue scores in our study varied widely among patients and over time for individual patients. Mean values may blur the diverse trajectories of individual patients; this aspect has rarely been reported before and poses challenges for individual symptom management.
Regarding correlates of fatigue, a variety of factors have been explored with mixed results in previous research. In our study, higher depression scores and lower performance status were associated with more fatigue; the variables explained 60% of the changes in fatigue at T2. In several other studies, fatigue was also associated with depression [51, 52, 54] and performance status [51, 58]. Can et al. [59] and Hartvig et al. [52] found specific symptoms to be associated with fatigue. Number of symptoms was used instead of single symptoms in our study in order to avoid too many variables in the model given the limited sample size. The variable (number of symptoms) did not contribute significantly. The Hb level was also not correlated significantly to fatigue in our study; other authors reported mixed results. In the studies included in the review of Servaes et al. [51], no associations were found, while Hb levels were significantly correlated with fatigue in some other studies [54, 60, 61].
Some limitations of this study should be noted. The envisioned number of 100 participants was not achieved because the number of admissions unexpectedly dropped during data collection. With few patients refusing participation, however, the attrition rate of 35% was higher. This may not be uncommon in a sample including almost 50% of patients with palliative treatment. Though the lower number of participants did not jeopardise the longitudinal overall analyses, small numbers of participants experiencing specific symptoms limited trend explorations of single symptoms.
This study provides for the first time prevalence data based on a comprehensive symptom assessment with an additional focus on fatigue at start and prior to the third and fourth cycle of chemotherapy in outpatients with lymphoma, breast, lung, and colorectal cancer in Switzerland. Such prevalence data are relevant for clinical practice as foundation for improving assessment and management of symptoms, staff education and services [62]. Findings allow the identification of areas in symptom management with the potential of improvement. Pain, for instance, is a treatable symptom; the symptom was nevertheless present in over half of the patients with a score of >2 at all measurement points. High symptom prevalence already at start of chemotherapy and later in the follow up plus the great variability in symptom experience call for systematic symptom assessment with individual management that does not focus solely on side-effects of therapy but includes disease-related symptoms and depression to achieve satisfactory control of symptoms in this population.
Acknowledgements: We thank all patients, research assistants, nurses and physicians, the medical and nursing leaders of the participating hospital department, the consultants S. De Geest, PhD, RN, FAAN, R. Herrmann, MD, Ch. Schindler, PhD, and S. M. Paul, PhD, for their contributions.
1 Patrick DL, Ferketich SL, Frame PS, Harris JJ, Hendricks CB, Levin B, et al. National Institutes of Health state-of-the-science conference statement: Symptom management in cancer: Pain, depression, and fatigue, July 15–17, 2002. J Natl Cancer Inst. 2003;95(15):1110–17.
2 Miaskowski C, Aouizerat BE, Dodd M, Cooper B. Conceptual issues on symptom clusters research and their implications for quality-of-life assessments in patients with cancer. J Natl Cancer Inst Monogr. 2007;37:39–46.
3 Hoffman AJ, Given BA, von Eye A, Gift AG, Given CW. Relationships among pain, fatigue, insomnia, and gender in persons with lung cancer. Oncol Nurs Forum. 2007;34:785–92.
4 Akin S, Can G, Aydiner A, Ozdilli K, Durna Z. Quality of life, symptom experience and distress of lung cancer patients undergoing chemotherapy. Eur J Oncol Nurs. 2010;14:400–9.
5 Breen SJ, Baravelli CM, Schofield PE, Jefford M, Yates PM, Aranda SK. Is symptom burden a predictor of anxiety and depression in patients with cancer about to commence chemotherapy? Med J Aust. 2009;7:S99–S104.
6 Yamagishi Y, Morita T, Miyashita M, Kimura R. Symptom prevalence and longitudinal follow-up in cancer outpatients receiving chemotherapy. J Pain Symptom Manage. 2009;37:823–30.
7 Chou F, Dodd M, Abrams D, Padilla G. Symptoms, self care, and quality of life of Chinese American patients with cancer. Oncol Nurs Forum. 2007;34:1162–7.
8 Gwede CK, Small BJ, Munster PN, Andrykowski MA, Jacobsen PB. Exploring the differential experience of breat cancer treatment-related symptoms: A cluster analytic approach. Support Care Cancer. 2008;16:925–33.
9 Mercadante S, Casuccio A, Fulfaro F. The course of symptom frequency and intensity in advanced cancer patients followed at home. J Pain Symptom Manage. 2000;20:104–12.
10 Berger AM, Abernethy AP, Atkinson A, Barsewick AM, Breitbart WS, Cella D, et al. Cancer-related fatigue: Practice guidelines in oncology [Internet]. National Comprehensive Cancer Network; 2009 [cited 2009 Jun 6]. Available at: http://www.nccn.org/professionals/physician_gls/PDF/fatigue.pdf.
11 Vainio A, Auvinen A, Ahmedzai S, Benton TF, Walsh D, Higginson I, et al. Prevalence of symptoms among patients with advanced cancer: An international collaborative study. J Pain Symptom Manage. 1996;12(1):3–10.
12 Reuter K. Fatigue und/oder Depression? Ein Beitrag zur Konstruktvalidierung und diagnostischen Unterscheidung bei Patienten mit Tumorerkrankungen. Freiburg i. Br.: Albert-Ludwigs-Universität; 2002.
13 Ludwig H, Van Belle S, Barrett-Lee P, Birgegard G, Bokemeyer C, Gascon P, et al. The European cancer anaemia survey (ECAS): A large, multinational, prospective survey defining the prevalence, incidence, and treatment of anaemia in cancer patients. Eur J Cancer. 2004;40:2293–306.
14 National Cancer Institute. Oral complications of chemotherapy and head/neck radiation [Internet]. National Cancer Institute; 2009 [cited 2009 Jul 31]. Available at: http://www.cancer.gov/cancertopics/pdq/supportivecare/oralcomplications/HealthProfessional.
15 U. S. Department of Health and Human Services, National Institute of Health, National Cancer Institute. Common terminology criteria for adverse events (CTCAE) version 4.0 [Internet]. 2009 [cited 2009 Jul31]. Available at: http://ctep.cancer.gov/protocolDevelopment/electronic_application/docs/ctcae4.pdf.
16 Cleeland CS. Cancer-related symptoms. Semin Radiat Oncol. 2000;10:175–90.
17 Henry DH, Viswanathan HN, Elkin EP, Traina S, Wade S, Cella D. Symptoms and treatment burden associated with cancer treatment: Results from a cross-sectional national survey in the U. S. Support Care Cancer. 2008;16:791–801.
18 Chang VT, Hwang SS, Feuerman M, Kasimis BS. Symptom and quality of life survey of medical oncology patients at a veterans affairs medical center: A role for symptom assessment. Cancer. 2000;88:1175–83.
19 Lo RSK, Ding A, Chung TK, Woo J. Prospective study of symptom control in 133 cases of palliative care inpatients in Shatin hospital. Palliat Med. 1999;13:335–40.
20 Potter J, Hami F, Bryan T, Quigley C. Symptoms in 400 patients referred to palliative care services: Prevalence and patterns. Palliat Med. 2003;17:310–4.
21 Portenoy RK, Thaler HT, Kornblith AB, Lepore JM, Friedlander-Klar H, Coyle N, et al. Symptom prevalence, characteristics and distress in a cancer population. Qual Life Res. 1994;3:183–9.
22 Portenoy RK, Thaler HT, Kornblith AB, Lepore JM, Friedlander-Klar H, Kiyasu E, et al. The Memorial Symptom Assessment Scale: An instrument for the evaluation of symptom prevalence, characteristics and distress. Eur J Cancer. 1994;30A:1326–36.
23 Cella D. The Functional Assessment of Cancer Therapy-Anemia (FACT-AN) Scale: A new tool for the assessment of outcomes in cancer anemia and fatigue. Semin Hematol. 1997;34(3 Suppl 2):13–9.
24 Cella D, Eton DT, Fairclough DL, Bonomi P, Heyes AE, Silberman C, et al. What is a clinically meaningful change on the Functional Assessment of Cancer Therapy-Lung (FACT-L) questionnaire? Results from Eastern Cooperative Oncology Group (ECOG) study 5592. J Clin Epidemiol. 2002;55:285–95.
25 Yellen SB, Cella DF, Webster K, Blendowski C, Kaplan E. Measuring fatigue and other anemia-related symptoms with the Functional Assessment of Cancer Therapy (FACT) measurement system. J Pain Symptom Manage. 1997;13:63–74.
26 Bonomi AE, Cella DF, Hahn EA, Bjordal K, Sperner-Unterweger B, Gangeri L, et al. Multilingual translation of the Functional Assessment of Cancer Therapy (FACT) quality of life measurement system. Qual Life Res. 1996;5:309–20.
27 Herrmann C, Buss U, Snaith RP. HADS-D Hospital Anxiety and Depression Scale - deutsche Version. Ein Fragebogen zur Erfassung von Angst und Depression in der somatischen Medizin. Testdokumentation und Handanweisung. Bern, Huber, 1995.
28 Zigmond AS, Snaith RP. The Hospital Anxiety and Depression Scale. Acta Scand. 1983;67:361–70.
29 Reuter K, Härter M. Screening for mental disorders in cancer patients - discriminant validity of HADS and GHQ-12 assessed by standardized clinical interviews. Int J Methods Psychiatr Res. 2001;10:86–96.
30 Eastern Cooperative Oncology Group: ECOG performance status [Internet]. 2000 [cited 2005 Jan 10]. Available at: http://www.ecog.org/general/perf_stat.html.
31 Oken MM, Creech RH, Tormey DC, Horton J, Davis TE, McFadden ET, et al. Toxicity and response criteria of the Eastern Cooperative Oncology Group. Am J Clin Oncol. 1982;5:649–55.
32 Hann DM, Jacobsen PB, Martin SC, Kronish LE, Azzarello LM, Fields KK. Quality of life following bone marrow transplantation for breast cancer: A comparative study. Bone Marrow Transplantation. 1997;19:257–64.
33 Bladgen SP, Charman SC, Sharples LD, Magee LRA, Gilligan D. Performance status score: Do patients and their oncologists agree? Br J Cancer. 2003;89:1022–7.
34 Corless IB, Nicholas PK, Nokes KM. Issues in cross-cultural quality-of-life research. J Nurs Sch. 2001;33:15–20.
35 Flaherty JA. Developing instruments for cross-cultural psychiatric research. J Nerv Ment Dis. 1988;176:257–63.
36 Jones PS, Lee JW, Phillips LR, Zhang XE, Jaceldo KB. An adaptation of Brislin’s translation model for cross-cultural research. Nurs Res. 2001;50:300–4.
37 Conill C, Verger E, Henriquez I, Saiz N, Espier M, Lugo F, et al. Symptom prevalence in the last week of life. J Pain Symptom Manage. 1997;14:328–31.
38 Cooley ME, Short TH, Moriarty HJ. Symptom prevalence, distress, and change over time in adults receiving treatment for lung cancer. Psychooncology. 2003;12:694–708.
39 Donnelly S, Walsh D. The symptoms of advanced cancer. Semin Oncol. 1995;22(2 Suppl 3):67–72.
40 Feyer P, Kleeberg UR, Steingraber M, Gunther W, Behrens M. Frequency of side effects in outpatient cancer care and their influence on patient satisfaction – a prospective survey using the PASQOC questionnaire. Support Care Cancer. 2008;16:567–75.
41 Gift AG, Jablonski A, Stommel M, Given CW. Symptom clusters in elderly patients with lung cancer. Oncol Nurs Forum. 2004;31:203–12.
42 Meuser T, Pietruck C, Radbruch L, Stute P, Lehmann KA, Grond S. Symptoms during cancer pain treatment following WHO-guidelines: A longitudinal follow-up study of symptom prevalence, severity and etiology. Pain. 2001;93:247–57.
43 Schuit KW, Sleijfer DT, Meijler WJ, Otter R, Schakenraad J, van den Bergh FC, et al. Symptoms and functional status of patients with disseminated cancer visiting outpatient departments. J Pain Symptom Manage. 1998;16:290–7.
44 Tranmer JE, Heyland D, Dudgeon D, Groll D, Squires-Graham M, Coulson K. Measuring the symptom experience of seriously ill cancer and noncancer hospitalized patients near the end of life with the Memorial Symptom Assessment Scale. J Pain Symptom Manage. 2003;25:420–9.
45 Yan H, Sellick K. Symptoms, psychological distress, social support, and quality of life of Chinese patients newly diagnosed with gastrointestinal cancer. Cancer Nurs. 2004;27:389–99.
46 Breitbart W, Chochinov HM, Passik S. Psychiatric aspects of palliative care. In Doyle D, Hanks GWC, MacDonald N, editors. Oxford textbook of palliative medicine. Oxford: Oxford University Press; 1998. p 933–54.
47 Cella D, Lai JS, Chang CH, Peterman AH, Slavin M. Fatigue in cancer patients compared with fatigue in the general United States population. Cancer. 2002;94:528–38.
48 Ancoli-Israel S, Liu L, Marler MR, Parker BA, Jones V, Sadler GR, et al. Fatigue, sleep, and circadian rhythms prior to chemotherapy for breast cancer. Support Care Cancer. 2006;14:201–9.
49 Cella D, Eton DT, Lai JS, Peterman AH, Merkel DE. Combining anchor and distribution based methods to derive minimal clinically important differences on the Functional Assessment of Cancer Therapy (FACT) anemia and fatigue scales. J Pain Symptom Manage. 2002;24:547–61.
50 Reddy S, Bruera E, Pace E, Zhang K, Reyes-Gibby CC. Clinically important improvement in the intensity of fatigue in patients with advanced cancer. J Palliat Med. 2007;10:1068–75.
51 Servaes P, Verhagen C, Bleijenberg G. Review: Fatigue in cancer patients during and after treatment: Prevalence, correlates and interventions. Eur J Cancer. 2002;38:27–43.
52 Hartvig P, Aulin J, Hugerth M, Wallenberg S, Wagenius G. Fatigue in cancer patients treated with cytotoxic drugs. J Oncol Pharm Practice. 2006;12:155–64.
53 Karakoc T, Yurtsever S. Relationship between social support and fatigue in geriatric patients receiving outpatient chemotherapy. Eur J Oncol Nurs. 2010;14:61–7.
54 Respini D, Jacobsen PB, Thors C, Tralongo P, Balducci L. The prevalence and correlates of fatigue in older cancer patients. Crit Rev Oncol Hematol. 2003;47:273–9.
55 Lee YH, Tsai YF, Lai YH, Tsai CM. Fatigue experience and coping strategies in Taiwanese lung cancer patients receiving chemotherapy. J Clin Nurs. 2008;17:876–83.
56 Donovan KA, Jacobsen PB, Andrykowski MA, Winters EM, Balducci L, Malik U, et al. Course of fatigue in women receiving chemotherapy and/or radiotherapy for early stage breast cancer. J Pain Symptom Manage. 2004;28:373–80.
57 Berger AM. Patterns of fatigue and activity and rest during adjuvant breast cancer chemotherapy. Oncol Nurs Forum. 1998;25:51–62.
58 Siefert ML. Fatigue, pain, and functional status during outpatient chemotherapy. Oncol Nurs Forum. 2010;37:E114–23.
59 Can G, Durna Z, Aydiner A. Assessment of fatigue in and care needs of Turkish women with breast cancer. Cancer Nurs. 2004;27:153–61.
60 Cella D, Kallich J, McDermott A. The longitudinal relationship of hemoglobin, fatigue and quality of life in anemic cancer patients: Results from five randomized clinical trials. Ann Oncol. 2004;15:979–86.
61 Jacobsen PB, Garland LL, Booth-Jones M, Donovan KA, Thors CL, Winters E, et al. Relationship of hemoglobin levels to fatigue and cognitive functioning among cancer patients receiving chemotherapy. J Pain Symptom Manage. 2004;28:7–18.
62 Teunissen SC, Wesker W, Kruitwagen C, de Haes HC, Voest EE, de Graeff A. Symptom prevalence in patients with incurable cancer: A systematic review. J Pain Symptom Manage. 2007;34:94–104.
63 Berger A. Treating fatigue in cancer patients. Oncologist. 2003;8(Suppl 1):10–4.
Funding / potential competing interests: The study was supported by Grant No. OCS-01725-08-2005 from the Swiss Cancer League/Oncosuisse, and by unrestricted grants from Roche Pharma (Schweiz) AG, Mundipharma Medical Company, and the Gedächtnis-Stiftung Susy Rückert zur Krebsbekämpfung (Foundation in memory of Susy Rückert against cancer). None of the authors had a conflict of interest.