Intensity of cytosol expression of 8-OHdG in normal renal tubules is associated with the severity of renal fibrosis
DOI: https://doi.org/10.4414/smw.2011.13268
JP
Tsai, JH
Liou, KT
Yeh, HC
Tai, YW
Cheng, HR
Chang
Summary
INTRODUCTION:It has been proposed thatreactive oxygen species play a role in renal fibrosis. 8-OHdG, a metabolite of oxidative damage to leukocyte DNA, has been identified as a marker of oxidative stress in patients with chronic renal failure.
MATERIALS AND METHODS:Seventy-four patients following nephrectomy were retrospectively enrolled. Immunohistochemical analysis of the renal expression of 8-OHdG in the nephrectomised kidneys was performed and associations between renal expression of 8-OHdG and renal fibrosis were evaluated.
RESULTS:Patients with higher interstitial fibrosis scores (IFS) and glomerular fibrosis scores (GFS) had significantly higher serum creatinine, lower estimated glomerular filtration rate (eGFR), increased percentage of chronic kidney disease (CKD) and urothelial cell carcinoma. The renal tissues with higher IFS had lower expressions of 8-OHdG in normal tubular cytoplasm (NTc) (35.7% vs. 64.3%, p = 0.011) and normal tubular nuclei (NTn) (28.6% vs. 71.4%, p = 0.023). Univariate analysis showed that IFS and GFS correlated with the NTc 8-OHdG expression and IFS negatively correlated with NTn 8-OHdG expression. Multivariate stepwise regression revealed that serum creatinine (r = 0.351 for IFS, p = 0.021; r = 0.563 for GFS, p <0.001) and intensity of 8-OHdG expression in NTc (r = 0.397 for IFS, p = 0.01; r = 0.278 for GFS, p = 0.043) were the independent factors predicting IFS or GFS.
CONCLUSION:This study demonstrated that the intensity of 8-OHdG expression in NTc was associated with the severity of renal fibrosis.
Abbreviations
Agn atrophic glomerular nuclei
Atc atrophic tubular cytoplasm
ATn atrophic tubular nuclei
CKD chronic kidney disease
ECM extracellular matrix
eGFR estimated glomerular filtration rate
8-OhdG 8-hydroxy-2’ deoxyguanosine
GFS glomerular fibrotic score
IFS interstitial fibrotic score
IHC immunohistochemical stain
NGn normal glomerular nuclei
NTc normal tubular cytoplasm
NTn normal tubular nucleus
RCC renal cell carcinoma
ROS reactive oxygen species
Tn tumour nuclei
Tsc tumour stromal cytoplasm
UCC urothelial cell carcinoma
Introduction
Reactive oxygen species (ROS), composed of superoxide radicals, hydrogen peroxide and hydroxyl radicals, are involved not only in the aging process but are also either directly or indirectly implicated in a wide variety of clinical disorders, such as atherosclerosis, reperfusion injury, pulmonary toxicity, macular degeneration, cataractogenesis, diabetes, cancers and renal fibrosis [1–2]. Although it is difficult to directly measure these free radicals because of a very short half life, products of radical damage to DNA, lipids, proteins and protective species are good markers of oxidative stress [3]. Recent studies have focused on measuring 8-OHdG, which is a major DNA oxidation product, and its free base 8-hydroxyguanine (8-OH-G) in blood cells or urine as an important biomarker of oxidative DNA damage induced by ROS [4–5].
8-OHdG, a metabolite of oxidative damage to leukocyte DNA, has been identified as a marker of oxidative stress in chronic renal patients on renal replacement therapy [5] and hypertensive patients with proteinuria [6]. Scarring of the kidney, which is caused by a progressive fibrosis leading to impairment of kidney function, occurs due to a variety of primary insults, such as diabetes mellitus, hypertension, primary glomerulopathies, autoimmune diseases, toxic injury or congenital abnormalities [7]. High glucose, advanced glycation end products, angiotensin II and TGF-β1 are considered to increase intracellular ROS in renal cells and contribute to the development and progression of diabetic renal injury [2, 8]. The role of ROS in increased extracellular matrix (ECM) synthesis, which plays a critical role in glomerular mesangial expansion and tubulointerstitial fibrosis, has previously been reviewed [2, 9]. As ROS strongly correlate with ECM and tubulointerstitial fibrosis, we intended to study the relationship between renal expression of the ROS marker, 8-OHdG and renal fibrosis. Moreover, as we needed human renal tissues with various degrees of fibrosis, we performed this study using remnant tissues from nephrectomised kidneys instead of renal tissues from biopsies.
Materials and methods
From January 2006 to January 2009, pathological specimens from 74 patients who had undergone unilateral or bilateral nephrectomy were retrospectively recruited. The mean age of the patients at surgery was 60.6 ± 13.5 years. The indications for nephrectomy were urothelial cell carcinoma (UCC) (n = 29; 39.2%), renal cell carcinoma (RCC) (n = 26; 35.1%), renal abscess or emphysematous pyelonephritis (n = 10; 13.5%), renal stones with or without hydronephrosis (n = 4; 5.4%) and others (including angiomyolipoma, renal cyst and primitive neuroectodermal tumour) (n = 5; 6.8%). Estimated glomerular filtration rate (eGFR) was calculated using the abbreviated Modification of Diet in Renal Disease formula (aMDRD) as follows: 186 × (sCr)-1.145× (age)-0.203× (0.742 if female), and the mean eGFR was 49.4 ± 31.1 ml/min. Chronic kidney disease (CKD) was defined according to the K/DOQI guidelines [10] and 47 patients (65.3%) were diagnosed with CKD. Among the patients with CKD, 12 patients had received renal replacement therapy (RRT) and the mean duration of RRT before operation was 6.6 years (range 3 to 10 years). This study was approved by the institutional review board at Chung Shan Medical University Hospital.
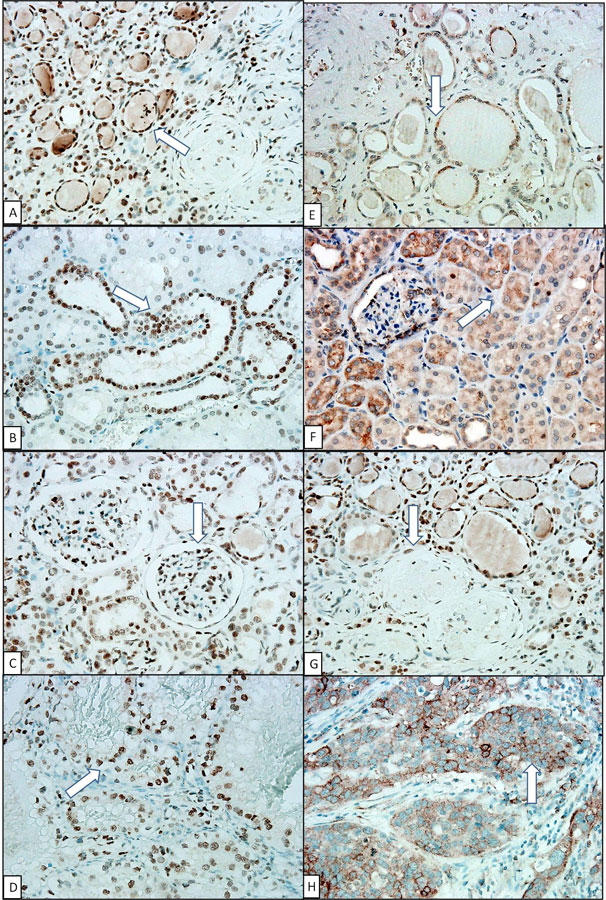
Figure 1
High expression of 8-OHdG in (A) atrophic tubular nucleus; (B) normal tubular nucleus; (C) normal glomerular nucleus; low expression of 8-OHdG in (E) atrophic tubular cytoplasm; (F) normal tubular cytoplasm; (G) sclerotic glomerular nucleus (negative control); and 8-OHdG expression in RCC nucleus (D) and UCC cytoplasm (H) (positive control). (Arrow indicated the area of 8-OHdG expression) (IHC stain, 400x).
Recipient age, gender, body mass index, systolic and diastolic blood pressure, laboratory and clinical data at operation including fasting glucose, cholesterol, triglycerides, haemoglobin and albumin were recorded.
Tissue processing
Pathological material was processed for conventional histological procedures. Representative sections were taken in the renal parenchyma at least 2 cm away from the tumour areas (in cases of nephrectomy due to tumour). Each section’s dimension was at least 2 x 2 cm2. The formalin-fixed, paraffin-embedded tissues were cut into 4-mm haematoxylin- and eosin-stained sections and reviewed to evaluate the glomerular, renal tubular and interstitial conditions. The scoring of fibrosis was based on Banff scoring for chronic lesions [11]. To analyse the degree of fibrosis in the interstitium and glomeruli, we defined the low fibrosis group as a score of 0 or 1 and the high fibrosis group as a score of 2 or 3.
Immunohistochemical stain
Paraffin embedded kidney tissue sections (4-mm) on poly-1-lysine-coated slides were deparaffinised. After treatment with 3% H2O2 in methanol, the sections were hydrated with gradient alcohol and PBS, incubated in 10 mM citrate buffer and finally heated at 100 °C for 20 min in PBS. After incubation with the 8-OHdG antibody [Santa Cruz, California, USA; 8-OHdG (clone 15A3)] for 20 min at room temperature, slides were incubated with a horseradish peroxidase (HRP)/Fab polymer conjugate for another 30 minutes. After being thoroughly washed three times with PBS, the sites of peroxidase activity were visualised using 3, 3-diamino-benzidine tetrahydrochloride as a substrate and haematoxylin as the counter stain. All of the interpretations of the immunohistochemical (IHC) data were scored by two pathologists blindly and independently and based on the method described as follows. Every specimen was sectioned 2 x 2 cm2 and every slide was examined entirely by nuclear and cytoplasmic 8-OHdG stains in the normal and atrophic renal tubules, normal and atrophic glomeruli and tumorous parts. Those renal components available, including renal tubules, glomerulus or tumours were examined and graded. The number of immunoreactive cells was calculated semi-quantitatively and evaluated as the percentage (0 ~ 100%) of positive cells in the observed tubules and glomeruli (normal and atrophic) as follows: intensity 0 = negative; intensity 1+, 1 ~ 10%; 2+, 10 ~ 50%; and 3+, >50% [12]. The results of nuclear or cytoplasm staining were recorded separately. The intensities of 8-OHdG were grouped into high (2 and 3) and low presentation (0 and 1).
Statistical analysis
Data were expressed as means ± standard deviation (SD). Categorical variables were analysed by the chi-square test and proportional comparison test if the renal specimens were not complete. The statistical significance between nonparametric variables was analysed by the Mann-Whitney U test. After evaluation by pathologists, there were 49 out of 74 specimens diagnosed as having different degrees of interstitial or glomerular fibrosis. We then analysed the correlations of clinical variables and 8-OHdG density of each renal component with interstitial and glomerular fibrosis by univariate linear regression analysis. Variables significantly associated with interstitial and glomerular fibrosis were tested for independence by stepwise multivariate linear regression (SMLR) analysis. A p-value of less than 0.05 was considered statistically significant. The data were analysed using MedCalc version 11.2 statistical software.
Results
As not every specimen included all renal components, we examined those that were available including atrophic or normal renal tubules, sclerotic or normal glomerulus and tumorous parts (table 1). Regardless of renal function, there were higher expressions of 8-OHdG in the nuclei compared to the cytoplasm of the atrophic tubules (nuclei vs. cytoplasm: 54.4% vs. 19.1%, p <0.001) and of the normal tubules (nuclei vs. cytoplasm: 53.7% vs. 16.7%, p <0.001). The percentage of expression of 8-OHdG was higher in the nuclei of normal glomeruli than in atrophic glomeruli (26.5% vs. 1.6%, p <0.001) and higher in tumour nuclei than in tumour stromal cytoplasm (46.67% vs. 10%, p = 0.004). Locations of the 8-OHdG expression in each renal and tumorous component were shown in figure 1.
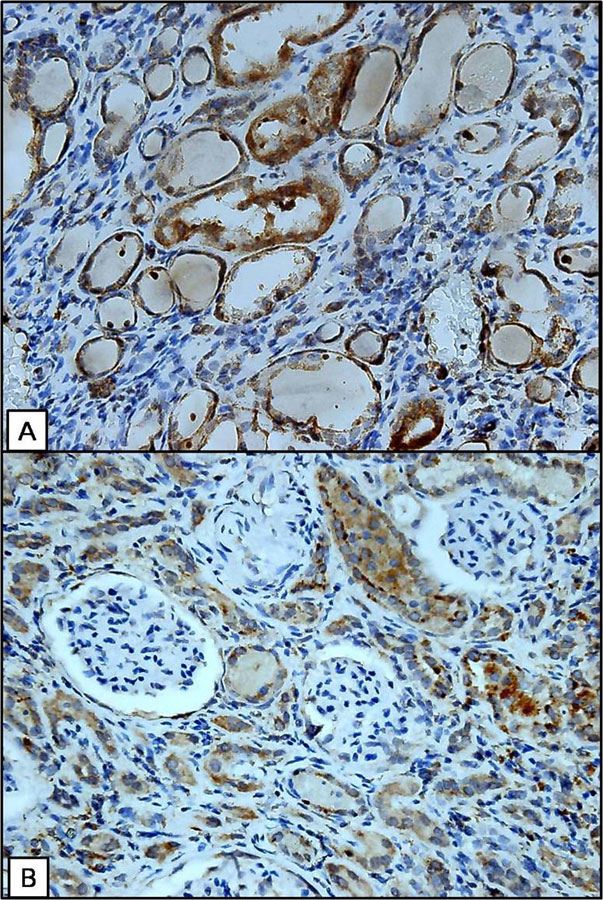
Figure 2
Increased cytoplasmic expression of 8-OHdG in the residual normal tubules in fibrotic renal parenchyma (A) and adjacent to the fibrotic glomeruli (B). (IHC stain, 400x).
After exclusion of those specimens examined by pathologists that did not have interstitial or glomerular fibrosis a total of 49 specimens was further analysed. Among these 49 patients, we compared the association between IFS and GFS with clinical variables. A higher interstitial fibrosis score (IFS) was significantly associated with lower eGFR (high IFS vs. low IFS: 41.1 ± 27.6 ml/min vs. 72.5 ± 23.9 ml/min, p = 0.001), and higher levels of CKD (75% vs. 37.9%, p = 0.024) and UCC (50% vs. 10.3%, p <0.001). Similarly, a higher glomerular fibrosis score (GFS) was significantly associated with lower eGFR (31.9 ± 25.8 ml/min vs. 70.8 ± 23.2, p <0.001) and higher levels of CKD (85.7% vs. 40%, p = 0.005), and UCC (50% vs. 17.1%, p = 0.001) (table 2).
Additionally, we analysed the correlation with IFS and GFS with the 8-OHdG density in each component of the renal specimen when both the compared components existed in the same specimen glass. We found that higher IFS was associated with a lower expression of 8-OHdG in normal tubular cytoplasm (NTc) (35.7% vs. 64.3%, p = 0.011) and in normal tubular nuclei (NTn) (28.6% vs. 71.4%, p = 0.023) (table 3). There was no association between GFS and the expression of 8-OHdG in normal or atrophic tubular nuclei or cytoplasm, normal or atrophic glomerular nuclei, and tumour nuclei or stromal cytoplasm. IFS was positively correlated with GFS (r = 0.762, p <0.001) (data not shown).
Correlations between IFS and GFS with clinical and histological variables are shown in table 4. Univariate analysis demonstrated that IFS correlated with serum creatinine (r= 0.463, p = 0.001), status with CKD (r = 0.365, p = 0.01), glucose (r = 0.325, p = 0.035), 8-OHdG intensity in NTc (r = 0.433; p = 0.004) and inversely correlated with eGFR (r = –0.526, p <0.001) and 8-OHdG intensity in NTn (r = –0.372, p <0.015). The clinical variables that correlated with GFS were similar including serum creatinine (r = 0.596, p <0.001), status with CKD (r = 0.414, p = 0.003), glucose (r = 0.38, p = 0.013) and eGFR (r = -0.599, p <0.001). The only histological variable that correlated with GFS was the 8-OHdG intensity in NTc (r = 0.322, p = 0.038).
Stepwise multivariate linear regression was applied to evaluate the predictors of IFS and GFS, and the variables of serum creatinine, glucose and 8-OHdG intensity in NTc and in NTn were evaluated. The results demonstrated that serum creatinine (r = 0.351, p = 0.021; r = 0.563, p <0.001) and 8-OHdG intensity in NTc (r= 0.397, p = 0.01; r = 0.278, p = 0.043) were independent factors predicting IFS and GFS (table 5). Figure 2 shows the increased cytoplasmic expression of 8-OHdG with regard to the normal tubules in the fibrotic renal parenchyma and adjacent to the fibrotic glomeruli.
|
Table 1: Expression of 8-OHdG in different portions of kidneys. |
|
|
Low 8-OHdG
|
High 8-OHdG
|
p
|
| Atrophic tubules (%) |
|
|
|
| Nucleus |
31/68 (45.59) |
37/68 (54.41) |
<0.001 |
| Cytoplasm |
55/68 (80.88) |
13/68 (19.12) |
|
| Normal tubules (%) |
|
|
|
| Nucleus |
25/54 (46.3) |
29/54 (53.7) |
<0.001 |
| Cytoplasm |
46/55 (83.33) |
9/55 (16.67) |
|
| Glomerular nuclei (%) |
|
|
|
| Atrophic |
62/63 (98.41) |
1/63 (1.59) |
<0.001 |
| Normal |
50/68 (73.53) |
18/68 (26.47) |
|
| Tumor |
|
|
|
| Nucleus |
16/30 (53.33) |
14/30 (46.67) |
0.004 |
| Stromal cytoplasm |
27/30 (90) |
3/30 (10) |
|
| Tubular nuclei (%) |
|
|
|
| Atrophic |
31/68 (45.59) |
37/68 (54.41) |
0.917 |
| Normal |
25/54 (46.3) |
29/54 (53.7) |
|
| Tubular cytoplasm (%) |
|
|
|
| Atrophic |
55/68 (80.88) |
13/68 (19.12) |
0.910 |
| Normal |
46/55 (83.33) |
9/55 (16.67) |
|
| The denominator represents the total number of specimen which contains the observation target components.
Data were analyzed by the chi-square test and proportional comparison test if there were no complete components of renal specimen; p < 0.05 indicates significance. |
|
Table 2: Characteristics of patients divided by low or high renal interstitial or glomerular fibrosis score. |
| |
Fibrosis score (interstitium)
|
Fibrosis score (glomerulus)
|
| |
low |
high |
P value |
low |
high |
P value |
| Patient Number |
29 |
20 |
|
35 |
14 |
|
| Gender (Male, %) |
13 (44.8) |
12 (60) |
0.451 |
17 (48.6) |
8 (57.1) |
0.821 |
| Age (years) |
56.5 ± 14.7 |
61.2 ±11.0 |
0.36 |
57.4 ± 14.5 |
60.8 ± 10.3 |
0.429 |
| eGFR (ml/min) |
72.5 ± 23.9 |
41.1 ± 27.6 |
0.001 |
70.8 ± 23.2 |
31.9 ± 25.8 |
<0.001 |
| CKD (n, %) |
11 (37.9) |
15 (75) |
0.024 |
14 (40) |
12 (85.7) |
0.005 |
| BMI (kg/m2) |
24.4 ± 3.7 |
26.7 ± 5.9 |
0.094 |
24.9 ± 3.9 |
26.6 ± 6.6 |
0.272 |
| Glucose (mg/dl) |
111.4 ± 27.1 |
156.0 ± 94.0 |
0.136 |
114.2 ±33.2 |
170.4 ± 106.7 |
0.013 |
| Hemoglobin (g/dl) |
10.8 ± 3.5 |
9.9 ± 2.8 |
0.23 |
10.8 ± 3.5 |
9.4 ± 2.4 |
0.208 |
| Albumin (mg/dl) |
3.7 ± 0.90 |
4.0 ± 0.38 |
0.963 |
3.8 ± 0.86 |
3.9 ± 0.34 |
0.729 |
| TCH (mg/dl) |
176.6 ± 32.1 |
194.5 ± 47.5 |
0.213 |
181.6 ± 36.4 |
197.0 ±51.7 |
0.384 |
| Triglyceride (mg/dl) |
143.0 ± 75.5 |
161.9 ± 82.5 |
0.529 |
146.8 ±82.9 |
168.1 ± 70.9 |
0.538 |
| Smoker (n, %) |
3 (10.3) |
1 (5) |
0.631 |
4 (11.4) |
0 (0) |
0.307 |
| DM (n, %) |
6 (20.7) |
8 (40) |
0.251 |
8 (22.9) |
6 (42.9) |
0.294 |
| HTN (n, %) |
10 (34.5) |
10 (50) |
0.429 |
12 (34.3) |
8 (57.1) |
0.251 |
| Diagnosis (n, %)
UCC
RCC
Other |
3 (10.3)
21 (72.4)
5 (17.3) |
10 (50)
3 (15)
7 (35) |
<0.001 |
6 (17.1)
23 (55.8)
6 (17.1) |
7 (50)
1 (7.1)
6 (42.9) |
0.001 |
| eGFR, estimated glomerular filtration; CKD, chronic kidney disease; BMI, body mass index; TCH, total cholesterol; DM, diabetes mellitus; HTN, hypertension; UCC, urothelial cell carcinoma; RCC, renal cell carcinoma
p < 0.05 indicates significance |
|
Table 3: Association between fibrosis scores and expression of 8-OHdG in different portions of kidneys. |
| |
Fibrosis score (interstitium)
|
Fibrosis score (glomerulus)
|
| low |
high |
P value |
low |
high |
P value |
| 8-OHdG intensity |
|
|
|
|
|
| NTn (n, %)
Low
High |
9 (32.1)
19 (67.9) |
10 (71.4)
4 (28.6) |
0.023 |
13 (38.2)
21 (61.8) |
6 (75)
2 (25) |
0.112 |
| NTc (n, %)
Low
High |
27 (96.4)
1 (3.6) |
9 (64.3)
5 (35.7) |
0.011 |
31 (91.2)
3 (8.8) |
5 (62.5)
3 (37.5) |
0.072 |
| AGn (n, %)
Low
High |
23 (100)
0 (0) |
19 (95)
1 (5) |
0.465 |
29 (100)
0 (0) |
13 (92.9)
1 (7.1) |
0.326 |
| NGn (n, %)
Low
High |
21 (62.4)
8 (27.6) |
16 (88.9)
2 (11.1) |
0.277 |
27 (77.1)
8 (22.9) |
10 (83.3)
2 (16.7) |
1.0 |
| ATn (n, %)
Low
High |
15 (55.6)
12 (44.4) |
12 (60)
8 (40) |
0.995 |
19 (57.6)
14 (42.4) |
8 (57.1)
6 (42.9) |
0.768 |
| ATc (n, %)
Low
High |
24 (88.9)
3 (11.1) |
14 (70)
6 (30) |
0.211 |
29 (87.9)
4 (12.1) |
9 (64.3)
5 (35.7) |
0.102 |
| Tn (n, %)
Low
High |
5 (38.5)
8 (61.5) |
7 (77.8)
2 (22.2) |
0.099 |
10 (52.6)
9 (47.4) |
2 (66.7)
1 (33.3) |
1.0 |
| Tsc (n, %)
Low
High |
13 (100)
0 (0) |
7 (77.8)
2 (22.2) |
0.156 |
17 (89.5)
2 (10.5) |
3 (100)
0 (0) |
1.0 |
| NTn, normal tubular nucleus; NTc, normal tubular cytoplasm; AGn, atrophic glomerular nuclei; NGn, normal glomerular nuclei; ATn, atrophic tubular nuclei; ATc, atrophic tubular cytoplasm; Tn, tumor nuclei; Tsc, tumor stromal cytoplasm
Data were analyzed by the chi-squared test and p < 0.05 indicates significance |
|
Table 4: Linear regression analyses on the associations between interstitial and glomerular fibrosis with clinicopathologic variables. |
| |
Interstitial fibrosis
|
Glomerular fibrosis
|
| Variable |
Beta |
P value |
Beta |
P value |
| Age (year) |
0.172 |
0.236 |
0.115 |
0.433 |
| Sex (male, %) |
0.149 |
0.306 |
0.077 |
0.597 |
| Creatinine (mg/dl) |
0.463 |
0.001 |
0.596 |
<0.001 |
| Estimated GFR (ml/min) |
-0.526 |
<0.001 |
-0.599 |
<0.001 |
| Chronic kidney disease (n, %) |
0.365 |
0.010 |
0.414 |
0.003 |
| Body mass index (kg/m2) |
0.230 |
0.116 |
0.163 |
0.269 |
| Smoker (n, %) |
-0.102 |
0.491 |
-0.193 |
0.188 |
| Diabetes mellitus (n, %) |
0.201 |
0.170 |
0.193 |
0.188 |
| Glucose (mg/dl) |
0.325 |
0.035 |
0.380 |
0.013 |
| Hemoglobin (g/dl) |
-0.143 |
0.398 |
-0.211 |
0.211 |
| Albumin (mg/dl) |
0.171 |
0385 |
0.025 |
0.901 |
| Total cholesterol (mg/dl) |
0.216 |
0.289 |
0.178 |
0.384 |
| Triglyceride (mg/dl) |
0.122 |
0.560 |
0.130 |
0.537 |
| Hypertension (n, %) |
0.155 |
0.287 |
0.210 |
0.147 |
| Pathologic diagnosis |
-0.151 |
0.301 |
-0.045 |
0.758 |
| 8-OHdG intensity (n, %) |
|
|
|
|
| Atrophic glomerular nucleus |
0.165 |
0.289 |
0.222 |
0.152 |
| Normal glomerular nucleus |
-0.196 |
0.187 |
-0.066 |
0.660 |
| Atrophic tubular nucleus |
-0.044 |
0.767 |
0.004 |
0.979 |
| Atrophic tubular cytoplasm |
0.237 |
0.108 |
0.274 |
0.062 |
| Normal tubular nucleus |
-0.372 |
0.015 |
-0.290 |
0.062 |
| Normal tubular cytoplasm |
0.433 |
0.004 |
0.322 |
0.038 |
| Tumor nucleus |
-0.388 |
0.074 |
-0.097 |
0.668 |
| Tumor stromal cytoplasm |
-0.380 |
0.081 |
-0.126 |
0.577 |
| Interstitial fibrosis scores were significantly correlated with glomerular fibrosis scores (r = 0.762, p < 0.001)
* P< 0.05 was considered statistically significant by univariate linear analysis. |
|
Table 5: Factors predicting interstitial or glomerular fibrosis by multivariate analysis using stepwise linear regression. |
| |
Interstitial fibrosis
|
Glomerular fibrosis
|
| Variable |
Beta |
P value |
Beta |
P value |
| Serum creatinine (mg/dl) |
0.351 |
0.021 |
0.563 |
<0.001 |
| 8-OHdG intensity (n, %)
Normal tubular cytoplasm |
0.397 |
0.010 |
0.278 |
0.043 |
| Variables included serum creatinine, glucose, and 8-OHdG intensity in normal tubular cytoplasm (and normal tubular nuclei in interstitial fibrosis)
*p < 0.05 was considered statistically significant in the stepwise multivariate linear regression analysis. |
Discussion
In this study, the severity of renal fibrosis was demonstrated to be independently associated with the 8-OHdG expression in NTc and serum creatinine.
Scarred kidneys are almost uniformly characterised by the triad of glomerulosclerosis, interstitial fibrosis and tubular atrophy [13]. When renal injury occurs, glomerular or interstitial infiltrated inflammatory cells become activated and produce injurious molecules such as ROS, as well as fibrogenic and inflammatory cytokines [14–15]. Huang et al. reported that the IHC location of 8-OHdG is on the nuclei of renal tubular and cystic epithelial cells in patients with ESRD [16]. In our study, 8-OHdG was expressed predominantly in normal and atrophic renal tubular nuclei compared to tubular cytoplasm and mainly in the renal cellular nuclei of normal glomeruli rather than of atrophic glomeruli.
It has been speculated that high glucose and TGF-β1 increase ECM synthesis and secretion. Additionally, they have been shown to decrease ECM degradation by inhibiting proteolytic systems, such as plasmin and matrix metalloproteases in the glomeruli, through ROS to induce tubulointerstitial fibrosis [2, 15]. Although our patients with higher GFS or IFS tended to have more diabetes (p = 0.322, p = 0.283, respectively) [14, 17], the blood glucose level was associated with glomerular or interstitial fibrosis in the univariate logistic regression analysis but was excluded after multivariate analysis.
An overproduction of ROS and down-regulated expression of cellular antioxidant enzymes may play a pivotal role in the mediation of glomerular, tubular, vascular and interstitial damage. [17] Fujii et al. reported that the myocardial (r = 0.848, p <0.001) and perivascular fibrosis (r = 0.906, p <0.001) scores in rats were significantly associated with the number of 8-OHdG positive cells [18]. Oxidative stress measured by urinary 8-OHdG is believed to be a risk factor for both cardiovascular and renal disease, such as the association of detection of oxidative markers in the urine of diabetic patients and proteinuria [19–20]. In addition, the phenomenon of cytoplasmic 8-OHdG staining in this study was similar to the report from Nomoto et al. that cytoplasmic fine granular 8-OHdG expression of hepatocytes in non-alcoholic fatty liver disease reflects 8-OHdG-positive mitochondrial DNA oxidative stress [21]. Therefore, from the clinicopathological point of view, our results provide evidence that the expression of 8-OHdG in normal tubular cytoplasm could be an alternative pathological marker in mitochondrial damage and correlate with renal fibrosis.
The occurrence of cancer has been reported to be associated with DNA damage. It has also been reported that the presence of nuclear 8-OHdG of hepatocytes is a significant risk factor for hepatocellular carcinoma, especially in patients with hepatitis C virus infection [22]. Significant overexpression of 8-OHdG in DNA was observed from leukocytes in bladder cancer [23] and increased 8-OHdG ratio (8-OHdG level in RCC compared with that in normal tissue) was significantly associated with RCC prognostic indicators [24]. Among our patients, the patients with higher GFS (p = 0.001) and IFS (p <0.001) were associated with a higher percentage of UCC. The average eGFR of the patients with UCC (34.8 ± 22.6 ml/min) was lower than that of the patients with RCC (67.3 ± 29.9 ml/min). This is because UCC is the most common malignancy in dialysis patients in Taiwan and chronic tubulointerstitial nephritis is the most likely underlying renal disease in haemodialysis patients with UCC [25]. One concern is whether UCC or RCC affects the expression of 8-OHdG in adjacent renal tissue. Table 4 demonstrates that the pathological diagnosis of the nephrectomised kidney was not associated with either interstitial or glomerular fibrosis.
The limitations of this study include the retrospective character, small sample size and the fact that some specimens did not include all the components of renal tissues.
In conclusion, our results provide evidence that cytosol expression of 8-OHdG in normal renal tubules is associated with renal glomerular and interstitial fibrosis. Further studies to clarify the molecular basis of this phenomenon are needed.
* contributed equally to the results of this study
References
1 Knight JA. Diseases related to oxygen-derived free radicals. Ann Clin Lab Sci. 1995;25(2):111–21.
2 Ha H, Lee HB. Reactive oxygen species and matrix remodeling in diabetic kidney. J Am Soc Nephrol. 2003;14(8 Suppl 3):S246–249.
3 Okamura DM, Himmelfarb J. Tipping the redox balance of oxidative stress in fibrogenic pathways in chronic kidney disease. Pediatr Nephrol. 2009;24(12):2309–19.
4 Measurement of DNA oxidation in human cells by chromatographic and enzymic methods. Free Radic Biol Med. 2003;34(8):1089–99.
5 Domenici FA, Vannucchi MT, Jordao AA, Jr., Meirelles MS, Vannucchi H. DNA oxidative damage in patients with dialysis treatment. Ren Fail. 2005;27(6):689–94.
6 Dincer Y, Sekercioglu N, Pekpak M, Gunes KN, Akcay T. Assessment of DNA oxidation and antioxidant activity in hypertensive patients with chronic kidney disease. Ren Fail. 2008;30(10):1006–11.
7 Remuzzi G, Bertani T. Pathophysiology of progressive nephropathies. N Engl J Med. 1998;339(20):1448–56.
8 Yamagishi S, Inagaki Y, Okamoto T, Amano S, Koga K, Takeuchi M. Advanced glycation end products inhibit de novo protein synthesis and induce TGF-beta overexpression in proximal tubular cells. Kidney Int. 2003;63(2):464–73.
9 Ha H, Lee HB. Reactive oxygen species as glucose signaling molecules in mesangial cells cultured under high glucose. Kidney Int Suppl. 2000;77:S19–25.
10 K/DOQI clinical practice guidelines for chronic kidney disease: evaluation, classification, and stratification. Am J Kidney Dis. 2002;39(2 Suppl 1):S1–266.
11 Solez K, Colvin RB, Racusen LC, Sis B, Halloran PF, Birk PE, et al. Banff '05 Meeting Report: differential diagnosis of chronic allograft injury and elimination of chronic allograft nephropathy ('CAN'). Am J Transplant. 2007;7(3):518–26.
12 Tsai YY, Cheng YW, Lee H, Tsai FJ, Tseng SH, Lin CL, et al. Oxidative DNA damage in pterygium. Mol Vis. 2005;11:71–5.
13 Brenner BM. Remission of renal disease: recounting the challenge, acquiring the goal. J Clin Invest. 2002;110(12):1753–8.
14 Liu Y. Renal fibrosis: new insights into the pathogenesis and therapeutics. Kidney Int. 2006;69(2):213–7.
15 Eberhardt W, Pfeilschifter J. Nitric oxide and vascular remodeling: spotlight on the kidney. Kidney Int Suppl. 2007(106):S9–S16.
16 Huang XB, Ito F, Nakazawa H, Toma H. Increased expression of 8-hydroxydeoxyguanosine in acquired cystic disease of the kidney. Nephron. 1999;81(4):458–9.
17 Cochrane AL, Ricardo SD. Oxidant stress and regulation of chemokines in the development of renal interstitial fibrosis. Contrib Nephrol. 2003;139:102–19.
18 Fujii H, Nishijima F, Goto S, Sugano M, Yamato H, Kitazawa R, et al. Oral charcoal adsorbent (AST-120) prevents progression of cardiac damage in chronic kidney disease through suppression of oxidative stress. Nephrol Dial Transplant. 2009;24(7):2089–95.
19 Shah SV, Baliga R, Rajapurkar M, Fonseca VA. Oxidants in chronic kidney disease. J Am Soc Nephrol. 2007;18(1):16–28.
20 Jeong KH, Lee TW, Ihm CG, Lee SH, Moon JY, Lim SJ. Effects of sildenafil on oxidative and inflammatory injuries of the kidney in streptozotocin-induced diabetic rats. Am J Nephrol. 2009;29(3):274–82.
21 Nomoto K, Tsuneyama K, Takahashi H, Murai Y, Takano Y. Cytoplasmic fine granular expression of 8-hydroxydeoxyguanosine reflects early mitochondrial oxidative DNA damage in nonalcoholic fatty liver disease. Appl Immunohistochem Mol Morphol. 2008;16(1):71–5.
22 Chuma M, Hige S, Nakanishi M, Ogawa K, Natsuizaka M, Yamamoto Y, et al. 8-Hydroxy-2'-deoxy-guanosine is a risk factor for development of hepatocellular carcinoma in patients with chronic hepatitis C virus infection. J Gastroenterol Hepatol. 2008;23(9):1431–6.
23 Akcay T, Saygili, Angican G, Yalcin V. Increased formation of 8-hydroxy-2'-deoxyguanosinein peripheral blood leukocytes in bladder cancer. Urol Int. 2003;71(3):271–4.
24 Miyake H, Hara I, Kamidono S, Eto H. Prognostic significance of oxidative and damage evaluated by 8-hydroxy-2'-deoxyguanosine in patients undergoing radical nephrectomy for renal cell carcinoma. Urology. 2004;64(5):1057–61.
25 Chang CH, Yang CM, Yang AH. Renal diagnosis of chronic hemodialysis patients with urinary tract transitional cell carcinoma in Taiwan. Cancer. 2007;109(8):1487–92.