Risk stratification for 1-year mortality in acute heart failure
DOI: https://doi.org/10.4414/smw.2011.13259
C
Heinisch, C
Tschung, M
Potocki, D
Gualandro
Summary
BACKGROUND:Simple tools for risk stratification of patients with acute heart failure (AHF) are an unmet clinical need, particularly regarding long-term mortality.
METHODS:We prospectively enrolled 610 consecutive patients presenting to the emergency department with AHF. The diagnosis of AHF was adjudicated by two independent cardiologists. The classification and regression tree (CART) analysis was used to develop a simple risk algorithm. This was internally validated by cross-validation.
RESULTS: One-year follow-up was complete in all patients (100%). A total of 201 patients (33%) died within 360 days. The CART analysis identified blood urea nitrogen (BUN) and age as the best single predictors of 1-year mortality and patients were categorised to three risk groups: high risk group (BUN >27.5 mg/dl and age >86 years), intermediate risk group (BUN >27.5 mg/dl and age ≤ 86 years) and low risk group (BUN ≤ 27.5 mg/dl). The Kaplan-Meier curves showed a significant increase in mortality in the high risk group compared with the lower risk groups (log-rank test p <0.001). The hazard ratio regarding 1-year mortality between patients identified as low and high risk was 2.0 (95% confidence interval, 1.7–2.4), with statistically significant differences between all risk groups (p <0.001). The likelihood-based 95%-confidence set for the age- and the urea-threshold is contained in the rectangular set defined by 25 mg/dl ≤ urea threshold ≤30.6 mg/dl and 76 years ≤ age threshold ≤96 years.
CONCLUSION:These results suggestthat AHF patients at low, intermediate and high risk for death within 360 days can be easily identified using patient’s demographics and laboratory data obtained at presentation. Application of this simple risk stratification algorithm may help to improve the management of these patients.
Introduction
Heart failure (HF) is a major public health problem, especially in industrialised nations. Approximately fifteen million Europeans and North Americans suffer from HF and over one and half million new cases of HF are diagnosed each year [1, 2].
In addition, in patients older than 65 years HF is the leading cause of hospitalisation. HF is associated with high morbidity and mortality [3]. In contrast to chronic heart failure, risk stratification is poorly defined in acute heart failure (AHF) patients, particularly regarding long-term mortality [4–7].
Early risk stratification in AHF patients may help clinicians to individualise treatment and manage decisions [8]. For example, many AHF patients identified to be at low risk could be discharged early from the emergency department (ED) and obtain outpatient treatment. On the other hand, high risk patients might benefit from a rapid transfer to the intensive care unit with more effective treatment options. However, the prognostic performance of single variables is weak in AHF [9].
Several prior studies have defined risk stratification models for in-hospital mortality in patients hospitalised with AHF [10–12]. Recently, a simple risk stratification scheme for the prediction of in-hospital mortality based on classification and regression tree (CART) analysis was developed by the Acute Decompensated Heart Failure National Registry (ADHERE) [10]. It was unknown whether a similar approach would allow the prediction of mortality beyond the in-hospital period.
Therefore, the purpose of this study was to examine the utility of a simple algorithm in unselected AHF patients regarding 1-year mortality.
Methods
Setting and study population
The study population consisted of consecutive patients with AHF presenting to the ED, University Hospital of Basel (Switzerland), during two periods: May 2001 to April 2002 and April 2006 to March 2007. Patient recruitment had to be paused between 2003 and 2005 due to a lack of resources. Detailed data were collected from initial presentation at the ED until discharge, transfer or in-hospital death. Patients with cardiogenic shock or end-stage kidney disease (defined as serum creatinine levels of more than 250 μmol/l in the first series and by haemodialysis in the second period) were excluded, as these patients are already known to be at a high risk of death [13, 14].
The study was carried out according to the principles of the Declaration of Helsinki and approved by the local ethics committee. Written informed consent was obtained from all participants.
Adjudication of the AHF diagnosis
Two independent cardiologists reviewed all medical records pertaining to the patient (including B-type natriuretic peptide (BNP) levels, chest X-ray, medical history, echocardiography, cardiac catheterisation, pulmonary function test, CT scan, right heart catheterisation, hospital course, response to therapy, and autopsy data for those patients who died in-hospital) from the time of ED presentation to the results of the 90-day follow up. Cases of disagreement were resolved in conjunction with a third cardiologist. For the diagnosis and classification of AHF, the guidelines of the European Society of Cardiology were interpreted as a continuous variable to make best use of the information provided by this test [1]. Absolute BNP values were adjusted for the presence of both kidney disease and obesity to maximise diagnostic accuracy [15].
Clinical evaluation and follow-up
Patients underwent an initial clinical assessment including clinical history, a physical examination, an electrocardiogram, pulse oximetry, blood tests including B-type natriuretic peptide (BNP) measurement and a chest X-ray. Echocardiography and pulmonary function tests were performed according to the treating physician. Patients were contacted for follow-up via telephone by trained researchers at 90, 180 and 360 days after discharge. Regarding mortality data, referring physicians were contacted or the administrative database of respective hometowns were reviewed if necessary. A one year follow-up was completed in 100% of patients.
Risk model development
We performed CART analyses, as a multivariate statistical technique, to identify the best predictors of 1-year mortality and develop a risk stratification model. The CART method allows the construction of an easily interpretable decision tree that can be applied in clinical practice. As a first step, the CART model calculates parameters with cut-off points, which differentiate optimally between the study groups. These cut-offs split the data into constituent groups. In a second step, parameters are calculated, which offer the best further differentiation between the subgroups. Thereby a tree is created, whose branches are the various groups and subgroups. The CART analysis stops branching until no further significant splits are found or the subgroups become too small. In a final step, the results are displayed in a binary structure, which is pruned as necessary [16, 17].
A total of 38 potential clinical and laboratory variables of interest, inclusive of BNP and NT-pro BNP, were adapted in the CART analysis. The variables were collected from 150 registered variables in the cohort. The selection of variables was carried out on the one hand by clinical importance and on the other hand by risk factors, which had already been identified in previous published studies [18]. Based on the detected predictors for 1-year mortality, patients were classified into risk groups. From these risk groups a regression tree was developed and differences regarding 1-year outcome were analysed. The predictive value of this model was then assessed by determination of hazard ratio (HR) and 95% confidence intervals (CIs) between all risk groups. Finally, the risk stratification tree was internally validated by cross-validation.
Statistical analysis
Continuous variables are presented as mean ± standard deviation (SD) or medians (with interquartile range) and categorical variables as numbers and percentages. Comparisons between groups were made using the Student’s t-test, Chi-square test, Mann-Whitney U Test, Wilcoxon test and Kruskal-Wallis test as appropriate. Correlations among continuous variables were assessed by the Spearman rank- correlation coefficient. In the 2-sided test, a p-value <0.05 was regarded as significant. To determine the best cut-off of clinical variables in risk groups, CART analyses were applied. The predictive value of this model regarding 1-year mortality was checked by the application of mortality HR and 95% CIs between all risk groups. Kaplan-Meier analysis cumulative survival curves, in which patients were divided into risk groups, were compared by the log-rank test or χ² analysis. The likelihood-based 95%-confidence set for age and urea-threshold was used for the internal validation. All statistical analyses were performed using SPSS/PC Version 15.0 (SPSS Inc, Chicago, IL).
Results
Patient’s demographics and characteristics
The baseline characteristics of the 610 patients presenting with AHF are described in table 1. Overall, the mean age was 82 years, and 46% of patients were women. A history of hypertension was present in 71% of patients, chronic kidney disease in 39% and chronic obstructive pulmonary disease in 25%. Diuretics (82%) were the most common oral chronic medication recorded at the time of presentation to the ED, followed by inhibitors of renin-angiotensin-aldosterone-system (angiotensin converting enzyme inhibitors and/or angiotensin receptor blocker) (76%), and beta-blockers (61%). At 360 days, all-cause mortality was 33%.
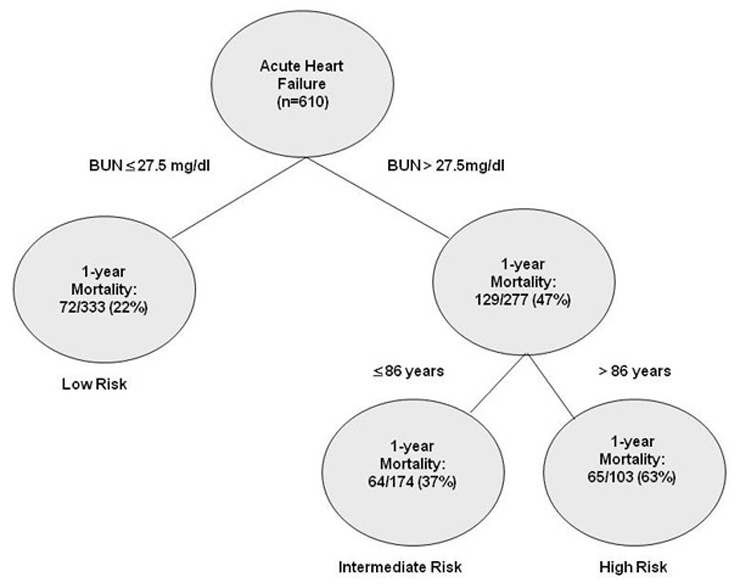
Figure 1
Risk stratification algorithm of AHF patients regarding 1-year mortality.
Risk groups: high risk group (BUN >27.5 mg/dl and age >86 years), intermediate risk group (BUN >27.5 mg/dl and age ≤86 years) and low risk group (BUN ≤27.5 mg/dl); each node is based on available data from patients presenting to the ED.
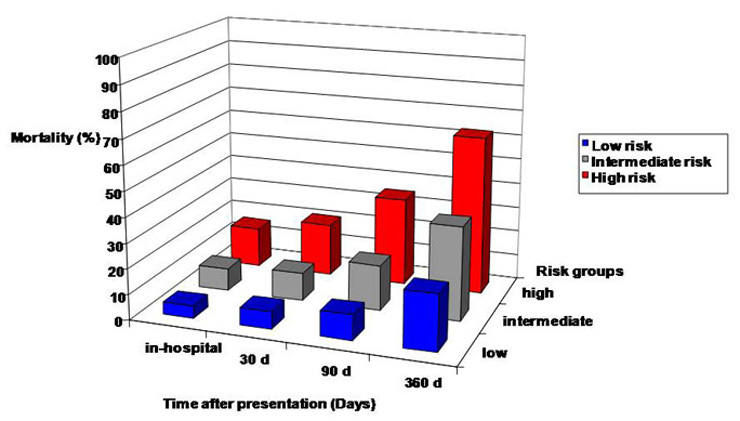
Figure 2
Mortality in patients with AHFD over time according to risk groups: high risk group (BUN >27.5 mg/dl and age >86 years), intermediate risk group (BUN >27.5 mg/dl and age ≤86 years) and low risk group (BUN ≤27.5 mg/dl).
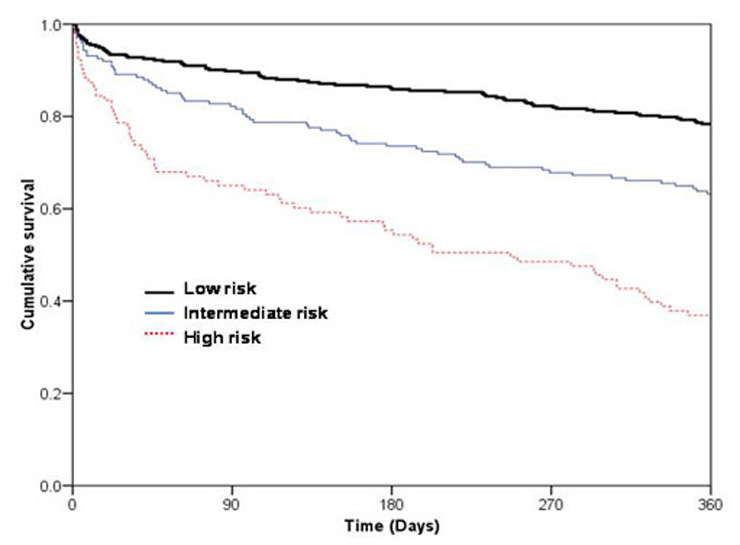
Figure 3
Kaplan-Meier curves demonstrating cumulative survival in patients with AHF over time according to risk groups: high risk group (BUN >27.5 mg/dl and age >86 years), intermediate risk group (BUN >27.5 mg/dl and age ≤86 years) and low risk group (BUN ≤27.5 mg/dl); p <0.001 by log-rank.
Survivors differed from non-survivors in several baseline characteristics including lower age, lower prevalence of chronic kidney disease, higher systolic and diastolic blood pressure, and several laboratory values. Plasma levels of blood urea nitrogen (BUN) on admission were significantly lower in survivors than in non- survivors. The same finding was observed for serum creatinine, BNP and NT-pro BNP (all p <0.01) (table 1).
Risk group stratification
For 1-year mortality in AHF patients, 38 clinical variables were evaluated (table 2). The median length of follow-up was 380 days. In the study cohort, 100% of subjects had complete data and were included in the analysis. BUN and age could be identified by CART analysis as the most important risk relevant parameters, while BUN was the strongest predictor. Patients were categorised according to three risk groups: high risk group (BUN >27.5 mg/dl and age >86 years), intermediate risk group (BUN >27.5 mg/dl and age ≤86 years) and low risk group (BUN ≤27.5 mg/dl) (fig. 1). A total of 55% of the cohort could be stratified to low risk, while 29% were in the intermediate group and 17% were in the high risk group. In table 3, all patients’ demographics and characteristics for each risk group are summarised. Compared to low risk patients, a history of chronic kidney disease was more common in the intermediate risk and high risk patient groups (p <0.01). The mean systolic and diastolic blood pressure was significant lower in the high risk group (p <0.01). In addition, mean values of in-hospital stay increased by the level of risk group (high risk: 18 ± 13; intermediate risk: 15 ± 11 and low risk: 13 ± 12 days; p <0.01).
Prediction of long-term outcome in risk groups
The CART tree with 1-year mortality data of each subgroup is depicted in figure 1. Figure 2 illustrates an increase in mortality according to risk group and the time interval after hospital presentation. The figure clarifies that BUN and age, as predictors of long-term outcome, are also suitably applicable for risk assessment regarding in-hospital mortality, mortality at 30 days and mortality at 90 days.
The Kaplan-Meier analysis according to the risk groups at presentation demonstrated lower one-year mortality in low risk (22%) and intermediate risk groups (37%) compared to the high risk group (63%) (Log-rank test p <0.001; figure 3). The HR regarding 1-year mortality between the high and low risk groups was 1.9 (95% CI, 1.7–2.2), between the high and intermediate risk groups it was 2 (95% CI, 1.5–2.7), and between the intermediate and low risk groups it was 1.7 (95% CI, 1.3–2.3), with statistically significant differences between all risk groups (p <0.001; table 4). We used cross-validation to internally validate the results. The likelihood-based 95%-confidence set for the age- and the urea-threshold is contained in the rectangular set defined by 25 mg/dl ≤ urea threshold ≤30.6 mg/dl and 76 years ≤ age threshold ≤96 years. Rehospitalisation for acute heart failure was analysed as a secondary endpoint. Among the risk-groups, patients did not differ significantly in terms of rehospitalisation due to heart failure (high-risk: 16% vs. intermediate-risk: 26% vs. low-risk: 11%, p = 0.6).
|
Table 1: Demographic and clinical characteristics of all AHF patients.¹= Paroxysmal nocturnal dyspnea, ² B-type natriuretic peptide, ³ N-terminal pro-B-type natriuretic peptide; Data are presented as median (interquartile range), number of patients (%) or mean ± SD. *positive troponin T ≥0.04 ng/ml. |
| |
|
All AHF patients
|
Non-survivors
|
Survivors
|
p-values
|
| |
Total number of patients, n (%) |
610 (100) |
201 (33) |
409 (67) |
|
| Age (year), median (IQR) |
82 (75–88) |
86 (79–89) |
80 (73–86) |
<0.01 |
| Female, n (%) |
280 (46) |
91 (45) |
189 (46) |
0.96 |
|
Medical history, n (%)
|
Arterial hypertension |
430 (71) |
135 (67) |
295 (72) |
0.64 |
| Chronic obstructive pulmonary disease |
154 (25) |
58 (29) |
96 (24) |
0.31 |
| Diabetes mellitus |
180 (30) |
56 (28) |
124 (30) |
0.71 |
| Chronic kidney disease |
243 (39) |
108 (54) |
135 (33) |
<0.01 |
| Neoplastic disease |
111 (18) |
46 (23) |
65 (16) |
0.10 |
| Stroke |
174 (29) |
67 (33) |
107 (26) |
0.20 |
|
Long term medication use, n (%)
|
Diuretics |
475 (82) |
151 (75) |
261 (64) |
0.25 |
| Betablockers |
357 (61) |
99 (49) |
202 (49) |
0.95 |
| Nitrates |
201 (35) |
46 (23) |
80 (20) |
0.51 |
| ACE-Inhibitors/angiotensin receptor blockers |
440 (76) |
106 (53) |
234 (57) |
0.63 |
| Digitalis |
51 (9) |
26 (13) |
28 (7) |
0.04 |
| Aspirin |
233 (40) |
82 (41) |
167 (41) |
0.94 |
| Calcium channel blockers |
112 (19) |
37 (18) |
85 (21) |
0.65 |
| Anticoagulation |
256 (44) |
73 (36) |
135 (33) |
0.63 |
|
Clinical symptoms, n (%)
|
Dyspnea |
|
|
|
|
| NYHA I-II |
53 (9) |
12 (6) |
41 (10) |
0.17 |
| NYHA III |
294 (48) |
81 (40) |
213 (52) |
0.12 |
| NYHA IV |
261(43) |
108 (54) |
153 (37) |
0.02 |
| Weight gain |
149 (24) |
52 (26) |
97 (24) |
0.72 |
| Orthopnoe/PND¹ |
332 (54) |
106 (53) |
226 (55) |
0.81 |
| Chest pain |
213 (35) |
65 (32) |
148 (36) |
0.57 |
| Coughing |
297 (49) |
101 (50) |
196 (48) |
0.81 |
|
Clinical signs, n (%)
|
Elevated jugular venous pressure |
202 (33) |
80 (40) |
122 (30) |
0.10 |
| Hepatojugular reflux |
144 (24) |
57 (28) |
87 (21) |
0.16 |
| Rales |
378 (62) |
129 (64) |
249 (61) |
0.76 |
| Peripheral oedema |
319 (52) |
112 (56) |
207 (51) |
0.56 |
|
Vital status, median (IQR)
|
Systolic blood pressure (mm Hg) |
139
(122–162) |
131
(114–156) |
141
(125–166) |
<0.01 |
| Diastolic blood pressure (mm Hg) |
85 (71–98) |
80 (68–94) |
86 (68–94) |
<0.01 |
| Heart rate (beats per minute) |
91 (74–111) |
92 (75–108) |
91 (74–111) |
0.51 |
| Oxygen saturation (%) |
96 (92–98) |
95 (90–98) |
96 (93–98) |
<0.01 |
|
Laboratory values, median (IQR)
|
Blood urea nitrogen (mg/dl) |
25.8 (18.2–41.3) |
33.4 (22.5–50.5) |
23 (16.8–36.5) |
<0.01 |
| Creatinine (µmol/l) |
106 (80–147) |
125 (91–171) |
100 (78–139) |
<0.01 |
| Sodium (mmol/L) |
138 (135–140) |
138 (134–140) |
138 (136–140) |
0.19 |
| Haemoglobin (g/l) |
129 (114–143) |
123 (111–140) |
131 (116–145) |
<0.01 |
| BNP² (pg/ml) |
843 (445–1300) |
1300 (635–1893) |
741 (401–1300) |
<0.01 |
| Pro-NT- BNP³ (pg/ml) |
5966 (2177–13935) |
13246 (5055–20851) |
4165 (1845–9310) |
<0.01 |
| Positive troponin T*, n (%) |
255 (42) |
112 (56) |
143 (35) |
<0.01 |
|
Table 2: Variables tested for their predictive potential for 1-year mortality.¹ = paroxysmal nocturnal dyspnea, ² B-type natriuretic peptide, ³ N-terminal pro-B-type natriuretic peptide; Data are presented as median (interquartile range), number of patients (%) or mean ± SD. Definition of risk groups: high risk group (BUN >27.5 mg/dl and age >86 years), intermediate risk group (BUN <27.5 mg/dl and age ≤86 years) and low risk group (BUN ≤27.5 mg/dl). *Positive troponin T ≥0.04 ng/ml |
|
Demographic and baseline clinical characteristics
|
Age |
| Gender |
| Systolic blood pressure |
| Diastolic blood Pressure |
| Heart rate |
| Elevated jugular venous pressure |
| Hepatojugular reflux |
| Pulmonary rales |
| Peripheral oedema |
| Dyspnea New York Heart Association (NYHA) state |
| Weight gain |
| Orthopnoe / paroxysmal nocturnal dyspnea |
| Chest pain |
| History of coronary artery disease |
| History of arterial hypertension |
| History of chronic renal insufficiency |
| History of chronic heart failure |
| History of diabetes |
|
Chronic medication
|
Diuretics |
| Betablockers |
| Nitrates |
| Angiotensin converting enzyme inhibitors / angiotensin receptor blockers |
| Digitalis |
| Amiodaron |
| Aspirin |
| Calcium channel blockers |
| Anticoagulation |
|
Laboratory data
|
Sodium |
| Potassium |
| Haemoglobin |
| Albumin |
| Creatinine |
| Blood urea nitrogen |
| Uric acid |
| C-reactive protein |
| B-type natriuretic peptide |
| N-terminal pro-B-type natriuretic peptide |
| Positive Troponin (≥0.04 ng/ml) |
|
Table 3: Demographic and clinical characteristics of risk groups. |
|
|
High risk
|
Intermediate risk
|
Low risk
|
p- values
|
| |
Total number of patients, n (%) |
103 (17) |
174 (28.5) |
333 (54.5) |
|
| Age (years), median (IQR) |
91 (88–94) |
79 (74–84) |
81 (73–87) |
<0.001 |
| Female, n (%) |
52 (51) |
39 (40) |
159 (48) |
0.38 |
|
Medical history, n (%)
|
Chronic heart failure |
36 (35) |
66 (57) |
75 (23) |
0.02 |
| Coronary artery disease |
64 (62) |
101 (58) |
163 (49) |
0.15 |
| Arterial hypertension |
74 (72) |
136 (78) |
220(66) |
0.43 |
| Chronic obstructive pulmonary disease |
23 (22) |
50 (29) |
81 (24) |
0.99 |
| Asthma bronchiale |
1 (1) |
5 (3) |
8 (2) |
0.55 |
| Diabetes mellitus |
22 (21) |
79 (45) |
79 (24) |
0.34 |
| Chronic kidney disease |
70 (68) |
125 (72) |
48 (14) |
<0.01 |
| Neoplastic disease |
20 (19) |
35 (20) |
56 (17) |
0.39 |
| Stroke |
32 (31) |
66 (38) |
76 (23) |
0.06 |
|
Medication discharge, n (%)
|
Diuretics |
86 (84) |
146 (84) |
180 (54) |
<0.01 |
| Betablockers |
49 (48) |
115 (66) |
137 (41) |
0.11 |
| Nitrates |
29 (28) |
40 (23) |
57 (17) |
0.04 |
| ACE-Inhibitors / angiotensin receptor blockers |
63 (61) |
106 (61) |
171 (51) |
0.25 |
| Digitalis |
14 (14) |
19 (11) |
21 (6) |
0.02 |
| Amiodaron |
6 (6) |
27 (16) |
28 (8) |
0.87 |
| Aspirin |
52 (51) |
68 (39) |
129 (39) |
0.24 |
| Calcium channel blockers |
16 (16) |
46 (26) |
60 (18) |
0.85 |
| Anticoagulation |
31 (30) |
65 (37) |
112 (34) |
0.84 |
|
Clinical symptoms, n (%)
|
Dyspnea |
|
|
|
<0.01 |
| NYHA II |
8 (8) |
10 (6) |
35 (11) |
0.22 |
| NYHA III |
48 (47) |
83 (48) |
163 (49) |
0.79 |
| NYHA IV |
47 (46) |
81 (47) |
133 (40) |
0.40 |
| Weight gain |
24 (23) |
63 (36) |
62 (19) |
0.08 |
| Orthopnoe/PND¹ |
49 (48) |
107 (62) |
176 (53) |
0.91 |
| Chest pain |
36 (35) |
62 (36) |
115 (35) |
0.92 |
| Coughing |
46 (45) |
78 (45) |
173 (52) |
0.34 |
|
Clinical signs, n (%)
|
Elevated jugular venous pressure |
52 (51) |
58 (33) |
92 (28) |
<0.01 |
| Hepatojugular reflux |
32 (31) |
42 (24) |
70 (21) |
0.11 |
| Rales |
73 (71) |
105 (60) |
200 (60) |
0.41 |
| Peripheral oedema |
64 (62) |
110 (63) |
145 (44) |
0.02 |
|
Vital status, median (IQR)
|
Blood pressure (mm Hg) |
|
|
|
|
| Systolic |
131 (112–158) |
135 (112–162) |
142 (127–163) |
<0.01 |
| Diastolic |
80 (67–90) |
80 (68–93) |
90 (76–102) |
<0.01 |
| Heart rate (beats per minute) |
87 (71–104) |
89 (69–104) |
96 (79–115) |
0.03 |
| Oxygen saturation (%) |
96 (92–98) |
96 (90–99) |
96 (93–98) |
0.89 |
|
Laboratory values, median (IQR)
|
Sodium (mmol/l) |
138 (136–140) |
138 (135–140) |
138 (153–140) |
0.19 |
| Haemoglobin (g/l) |
121 (111–134) |
122 (107–137) |
135 (121–147) |
<0.01 |
| Creatinine (μmol/l) |
152 (120–210) |
143 (117–173) |
84 (69–103) |
<0.01 |
| BNP² (pg/ml) |
1160 (602–1655) |
985 (601–1492) |
689 (357–1300) |
<0.01 |
| Pro-NT- BNP³ (pg/ml) |
11941 (7389–18644) |
10285 (2799–25623) |
3678 (1687–7822) |
<0.01 |
| Positive troponin*, n (%) |
61 (59) |
88 (51) |
106 (32) |
<0.01 |
|
Length of stay (days) mean (±SD)
|
Total hospital |
18 ± 13 |
15 ± 11 |
13 ± 12 |
<0.01 |
|
Table 4: Cox regression analysis with corresponding HR (95% CI) of all risk groups. |
|
Long-term mortality between risk groups
|
|
Risk group analysis
|
HR (95% CI)
|
p-values
|
| High risk vs. |
Intermediate risk |
2 (1.5–2.7) |
<0.001 |
| Low risk |
1.9 (1.65–2.21) |
<0.001 |
| Intermediate risk vs. |
Low risk |
1.73 (1.3–2.3) |
<0.001 |
Discussion
Early, rapid and accurate estimation of mortality risk in AHF patients is an unmet clinical need. We report five major findings from a large cohort of unselected AHF patients.
First, mortality was progressive over the whole period of 360 days and was very high at 1-year (33%). Only a minority (8%) of AHF patients died during the initial hospitalisation. Secondly, CART analysis identified two simple and universally available variables as the most powerful predictors of death. BUN and age were the strongest predictors regarding 1-year mortality. It is interesting to note, that these simple variables even outperformed novel biomarkers including BNP and NT-pro BNP [19–21]. Thirdly, the definition of AHF patients at low, intermediate and high risk can performed by BUN and age even as early as at presentation to the ED. Fourth, this risk stratification algorithm developed for 1-year mortality is also well suited for the distribution of AHF patients into low, intermediate and high risk regarding mortality in-hospital, at 30 days and at 90 days. Fifth, our CART analysis extends recent findings from ADHERE that BUN is not only the most powerful predictor of in-hospital death but also of death within 1 year.
These findings are of prime clinical pertinence, as predictors regarding long-term outcome are poorly defined. Several prior studies have already demonstrated high mortality in patients with AHF after hospital discharge. The all-cause mortality risk after hospitalisation has been reported to be as high as 11% at 30 days and 40–50% at one year [11, 22]. Furthermore, early risk stratification might help to specifically tailor medical therapies to the need of the individual patient. This of course is of particular importance in emergency medical practice. However, risk stratification has not been integrated into the scenario of AHF because of differences in the clinical decompensated patients and due to the complexity of risk models [23].
Renal function is an important determination of clinical outcomes in cardiovascular disease [24, 25]. Patients with AHF have a reduction of renal perfusion pressure and an increase in water und urea reabsorption within hours and days. BUN reflects the acute change in renal perfusion, sodium and water retention and neurohormonal activation. In contrast, serum creatinine and creatinine-clearance are accurate measures of renal function under stable conditions [26]. Elevated BUN, as a better prognostic marker, may reflect the current worsening of the heart failure state in AHF patients [27, 28]. Furthermore, older age was independently associated with 1-year mortality risk. The increased risk of mortality in older patients with AHF has been observed in previous HF studies [29, 30]. Manifestation of AHF is apparently very frequent in the last year of life and mainly in patients above 80 years of age. Risk stratification may help in the earlier identification of patients hospitalised because of AHF for whom a hospice is an appropriate care option and could provide a better quality of life [31, 32].
Our findings confirm and extend data from studies including selected patients with severe AHF, in recent randomised studies such as EFFECT and OPTIME-CHF, in that age and renal dysfunction are powerful predictors of long-term mortality [12, 13]. Both demonstrated the prognostic importance of an increase in BUN and older age as significant and independent predictors of death. Additional parameters have been correlated with mortality in AHF patients including gender, aetiology and history of heart failure, lower systolic blood pressure, comorbid conditions, serum sodium and biomarkers, such as BNP, NT-proBNP and troponin I and T [8]. However, thus far risk models have been complex issues and possessed limited clinical applicability.
The CART regression tree is a simple method for risk stratification that is relatively easy to apply at the bedside. Based on this schema the mortality risk can be estimated with patient’s characteristics and laboratory parameters at presentation to the ED.
Recently, ADHERE patient records were used to develop a risk stratification tree, based on CART analysis for in-hospital mortality. Of the 39 variables evaluated, the CART method identified the following three variables as predictors of mortality: BUN levels of ≥43 mg/dL (15 mmol/L), systolic blood pressure at a discrimination level of less than 115 mm Hg and a serum creatinine level of >2.75 mg/dL (243.1 µmol/L) at admission. This analysis also found BUN to be the strongest predictor of in-hospital mortality.
Our findings highlight that some elements of the ADHERE algorithm may not apply globally due to the restricted transferability of the United States health care system. This is important because some other trials have already demonstrated that there are huge variations in mortality among countries with differences in health care structure, cultural background, and economic strength [33, 34]. One of the differences is the aetiology of decompensation. The majority of American patients hospitalised with AHF have evidence of systemic hypertension on admission [35]. As demonstrated by many descriptive studies, the aetiology of known heart failure in European patients was ischemic in most of the cases [36]. In addition, there are major differences in the length of hospitalisation of AHF patients in the United States and most of the rest of the world. The duration of hospital stay for AHF is longer in Asia, Europe, Australia, Canada, and South America compared to the United States [13, 37, 38]. This might have implications on in-hospital mortality, therefore we determined mortality at 360 days after hospital presentation. Finally, the ADHERE analysis was based on the subset of AHF patients selected for admission, while we recruited all AHF patients at presentation to the ED.
Limitations
Several limitations apply to this study. Firstly, all studies attempting to use a clinical diagnosis as gold standards for a syndrome have some limitations. Although the gold standard diagnosis was adjudicated by two independent cardiologists, misclassification remains a possibility because AHF is a clinical diagnosis and no gold standard exists. Secondly, we assessed all-cause mortality because classification of death in clinical practice can sometimes be difficult and unreliable [39]. Thirdly, data derived from a single-centre study always need to be replicated in larger multicentre studies. The risk stratification particularly requires an external validation and bedside experience. However, our patient cohort was comparable to those examined in recent multicentre studies. Finally, patients with terminal kidney failure requiring dialysis were excluded from the analysis.
Conclusion
Our results suggest that standard measures available at the time of hospital presentation can provide important information for risk stratification in AHF. Based on BUN (as the strongest predictor regarding long-term mortality) and age, AHF patients can quickly and effectively be stratified to low, intermediate or high risk. Application of these simple values may help physicians as a bedside tool for a better management of AHF patients.
Acknowledgements:We are indebted to the patients who participated in the study and to the emergency department staff as well as the laboratory technicians for their most valuable efforts, and we thank Michael Freese, Claudia Stelzig, Irina Klimmeck, Kris Denhaerynck, Raphael Twerenbold, Miriam Reiter, Nora Schaub, Markus Noveanu, Tobias Reichlin, Heiko Uthoff and Willibald Hochholzer from the research team.
References
1 Dickstein K, Cohen-Solal A, Filippatos G, McMurray JJ, Ponikowski P, Poole-Wilson PA, et al. ESC Guidelines for the diagnosis and treatment of acute and chronic heart failure 2008: the Task Force for the Diagnosis and Treatment of Acute and Chronic Heart Failure 2008 of the European Society of Cardiology. Developed in collaboration with the Heart Failure Association of the ESC (HFA) and endorsed by the European Society of Intensive Care Medicine (ESICM). Eur Heart J. 2008;29:2388–442.
2 Nieminen MS, Böhm M, Cowie MR, Drexler H, Filippatos GS, Jondeau G, et al. Executive summary of the guidelines on the diagnosis and treatment of acute heart failure: the Task Force on Acute Heart Failure of the European Society of Cardiology. Eur Heart J. 2005;26:384–416.
3 Roger VL, Weston SA, Redfield MM, Hellermann-Homan JP, Killian J, Yawn BP, et al. Trends in heart failure incidence and survival in a community-based population. JAMA. 2004;292:344–50.
4 Selker HP,Griffith JL, D’Agostino RB. A time-insensitive predictive instrument for acute hospital mortality due to congestive heart failure: development, testing, and use for comparing hospitals: a multicenter study. Med Care. 1994;32:1040–52.
5 Chin MH,Goldman L. Correlates of major complications or death in patients admitted to the hospital with congestive heart failure. Arch Intern Med. 1996;156:1814–20.
6 Kearney MT, Fox KA, Lee AJ, Prescott RJ, Shah AM, Batin PD, et al. Predicting death due to progressive heart failure in patients with mild-to-moderate chronic heart failure. J Am Coll Cardiol. 2002;40:1801–8.
7 Cohn JN, Johnson GR, Shabetai R, Loeb H, Tristani F, Rector T, et al. Ejection fraction, peak exercise oxygen consumption, cardiothoracic ratio, ventricular arrhythmias, and plasma norepinephrine as determinants of prognosis in heart failure. The V-HeFT VA Cooperative Studies Group. Circulation. 1993;87:VI5–16.
8 Salem R, Sibellas F, Socrates T, Arenja N, Yilmaz MB, Mueller C, et al. Novelties in the early management of acute heart failure syndromes. Swiss Med Wkly. 2010;140:w13031
9 Felker GM, Adams KF Jr, Konstam MA, O'Connor CM, Gheorghiade M. The problem of decompensated heart failure: nomenclature, classification, and risk stratification. Am Heart J. 2003;145:18–25.
10 Fonarow GC, Adams KF Jr, Abraham WT, Yancy CW, Boscardin WJ. Risk stratification for in-hospital mortality in acutely decompensated heart failure: classification and regression tree analysis. JAMA. 2005;293:572–80.
11 Lee DS, Austin PC, Rouleau JL, Liu PP, Naimark D, Tu JV. Predicting mortality among patients hospitalized for heart failure: derivation and validation of a clinical model. JAMA. 2003;290:2581–7.
12 Felker GM, Leimberger JD, Califf RM, Cuffe MS, Massie BM, Adams KF, Jr., et al. Risk stratification after hospitalization for decompensated heart failure. J Card Fail. 2004;10:460–6.
13 Zannad F, Mebazaa A, Juilliere Y, Cohen-Solal A, Guize L, Alla F, et al. Clinical profile, contemporary management and one-year mortality in patients with severe acute heart failure syndromes: The EFICA study. Eur J Heart Fail. 2006;8:697–705.
14 Rudiger A, Harjola VP, Müller A, Mattila E, Saila P, Nieminen M, et al. Acute heart failure: clinical presentation, one-year mortality and prognostic factors. Eur J Heart Fail. 2005;7:662–70.
15 Maisel A, Mueller C, Adams K, Jr., Anker SD, Aspromonte N, Cleland JG, et al. State of the art: using natriuretic peptide levels in clinical practice. Eur J Heart Fail. 2008;10:824–39.
16 Muller R, Möckel M. Logistic regression and CART in the analysis of multimarker studies. Clin Chim Acta. 2008;394:1–6.
17 Colombet I, Ruelland A, Chatellier G, Gueyffier F, Degoulet P, Jaulent MC. Models to predict cardiovascular risk: comparison of CART, multilayer perceptron and logistic regression. Proc AMIA Symp. 2000;156–60.
18 Fonarow GC. Epidemiology and risk stratification in acute heart failure. Am Heart J. 2008;155:200–7.
19 Noveanu M, Breidthardt T, Cayir S, Potocki M, Laule K, Mueller C. B-type natriuretic peptide-guided management and outcome in patients with obesity and dyspnea – results from the BASEL study. Am Heart J. 2009;158:488–95.
20 Boldanova T, Noveanu M, Breidthardt T, Potocki M, Reichlin T, Taegtmeyer A, et al. Impact of history of heart failure on diagnostic and prognostic value of BNP: results from the B-type Natriuretic Peptide for Acute Shortness of Breath Evaluation (BASEL) study. Int J Cardiol. 2010;142:265–72.
21 Christ M, Laule-Kilian K, Hochholzer W, Klima T, Breidthardt T, Perruchoud AP, et al. Gender-specific risk stratification with B-type natriuretic peptide levels in patients with acute dyspnea: insights from the B-type natriuretic peptide for acute shortness of breath evaluation study. J Am Coll Cardiol. 2006;48:1808–12.
22 Jong P, Vowinckel E, Liu PP, Gong Y, Tu JV. Prognosis and determinants of survival in patients newly hospitalized for heart failure: a population-based study. Arch Intern Med. 2002;162:1689–94.
23 Rohde LE, Goldraich L, Polanczyk CA , Borges AP, Biolo A, Rabelo E, et al. A simple clinically based predictive rule for heart failure in-hospital mortality. J Card Fail. 2006;12:587–93.
24 Manjunath G, Tighiouart H, Ibrahim H, MacLeod B, Salem DN, Griffith JL, et al. Level of kidney function as a risk factor for atherosclerotic cardiovascular outcomes in the community. J Am Coll Cardiol. 2003;41:47–55.
25 Al Suwaidi J, Reddan DN, Williams K, Pieper KS, Harrington RA, Califf RM, et al. Prognostic implications of abnormalities in renal function in patients with acute coronary syndromes. Circulation. 2002;106:974–80.
26 Aronson D, Mittleman MA, Burger AJ. Elevated blood urea nitrogen level as a predictor of mortality in patients admitted for decompensated heart failure. Am J Med. 2004;116:466–73.
27 Kazory A. Emergence of blood urea nitrogen as a biomarker of neurohormonal activation in heart failure. Am J Cardiol. 2010;106:694–700.
28 Filippatos G, Rossi J, Lloyd-Jones DM, Stough WG, Ouyang J, Shin DD, et al. Prognostic value of blood urea nitrogen in patients hospitalized with worsening heart failure: insights from the Acute and Chronic Therapeutic Impact of a Vasopressin Antagonist in Chronic Heart Failure (ACTIV in CHF) study. J Card Fail. 2007;13:360–4.
29 Fonarow GC, Abraham WT, Albert NM, Stough WG, Gheorghiade M, Greenberg BH, et al. Age- and gender-related differences in quality of care and outcomes of patients hospitalized with heart failure (from OPTIMIZE-HF). Am J Cardiol. 2009;104:107–15.
30 Smith GL, Shlipak MG, Havranek EP, Foody JM, Masoudi FA, Rathore SS, et al. Serum urea nitrogen, creatinine, and estimators of renal function: mortality in older patients with cardiovascular disease. Arch Intern Med. 2006;166:1134–42.
31 Hauptman PJ, Goodlin SJ, Lopatin M, Costanzo MR, Fonarow GC, Yancy CW. Characteristics of patients hospitalized with acute decompensated heart failure who are referred for hospice care. Arch Intern Med. 2007;167:1990–7.
32 Krumholz HM, Wang Y, Parent EM, Mockalis J, Petrillo M, Radford MJ. Quality of care for elderly patients hospitalized with heart failure. Arch Intern Med. 1997;157:2242–7.
33 Cowburn PJ, Cleland JG, Coats AJ, Komajda M. Risk stratification in chronic heart failure. Eur Heart J. 1998;19:696–710.
34 Stewart S, Demers C, Murdoch DR, McIntyre K, MacLeod ME, Kendrick S, et al. Substantial between-hospital variation in outcome following first emergency admission for heart failure. Eur Heart J. 2002;23:650–7.
35 Gheorghiade M, Zannad F, Sopko G, Klein L, Piña IL, Konstam MA, et al. Acute heart failure syndromes: current state and framework for future research. Circulation. 2005;112:3958–68.
36 Alla F, Zannad F, Filippatos G. Epidemiology of acute heart failure syndromes. Heart Fail Rev. 2007;12:91–5.
37 Cleland JG, Swedberg K, Follath F, Komajda M, Cohen-Solal A, Aguilar JC, et al. The EuroHeart Failure survey programme – a survey on the quality of care among patients with heart failure in Europe. Part 1: patient characteristics and diagnosis. Eur Heart J. 2003;24:442–63.
38 Tavazzi L, Maggioni AP, Lucci D, Cacciatore G, Ansalone G, Oliva F, et al. Nationwide survey on acute heart failure in cardiology ward services in Italy. Eur Heart J. 2006;27:1207–15.
39 Pratt CM, Greenway PS, Schoenfeld MH, Hibben ML, Reiffel JA. Exploration of the precision of classifying sudden cardiac death. Implications for the interpretation of clinical trials. Circulation. 1996;93:519–24.