Figure 1
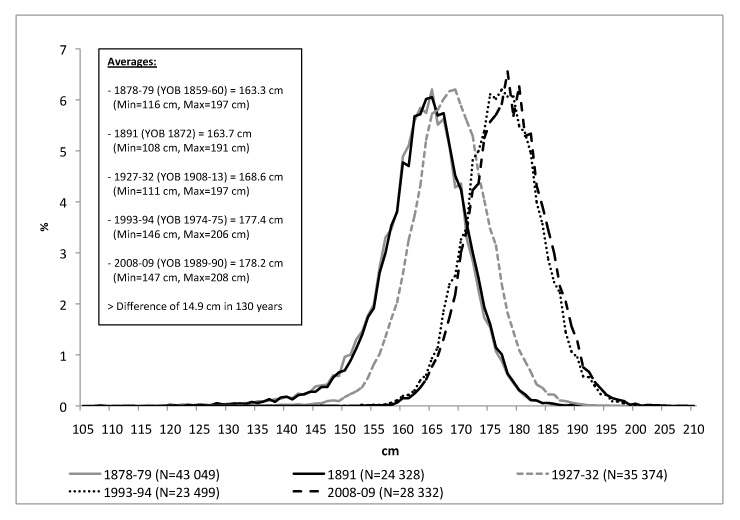
Shifting of the height distribution of 19-year-old Swiss conscripts from 1878–79 to 2008–09 (complete conscription years).
DOI: https://doi.org/10.4414/smw.2011.13238
From the third quarter of the 19th century until the last decade of the 20th century, average human height increased at a steep and steady ratethroughout the Western world, including Europe[1–6]. This (positive) secular trend for average body height has been observed since the beginning of the 20th century [7; 8]. Along with a faster rate of physical development and an earlier onset of menarche, this increase in average height is part of the secular acceleration phenomenon [9–11; 3].
Average height trends at the national level have been well documented, based primarily on conscription and health survey data [e.g. 12]. A huge body of data on individual conscripts (men from 18 to 21 years of age) are available for analysis. On the other hand, research on secular height changes in general is hindered by three major difficulties regarding consistency. Firstly, international comparability is limited by differences among military draft systems and policies, including the age of conscription and minimum height requirements [13–14]. Secondly, since the 1990s the height data recorded in national and international health surveys as well as household panels have been of the self-reported variety, leading to an overestimation of mean height [15–16]. Thirdly, the earliest data from health surveys date from the 1950s (analysed by year of birth).
Economic historians have studied the secular height trends of Switzerland’s neighbours: France [17–21], Germany [22–24], Austria [25–26], and Italy [4], and in both Austria [27–28] and Germany [29–30], medical, auxological and anthropological studies of height trends have provided insights into secular height trends by drawing on national conscript data.
Both long term and recent height trends at the multinational level have been studied. Deaton [31] used health survey and household panel data to track both male and female mean height trends worldwide since the 1950s, whereas Garcia and Quintana-Domecque [32] used the same category of sources but limited the scope of their study to Europe. In their study of European conscripts during the period 1960–90 Schmidt et al. [33] concluded that since the 1980s the growth trend in the Netherlands and Scandinavia slowed to a stable mean height of 179–181 cm, whereas there was no such slowdown among southern European conscripts. Larnkjær et al. [34], in a study spanning the following 15 years, reported that average heights reached a plateau in northern Europe and Italy, whereas they continued on their upward trend in Spain and Portugal. Both Susanne et al. [35] and Danubio [36] reached the same conclusion. Hatton and Bray [12], drawing on both conscription and health survey data for the birth cohorts 1856–1980, found that over the entire 124 year period the average height of males of conscription age throughout Western Europe increased at an average rate of 1 cm per decade, and nearly doubled during the years between the First and Second World Wars. Several studies describe a slowdown in the US height trend that has inversed the gap between the US and Europe in the 20th century [37, 38] and catch-up growth on the part of conscripts from eastern Germany after reunification [24, 39, 40].
Precise information on adult male height in present day Switzerland, not to mention its recent and long term secular trends, is scanty, as the preceding summary of height trends in Europe, from which Switzerland is glaringly absent, attests. According to Swiss longitudinal growth standards (based on measurements of individuals born in the 1950s), a Swiss male attains his maximal height at the age of 19 [41–42]. (In Switzerland, new growth curves have recently been implemented. In case of length and height, the authors adopt the reliable curves from the WHO Multicenter Growth Reference Study (MGRS) and from National Center for Health Statistics (NCHS), see Braegger C, Jenni O, Konrad D, Molinari L. Neue Wachstumskurven für die Schweiz. Paediatrica. 2011;22(1):9–11.)
If self-reported height data in the 2007 Swiss Health Survey are to be taken at face value,the average height of the Swiss resident male population between the ages of 15 and 24 was 177.9 cm [43]. Rühli et al. [44] reported the simple average height of conscripts in the 2005 census (178.1 cm, N = 28,512) and performed both punctual and cross-sectional calculations for the height trend since the late 19th century. The most recent medical study concerned with the secular height trend of Swiss conscripts in Switzerland was published by Ziegler in 1966 [45] and the most recent release, by the Federal Statistical Office BFS and the Swiss Army, of aggregate results from medical examinations of conscripts, including average height, dates from 1989 [46].
Recent anthropometric studies have drawn on Swiss conscription data. Rühli et al. [44] analysed 2005 height, weight, and BMI figures, and later in the same year [47] they examined total cholesterol figures that were based on 2005 mandatory blood samples. Staub et al. [48] drew on individual conscript data to chart the changes in conscripts’ BMI distribution since the late 19th century, whereas Schoch et al. [49] drew on individual height data from Basel, Zürich, and the canton of Bern to trace the evolution of the biological standard of living over 75 years, 1875–1950. A research project, funded by the Swiss National Science Foundation at the University of Bern, culminated in a PhD thesis that featured height data derived not only from military records but also from prison and passport files [8].
The aim of this study is twofold. Firstly, to provide the first year by year analysis of individual Swiss conscript height data for the period 1992–2009 (N = 458,322), and secondly, by calculating averages and percentiles on the basis of a recent population study, to establish precise estimates of the average growth rate of Swiss men of 18 to 19 years of age. Our extensive database, comprising all extant records of national mean height values since 1878, permits us to add Switzerland, at long last, to the group of countries featured in international studies of secular height trends.
Individual height data in digital form for the conscription years 1992–2009 was provided by the Swiss Army (Logistikbasis der Armee, LBA San). As the data included both the exact date of birth of each conscript and the date of his medical examination, we were able to construct two groups defined by biological age (down to the month) for the period 1992–2009: 18 years 0 months to 18 years 12 months (N = 219,258) and 19 years 0 months to 19 years 12 months of age (N = 239,064). The sample thus comprises 458,322 individuals. For the conscription year 2009, we also computed height values for 20- and 21-year-old conscripts. Since earlier data include conscripts of 19 years of age or even younger, we included an age group of conscripts 18 and 19 years of age in addition. We excluded the few individuals whose height deviated more than ± 5 standard deviations (SD) from average (including those for whom the data were either incomplete or evidently in error: e.g., a height of 90 cm combined with a weight of 175 kg). We analysed both height averages and percentiles.
For the almost 40 conscription years 1952–1987, there exist only quinquennial and officially published average height values [46]. Prior to 1950, the individual data, in the form of medical examination control books, were stored in cantonal archives. As these individual data are so voluminous as to be impractical as a research source to compute an average height at national level, we had to rely on national average height numbers published by the Swiss Army.
Similar height averages were published by the Ministry of the Interior (Eidgenössisches Departement des Inneren, EDI) in the years 1879 (for the conscription years 1878 and 1879) [50], 1884–1891 [51] and 1914 (for the conscription years from 1908 to 1910) [52], or, by the official daily newspaper of the Social Democratic party, Volksrecht (10 September 1910, p. 2), Pittard and Dellenbach [53] and Schlaginhaufen [54–55]. Most published historical averages are those of 19-year-old conscripts. Exceptions are height values for the war years 1944 and 1945, which are based on those of 18-year-old conscripts, as the minimum conscription age had temporarily been dropped by a year due to the recruitment of a twofold census in 1939 in order to consolidate the armed forces at the beginning of the Second World War, and those for the years 1982 and 1987, which include conscripts of both 18 and 19 years of age.
All mean height values are based on measurements made in the course of the medical examination that is part of the conscription process, of all those conscripted (including those later exempted from military service), with the exception of those conscripted in 1977, for which we have a reliable random sample provided by the Swiss Army. Anthropological data for the years 1928–1932 drawn from Schlaginhaufen [54–55] complement the standard conscription data in that each annual average is derived from a different army division.
Height data from Swiss conscription records is very reliable for several reasons. Since 1875 the Swiss Army has been based on a system of involuntary conscription. The medical examination that is part of the conscription process includes the recording of standardised and unmodified anthropometric data. In 1874, in conjunction with a reorganisation of the military system, it was specified that the conscription age of all male citizens was henceforth the 19th anniversary of their birth.
The records of the medical examination procedure (a procedure that remains basically unchanged to this day) included the height, measured under medical supervision [8, 56], of every conscript, including those who subsequently received either a deferral or an exemption. Conscription now takes place throughout the country at dedicated conscription centres, where the procedure is organised and conducted according to identical qualitative standards for technical equipment as defined by Swiss Armed Forces regulations that have, of course, evolved since they were established in 1875. It has been demonstrated that during the late 19th century the conscript subpopulation and the 19-year-old male resident census subpopulation were one and the same [48–49]. Moreover, Swiss conscription data remain a useful database for population studies; for instance, the 2005 Armed Forces census represented 80% of all 19-year-old male Swiss citizens [44].
In 2009, the average height of Swiss conscripts at 19 years of age (birth year 1990, mean age 19 years and 6 months) on the day of conscription was 178.2 cm (N = 12 447), and the standard deviation (SD) was 6.52 cm. The percentiles were as follows: P5 = 168 cm, P10 = 170 cm, P25 = 174 cm, P50 = 178 cm, P75 = 182 cm, P90 = 187 cm, and P95 = 189 cm (table 1). Heights for the conscription years 2008 and 2009 (N = 28332) ranged from a minimum of 147 cm to a maximum of 208 cm (fig. 1).
Figure 1
Shifting of the height distribution of 19-year-old Swiss conscripts from 1878–79 to 2008–09 (complete conscription years).
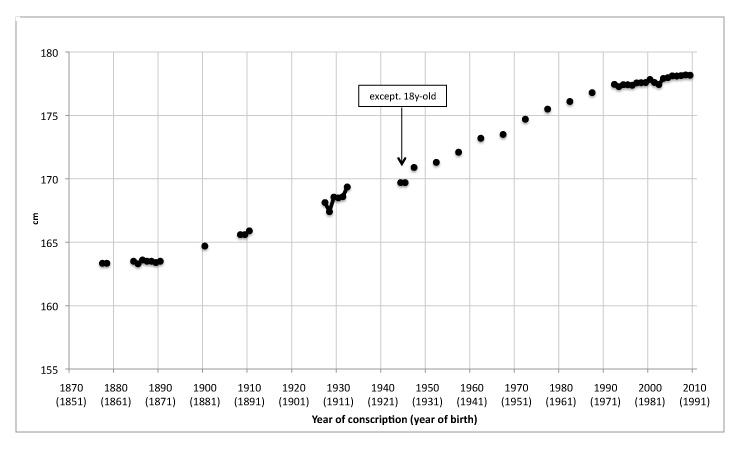
Figure 2
Evolution of the average height (cm) of 19-year-old Swiss conscripts from 1878–79 to 2009 (1992–2009: individual data, before 1992: published averages).
The average height of conscripts at 18 years of age (birth year 1991, mean age 18 years and 8 months) was 178.3 cm (N = 6309), and the SD was 6.39 cm (tables 1 and 2). In 2004, new recruitment regulations took effect, one of which provided for the option of conscription – that is voluntary early conscription – at the age of 18. These younger conscripts were on average 0.1 to 0.2 cm taller than those a year older (table 1). In 2009 the height percentiles were nearly identical, the exception being P75 = 183 and P75 = 182 cm for the younger and older groups, respectively (table 1).
In 2009 the average height of conscripts at 20 years of age – that is, whose conscription had been delayed by one year – was, the same as those who had been conscripted that year at the age of 19, 178.2 cm (N = 6893, SD = 6.54) (table 2), whereas the average height of those whose conscription had been delayed by two years was slightly lower, at 177.9 cm (N = 2279, SD = 6.54).
In Switzerland a standardised national conscription procedure was introduced in 1875 and we have been able to combine all of the average height values collected during the procedure with individual data on 19-year-old conscripts for the period 1992–2009 (fig. 2). In 1878–79the average height of 19-year-old conscripts (birth years 1859–60, N = 43 049) was 163.3 cm (distribution shown in figure 1, see also table 3). Comparing these figures with those for 2008–09 we found that the height of this age group increased by 14.9 cm over the course of this 130 year time span (fig. 1). Average height began to climb steadily in the 1890s (birth years in the 1870s), and this trend did not begin to slow down until the 1990s (birth years in the 1970s) (fig. 2). Whilst the upward trend was very slight at first (only 0.1 cm from 1878–79 to 1889), by the next decade it had increased to 2.3 cm from 1889 to 1908/10.From 1957 to 1987 the increase ranged from 1.3 cm to 2.0 cm per decade at which point it diminishes markedly, to 0.8 cm between 1987 and 1997 and then to a mere 0.6 cm between 1997 and 2007. (The 95% conference intervals of all given increases per decade in cm are between ± 0.08 and ± 0.1 cm.)
Thanks to the availability of three published documents dating from the late 19th and early 20th centuries in which the medical examination measurements have been preserved, we are able to define a shift in the x axis of the height distribution over the course of 130 years (fig. 1). In 1878-79, a paltry 5.48% of the 19-year-old conscripts were 175 cm tall or taller and only a minuscule 0.89% were at least 180 cm tall. In 2008–09, a full 71.13% of the conscripts were 175 cm tall or taller, and 41.69% were at least 180 cm tall. In summary, the upward trend at the two ends of the 130 year time period, from 1878–79 to 1891 and from 1993–94 to 2008–09, was modest, most of the increase being concentrated in the middle hundred years.
| Table 1: Average height, age, and height percentiles of individual Swiss conscript data 1992–2009. | ||||||||||||||||||
| Year | 1992 | 1993 | 1994 | 1995 | 1996 | 1997 | 1998 | 1999 | 2000 | 2001 | 2002 | 2003 | 2004 | 2005 | 2006 | 2007 | 2008 | 2009 |
| 19-year-old | ||||||||||||||||||
| Mean age (year/month) | 19/04 | 19/04 | 19/04 | 19/04 | 19/04 | 19/04 | 19/04 | 19/04 | 19/04 | 19/04 | 19/04 | 19/05 | 19/06 | 19/06 | 19/06 | 19/06 | 19/06 | 19/06 |
| N | 7125 | 12120 | 11377 | 12578 | 13033 | 13513 | 13686 | 14297 | 14549 | 13953 | 13470 | 10519 | 12375 | 15168 | 16486 | 16483 | 15885 | 12447 |
| Average (cm) | 177.5 | 177.3 | 177.4 | 177.4 | 177.4 | 177.6 | 177.6 | 177.6 | 177.8 | 177.6 | 177.4 | 177.9 | 177.9 | 178.1 | 178.1 | 178.2 | 178.2 | 178.2 |
| SD | 6.59 | 6.46 | 6.46 | 6.50 | 6.56 | 6.53 | 6.48 | 6.47 | 6.55 | 6.60 | 6.61 | 6.45 | 6.49 | 6.39 | 6.48 | 6.47 | 6.48 | 6.52 |
| 5th Percentile | 167.0 | 167.0 | 167.0 | 167.0 | 167.0 | 167.0 | 167.0 | 167.0 | 167.0 | 167.0 | 167.0 | 168.0 | 167.0 | 168.0 | 168.0 | 168.0 | 168.0 | 168.0 |
| 10th Percentile | 169.0 | 169.0 | 169.0 | 169.0 | 169.0 | 169.0 | 169.0 | 170.0 | 170.0 | 169.0 | 169.0 | 170.0 | 170.0 | 170.0 | 170.0 | 170.0 | 170.0 | 170.0 |
| 25th Percentile | 173.0 | 173.0 | 173.0 | 173.0 | 173.0 | 173.0 | 173.0 | 173.0 | 173.0 | 173.0 | 173.0 | 174.0 | 174.0 | 174.0 | 174.0 | 174.0 | 174.0 | 174.0 |
| 50th Percentile | 177.0 | 177.0 | 177.0 | 177.0 | 177.0 | 177.0 | 178.0 | 178.0 | 178.0 | 177.0 | 177.0 | 178.0 | 178.0 | 178.0 | 178.0 | 178.0 | 178.0 | 178.0 |
| 75th Percentile | 182.0 | 182.0 | 182.0 | 182.0 | 182.0 | 182.0 | 182.0 | 182.0 | 182.0 | 182.0 | 182.0 | 182.0 | 182.0 | 182.0 | 182.0 | 182.0 | 183.0 | 182.0 |
| 90th Percentile | 186.0 | 186.0 | 186.0 | 186.0 | 186.0 | 186.0 | 186.0 | 186.0 | 186.0 | 186.0 | 186.0 | 186.0 | 186.0 | 186.0 | 186.0 | 186.0 | 187.0 | 187.0 |
| 95th Percentile | 189.0 | 188.0 | 188.0 | 188.0 | 188.0 | 188.0 | 188.0 | 188.0 | 189.0 | 189.0 | 188.0 | 189.0 | 189.0 | 189.0 | 189.0 | 189.0 | 189.0 | 189.0 |
| 18-year-old | ||||||||||||||||||
| Mean age (year/month) | 18/09 | 18/09 | 18/09 | 18/09 | 18/09 | 18/09 | 18/09 | 18/09 | 18/09 | 18/08 | 18/08 | 18/09 | 18/09 | 18/09 | 18/09 | 18/08 | 18/08 | 18/08 |
| N | 5042 | 13172 | 12904 | 14351 | 14651 | 16649 | 16779 | 17694 | 18098 | 18765 | 19195 | 9869 | 6121 | 6664 | 7123 | 8208 | 7664 | 6309 |
| Average (cm) | 177.3 | 177.2 | 177.2 | 177.5 | 177.3 | 177.4 | 177.3 | 177.3 | 177.7 | 177.4 | 177.3 | 177.8 | 178.1 | 178.2 | 178.3 | 178.3 | 178.4 | 178.3 |
| SD | 6.44 | 6.52 | 6.51 | 6.51 | 6.53 | 6.55 | 6.53 | 6.54 | 6.48 | 6.48 | 6.55 | 6.50 | 6.47 | 6.40 | 6.48 | 6.51 | 6.45 | 6.39 |
| 5th Percentile | 167.0 | 167.0 | 167.0 | 167.0 | 167.0 | 167.0 | 167.0 | 167.0 | 167.0 | 167.0 | 167.0 | 167.0 | 167.0 | 168.0 | 168.0 | 168.0 | 168.0 | 168.0 |
| 10th Percentile | 169.0 | 169.0 | 169.0 | 169.0 | 169.0 | 169.0 | 169.0 | 169.0 | 170.0 | 169.0 | 169.0 | 170.0 | 170.0 | 170.0 | 170.0 | 170.0 | 170.0 | 170.0 |
| 25th Percentile | 173.0 | 173.0 | 173.0 | 173.0 | 173.0 | 173.0 | 173.0 | 173.0 | 173.0 | 173.0 | 173.0 | 173.0 | 174.0 | 174.0 | 174.0 | 174.0 | 174.0 | 174.0 |
| 50th Percentile | 177.0 | 177.0 | 177.0 | 177.0 | 177.0 | 177.0 | 177.0 | 177.0 | 178.0 | 177.0 | 177.0 | 178.0 | 178.0 | 178.0 | 178.0 | 178.0 | 178.0 | 178.0 |
| 75th Percentile | 182.0 | 182.0 | 181.0 | 182.0 | 182.0 | 182.0 | 182.0 | 182.0 | 182.0 | 182.0 | 182.0 | 182.0 | 182.0 | 182.0 | 183.0 | 183.0 | 183.0 | 183.0 |
| 90th Percentile | 186.0 | 186.0 | 185.0 | 186.0 | 186.0 | 186.0 | 186.0 | 186.0 | 186.0 | 186.0 | 186.0 | 186.0 | 186.0 | 186.0 | 187.0 | 187.0 | 187.0 | 187.0 |
| 95th Percentile | 188.0 | 188.0 | 188.0 | 188.0 | 188.0 | 188.0 | 188.0 | 188.0 | 188.0 | 188.0 | 188.0 | 189.0 | 188.7 | 189.0 | 189.0 | 189.0 | 189.0 | 189.0 |
| 18-20-y-old | ||||||||||||||||||
| N | 12167 | 25292 | 24281 | 26929 | 27684 | 30162 | 30465 | 31991 | 32647 | 32718 | 32665 | 20388 | 18496 | 21832 | 23609 | 24691 | 23549 | 18756 |
| Average (cm) | 177.4 | 177.2 | 177.3 | 177.5 | 177.4 | 177.5 | 177.4 | 177.4 | 177.7 | 177.5 | 177.4 | 177.9 | 178.0 | 178.1 | 178.2 | 178.2 | 178.3 | 178.2 |
| Table 2: Average heights for five one-year age groups (18–22 years) in the conscription year 2009 (N = 29707). | |||
| Age | Average (cm) | N | SD |
| 18-19 | 178.3 | 6309 | 6.39 |
| 19-20 | 178.2 | 12447 | 6.52 |
| 20-21 | 178.2 | 6893 | 6.54 |
| 21-22 | 177.9 | 2279 | 6.54 |
| 18-22 | 178.2 | 29707 | 6.52 |
| Table 3: Published average heights of Swiss conscripts 1878/79–1987. | |
| Year of conscription | Av. height (cm) |
| 1878/79 | 163.3 |
| 1884 | 163.5 |
| 1885 | 163.3 |
| 1886 | 163.6 |
| 1887 | 163.8 |
| 1888 | 163.5 |
| 1889 | 163.4 |
| 1890 | 163.5 |
| 1900 | 164.7 |
| 1908 | 165.2 |
| 1909 | 165.7 |
| 1927 | 168.1 |
| 1928 | 167.4 |
| 1929 | 168.6 |
| 1930 | 168.5 |
| 1931 | 168.6 |
| 1932 | 169.4 |
| 1944 | 169.7 |
| 1952 | 171.3 |
| 1957 | 172.1 |
| 1962 | 173.2 |
| 1967 | 173.5 |
| 1972 | 174.7 |
| 1977 | 175.5 |
| 1982 | 176.1 |
| 1987 | 176.8 |
The secular height trend of 19-year-olds reflects the fact that the velocity of an individual’s growth has evolved. During the 19th century, a 19-year-old had yet to achieve his maximal height [57]. Our modern data indicate that 20- and 21-year-olds were no taller, on average, than the average 19-year-old measured in 2009. However, since the secular height trend is reflected in the average heights (female as well as male) derived from Swiss passport applications and prison records since the late 19th century, it is evident that a faster individual growth tempo alone does not entirely explain the secular height trend [8]. What is more, the average height of conscripts who were 18 years of age (since 2004), when they were measured, is slightly greater than that of the conscripts who were one year older. The fact that (on account of the 2004 change in the conscription regulations permitting conscription at the age of 18), these 18-year-olds had volunteered for early conscription goes far to explain this discrepancy, since their readiness to serve suggests that their physical development was more advanced than that of the conscripts who opted otherwise.
However, the secular height trend remains to be satisfactorily explained. Changes at the genetic level are of minor consequence [58]. Possible primary causes include a complex cluster of improvements in the standard of living, chiefly nutritional [for the milk hypothesis see 59], but also in regard to hygiene and the disease environment, not to mention a decrease in the physical workload, particularly during childhood [3, 5, 6, 34, 60]. Other contributing factors are found in positive assortative pair mating and epigenetics [9, 61]. Average height usually increases in tandem with improvements in other economic and biological measures of the standard of living (GDP per capita, real wages, life expectancy, infant mortality). This cluster of factors, however, does help to explain the secular height trend in Switzerland [8, 49].
The secular height trend in Switzerland soared during the two decades between the First and Second World Wars, largely due to the prescription of iodine as an incipient goitre prophylaxis, Vitamin D as a rickets prophylaxis, and major improvements to the social welfare system, including intensified meal and holiday programmes for needy children [8]. Even when international comparison of average height levels is hindered by differences among military conscription systems, it is safe to safe that average height in Switzerland, in the second half of the 19th century at the low level of southern Europe, caught up with that of France and Belgium on the eve of the First World War, which was roughly equivalent to average height in Central European countries today [12, 34, 36]. This fits surprisingly well with findings on material standard of living, when real wages were substantially lower in Switzerland than in other European countries, including Southern Europe, until the 1870s, then caught up during the globalisation process and conversed with the level of France or Belgium at the eve of First World War [62].
Another phenomenon that remains to be satisfactorily explained is the slowdown since the 1990s in Switzerland’s height-increase trend (which has its parallel in Northern as well as elsewhere in Central Europe),together withan increasing delay in the of age of menarche [9]. At this stage, it is not clear whether this trend is short term or whether, due to the stable environment of Central and Northern European countries, the genetic endpoint of the population has been reached, at a mean level of 178–180 cm [9, 34]. The fact that US heights reached a plateau toward the middle of the 20th century, despite an increase in the average income level, is explained by the inadequacy of the social safety net (including the health care system), the poor quality of nutrition and social inequality [38, 63]. It is also correlated with the obesity epidemic [37, 64–66]. Whether – and if so, then to what degree – similar phenomena could play a role in the height trend slowdown and the obesity epidemic, 30 to 40 years later, in Switzerland [48] is an issue worth examining. Another potential explanation is the influence of structural change, such as the “1950s Syndrome”, the end of the so-called golden age between the late 1950s and the “oil price shock” of 1973 [67]. A Vitamin D deficiency causing height differences [68], could also account for the fact that the upward secular height trend in northern and western regions of Europe has reached a plateau [69–71].
1 Bogin B. Patterns of human growth. 2nd ed. Cambridge: Cambridge University Press, 1999.
2 Eveleth PB, Tanner JM. Worldwide variation in human growth. 2nd ed. Cambridge <etc.>: Cambridge University Press, 1990.
3 Cole TJ. The secular trend in human physical growth: a biological view. Econ Hum Biol. 2003;1(2):161–8.
4 Federico G. Heights, calories and welfare: a new perspective on Italian industrialization, 1854–1913. Econ Hum Biol. 2003;1(3):289–308.
5 Komlos J. Anthropometric history: an overview of a quarter century of research. Anthropol Anz. 2009;67(4):341–56.
6 Steckel RH. Heights and human welfare: Recent developments and new directions. Explorations in Economic History. 2009;46(1):1–23.
7 Nabholz A. Die Ergebnisse der ärztlichen Rekruten-Untersuchungen im Kanton Glarus 1884–1903. Glarus, 1904.
8 Staub K. Der biologische Lebensstandard in der Schweiz seit 1800. Historisch-anthropometrische Untersuchung der Körperhöhe (und des Körpergewichts in der Schweiz seit 1800, differenziert nach Geschlecht, sozioökonomischem und regionalem Hintergrund. PhD-Thesis, University of Bern, Bern, 2010.
9 Gohlke B, Woelfle J. Growth and puberty in German children: is there still a positive secular trend? Dtsch Arztebl Int. 2009;106(23):377–82.
10 Karlberg J. Secular trends in pubertal development. Horm Res. 2002;57(Suppl 2):19–30.
11 Cole TJ. Secular trends in growth. Proc Nutr Soc. 2000;59(2):317–24.
12 Hatton TJ, Bray BE. Long run trends in the heights of European men, 19th–20th centuries. Econ Hum Biol. 2010;8(3):405–13.
13 Steckel RH. Health and nutrition in the pre-industrial era: Insights from a millennium of average heights in Northern Europe. In: Allen RC, Bengtsson T, Dribe M, editors. Living standards in the past. New perspectives on well-being in Asia and Europe. Oxford: Oxford University Press, 2005:227–53.
14 Floud R. The heights of Europeans since 1750: A new source for European economic history. In: Komlos J, editor. Stature, living standards and economic development. Essays in anthropometric history. Chicago, London, 1994:9–24.
15 Bopp M, Faeh D. End-digits preference for self-reported height depends on language. BMC Public Health. 2008;8:342.
16 Danubio ME, Miranda G, Vinciguerra MG, Vecchi E, Rufo F. Comparison of self-reported and measured height and weight: implications for obesity research among young adults. Econ Hum Biol. 2008;6(1):181–90.
17 Le Roy Ladurie E, Bernageau N. Étude sur un contingent militaire (1868): Mobilité géographique délinquance et stature, mises en rapport avec d’autres aspects de la situation des conscripts. Annales de Démographie Historique. 1971:311–37.
18 Weir DR. Economic welfare and physical well-being in France, 1750–1990. In: Steckel RH, Floud R, editors. Health and welfare during industrialization. Chicago: University of Chicago Press, 1997:161–200.
19 van Meerten MA. Dévelopment économique et stature en France XIXe-XXe siècles. Annales Economies Sociétés Civilisations. 1990;45(3):755–78.
20 Heyberger L. La révolution des corps: décroissance et croissance staturale des habitants des villes et des campagnes en France, 1780–1940. Strasbourg: Presses Universitaires de Strasbourg, 2005.
21 Heyberger L. Toward an anthropometric history of provincial France, 1780–1920. Econ Hum Biol. 2007;5(2):229–54.
22 Twarog S. Heights and living standards in Germany, 1850–1939: The case of Württemberg. In: Steckel RH, Floud R, editors. Health and welfare during industrialization. Chicago: University of Chicago Press, 1997:285–330.
23 Baten J. Ernährung und wirtschaftliche Entwicklung in Bayern: (1730–1880) [Zugl: Diss Univ München, 1997]. Komm. Franz Steiner Verlag, 1999.
24 Komlos J, Kriwy P. Social status and adult heights in the two Germanies. Ann Hum Biol. 2002;29(6):641–8.
25 Komlos J. Stature and nutrition in the Habsburg monarchy: the standard of living and economic development in the eighteenth century. Am Hist Rev. 1985;90(5):1149–61.
26 Komlos J. Anthropometric evidence on economic growth, biological well-being and regional convergence in the Habsburg Monarchy, c. 1850–1910. Cliometrica. 2007;1:211–37.
27 Weber G, Seidler H, Wilfing H, Hauser G. Secular change in height in Austria: an effect of population stratification? Ann Hum Biol. 1995;22(4):277–88.
28 Seidler H. Variations in body height in 18-year-old males in Austria. Anthropol Anz. 1986;44(3):189–213.
29 Jaeger U, Zellner K, Kromeyer-Hauschild K, Ludde R, Eisele R, Hebebrand J. Body height, body weight and body mass index of German military recruits. Historical retrospect and current status. Anthropol Anz. 2001;59(3):251–73.
30 Hermanussen M, Burmeister J, Burkhardt V. Stature and stature distribution in recent West German and historic samples of Italian and Dutch conscripts. Am J Hum Biol. 1995;7:507–15.
31 Deaton A. Height, health, and development. Proc Natl Acad Sci. U S A 2007;104(33):13232–7.
32 Garcia J, Quintana-Domeque C. The evolution of adult height in Europe: a brief note. Econ Hum Biol. 2007;5(2):340–9.
33 Schmidt IM, Jorgensen MH, Michaelsen KF. Height of conscripts in Europe: is postneonatal mortality a predictor? Ann Hum Biol. 1995;22(1):57–67.
34 Larnkaer A, Attrup Schroder S, Schmidt IM, Horby Jorgensen M, Fleischer Michaelsen K. Secular change in adult stature has come to a halt in northern Europe and Italy. Acta Paediatr. 2006;95(6):754–5.
35 Susanne C, Bodzsar E, Bielicki T, Hauspie R, Hulanicka B, Lepage Y, et al. Changements séculaires de la croissance et du dévelopement en Europe. Antropo. 2001;0:71–90.
36 Danubio ME, Sanna E. Secular changes in human biological variables in Western countries: an updated review and synthesis. J Anthropol Sci. 2008;86:91–112.
37 Komlos J, Baur M. From the tallest to (one of) the fattest: the enigmatic fate of the American population in the 20th century. Econ Hum Biol. 2004;2(1):57–74.
38 Komlos J, Lauderdale BE. The mysterious trend in American heights in the 20th century. Ann Hum Biol. 2007;34(2):206–15.
39 Hermanussen M. Die Körperhöhe deutscher Wehrpflichtiger vor und nach der deutschen Wiedervereinigung. Medwelt. 1995;46:395–6.
40 Kriwy P, Komlos J, Bauer M. Soziale Schicht und Körperhöhe in Ost- und Westdeutschland. Kölner Zeitschrift für Soziologie und Sozialpsychologie. 2003;55(3):543–56.
41 Prader A, Largo RH, Molinari L, Issler C. Physical growth of Swiss children from birth to 20 years of age. First Zurich longitudinal study of growth and development. Helv Paediatr Acta Suppl. 1989;52:1–125.
42 Exner GU. Normalwerte in Wachstum und Entwicklung: die Basis für Diagnostik und Therapie / 29 Tabellen. 2., vollst. überarb. und aktualisierte Aufl. ed. Stuttgart: Georg Thieme, 2003.
43 Schweiz. Bundesamt für Statistik. Schweizerische Gesundheitsbefragung 2007 [Elektronische Daten]: Standardtabellen = Enquête suisse sur la santé 2007 = Indagine sulla salute in Svizzera 2007. Neuchâtel: Schweizerische Eidgenossenschaft, Bundesamt für Statistik BFS, 2009.
44 Rühli F, Henneberg M, Woitek U. Variability of height, weight and body mass index in a Swiss Armed Forces 2005 census. Am J Phys Anthropol. 2008;137(4):457–68.
45 Ziegler E. The cause of accelerated growth. Observations in the fields of nutritional physiology and medical history on sugar consumption in modern man. Helv Paediatr Acta. 1966;21(1):(Suppl 15):1–95.
46 Schweiz. Bundesamt für Statistik. Aushebung: schulische und berufliche Ausbildung sowie körperliche Leistungsfähigkeit von Stellungspflichtigen und MFD-Anwärterinnen = Recrutement: la formation scolaire et professionnelle et les aptitudes physiques des conscrits et des candidates au SFA. Neuchâtel: Schweizerische Eidgenossenschaft, Bundesamt für Statistik BFS, 1989.
47 Rühli FJ, Henneberg M, Schaer DJ, Imhof A, Schleiffenbaum B, Woitek U. Determinants of inter-individual cholesterol level variation in an unbiased young male sample. Swiss Med Wkly. 2008;138(19-20):286–91.
48 Staub K, Rühli FJ, Woitek U, Pfister C. BMI distribution/social stratification in Swiss conscripts from 1875 to present. Eur J Clin Nutr. 2010;64(4):335–40.
49 Schoch T, Staub K, Pfister C. Social inequality, the biological standard of living, and body shapes. An analysis of Swiss conscription data 1875–1950. Econ Hum Biol. 2011;May 11 (Epub ahead of print).
50 Schweiz. Statistisches Bureau. Mittheilungen betreffend die ärztlichen Untersuchungen (der Wehrpflichtigen) bei der Rekrutirung für die Jahre 1878 und 1879 = Rapport concernant la visite sanitaire passée lors du recrutement pour les arrnées 1878 et 1879. Bern, 1879.
51 Schweiz. Statistisches Bureau. Resultate der aerztlichen Rekrutenuntersuchung im Herbste 1884–1891. Schweizerische Statistik 1884–1891;62, 65, 68, 72, 77, 81, 85, 96.
52 Schweiz. Statistisches Amt. Graphisch-statistischer Atlas der Schweiz / Atlas graphique et statistique de la Suisse publ. par le Bureau de statistique du Département fédéral de l’intérieur. Bern: Kümmerly und Frey, 1914.
53 Pittard E, Lobsiger-Dellenbach M. L’augmentation de la stature en Suisse au cours de 25 ans. Berne: Stämpfli & Cie, 1931.
54 Schlaginhaufen O. Aus den Ergebnissen der anthropologischen Untersuchungen an den schweizerischen Stellungspflichtigen. Zürich: Orell Füssli, 1946.
55 Schlaginhaufen O. Anthropologia Helvetica: Ergebnisse anthropologischer Untersuchungen an den schweizerischen Stellungspflichtigen. Zürich: Orell Füssli, 1946.
56 Kurz HR. Geschichte der Schweizer Armee. Frauenfeld: Huber, 1985.
57 Tanner JM. A history of the study of human growth. Cambridge [etc]: Cambridge University Press, 1981.
58 McEvoy BP, Visscher PM. Genetics of human height. Econ Hum Biol. 2009;7(3):294–306.
59 Hoppe C, Mølgaard C, Michaelsen KF. Cow’s milk and linear growth in industrialized and developing countries. Annu Rev Nutr. 2006;26:131–73.
60 Steckel RH. Stature and the standard of living. Journal of Economic Literature 1995;33(4):1903–40.
61 Herpin N. Love, careers, and heights in France, 2001. Econ Hum Biol. 2005(3):420–49.
62 Studer R. When did the Swiss get so rich? Comparing living standards in Switzerland and Europe, 1800–1913. J Eur Economic History. 2008;37(2):405–51.
63 Komlos J. Stagnation of heights among second-generation U.S.-Born Army personnel. Social Science Quarterly. 2008;89(2):445–55.
64 Komlos J, Brabec M. The trend of mean BMI values of US adults, birth cohorts 1882–1986 indicates that the obesity epidemic began earlier than hitherto thought. Am J Hum Biol. 2010;22(5):631–8.
65 Komlos J, Breitfelder A. Are Americans shorter (partly) because they are fatter? A comparison of US and Dutch children’s height and BMI values. Ann Hum Biol. 2007;34(6):593–606.
66 Komlos J, Breitfelder A, Sunder M. The transition to post-industrial BMI values among US children. Am J Hum Biol. 2009;21(2):151–60.
67 Pfister C. The “1950s syndrome” and the transition from a slow-going to a rapid loss of global sustainability. In: Uekoetter F, editor. The Turning Points of Environmental History. Pittsburgh: Univ of Pittsburgh, 2010:90–118.
68 Kremer R, Campbell PP, Reinhardt T, Gilsanz V. Vitamin D status and its relationship to body fat, final height, and peak bone mass in young women. J Clin Endocrinol Metab. 2009;94(1):67–73.
69 Holick MF. Vitamin D deficiency. N Engl J Med. 2007;357(3):266–81.
70 Holick MF. The vitamin D epidemic and its health consequences. J Nutr. 2005;135(11):2739S–48S.
71 Ginde AA, Liu MC, Camargo CA, Jr. Demographic differences and trends of vitamin D insufficiency in the US population, 1988–2004. Arch Intern Med. 2009;169(6):626–32.
Acknowledgements: The authors wish to thank the Swiss Army (LBA San; Oberfeldarzt Divisionär Dr. med. A. Stettbacher, Dr. med. F. Frey, Dr. med. R. v. Vigier and Dr. med. P. Javet) for providing the individual data 1992–2009 and for assistance. J. Smith copyedited the manuscript. We also wish to thank Tobias Schoch for helpful comments.
Funding / potential competing interests: From 2005 through 2008, K. Staub and C. Pfister received financial support from the Swiss National Science Foundation (Project No. 109802) and the Swiss Foundation for Nutrition Research. Since 2010, F. Rühli, and K. Staub have received financial support from the Mäxi Foundation.