Figure 1
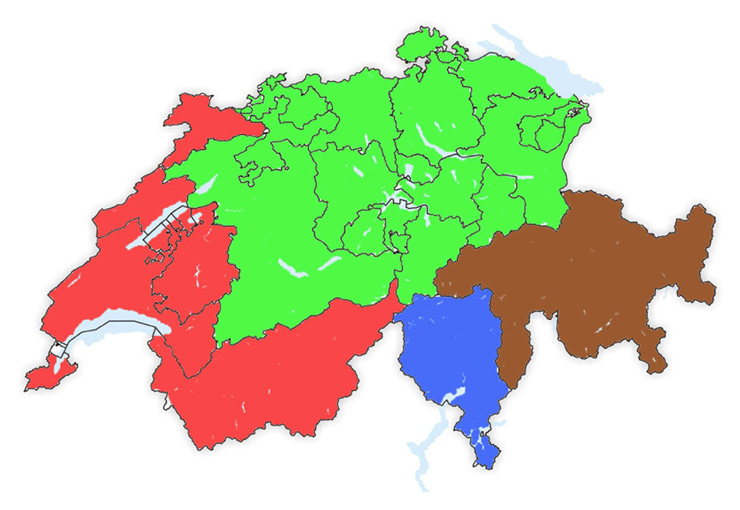
Distribution of Switzerland into four cultural / language groups (Green = German speaking, Red = French speaking, Blue = Italian speaking, Brown = Canton of Grisons / Romansh speaking part).
DOI: https://doi.org/10.4414/smw.2011.13218
The association between haemoglobin (Hb) A1c levels and the risk for the development of diabetes-mellitus-related complications is well established. The European Prospective Investigation of Cancer and Nutrition (EPIC-Norfolk) cohort study has shown that an increase of 1% in HbA1c was associated with a 40% increased risk of coronary heart disease (16% of cardiovascular disease, and 30% of all-cause mortality) after adjustment for other risk factors [1]. Therapeutic interventions leading to better control of hyperglycaemia and HbA1c levels in patients with type 2 diabetes mellitus have resulted in a significant decline in micro- and macro-vascular complications [2–5]. Epidemiological and interventional studies have led to the current treatment recommendations for patients with type 2 diabetes mellitus, targeting HbA1c levels of 7% and below [6, 7]. However, despite these recommendations, a majority of patients still do not achieve such target HbA1c levels in general practice [8, 9].
A goal of current research is to identify factors that negatively influence the feasibility and practicability of these targets in daily clinical practice, in specialised diabetes clinics and in primary health care, where the vast majority of patients with type 2 diabetes are taken care of.
Treatment of type 2 diabetes mellitus, including the level of glycaemic control as well as the type of anti-hyperglycaemic medication used, differs significantly between European countries [8, 10, 11]. Switzerland consists of four major cultural regions, namely the German, French, Italian speaking parts and the canton of Grisons which represents the Romansh speaking population, each of them being linked to their neighbouring European country. However, treatment recommendations and goals for glycaemic control and HbA1c levels have been defined nationwide by the Swiss Society of Endocrinology and Diabetology (SGED) [12], and Switzerland represents a common economic, social, educational and health care system. Therefore, we were particularly interested to compare contemporary diabetes care between the four cultural regions of the country.
The study design included a cross-sectional as well as a retrospective survey to investigate the quality of glycaemic control, current diabetes practice and its relationship to cardiovascular parameters in patients treated for type 2 diabetes mellitus in general practice.
Figure 1
Distribution of Switzerland into four cultural / language groups (Green = German speaking, Red = French speaking, Blue = Italian speaking, Brown = Canton of Grisons / Romansh speaking part).
General practitioners (GPs) from Switzerland participated in the study “Quality of Glycaemic Control and Progression of Obesity in Patients with Type 2 Diabetes in Private Practice in Switzerland (POIDS)” and enrolled consecutive patients treated for type 2 diabetes mellitus between November 3rd and November 7th, 2008.
For data analysis across different language regions, Switzerland was divided into the four cultural regions by location of the GPs’ offices: the German, French and Italian speaking parts of Switzerland, and the fourth group from the canton of Grisons. This represents Switzerland’s fourth language region (the Romansh speaking part), and most of this area represents a more rural and mountainous area with a more difficult accessibility for the health care system (fig. 1).
Based on a power calculation to detect a difference in HbA1c of 0.5% (estimated standard deviation 1.5%) and taking into consideration the unequal distribution of the population among the different cultural regions of Switzerland, we formed twelve units (7 German, 3 French, 1 Italian speaking as well as 1 for the Canton of Grisons) with a similar number of 20 practicing physicians per unit (240 in total). Physicians were randomly selected out of a complete list of all practicing physicians from a centralised national register and invited to participate in the study. This revealed a power of the study to detect the above mentioned differences in outcome ranging from 60% (smallest regions) to 95% (largest regions).
Patients treated for type 2 diabetes mellitus (including patients treated with insulin, oral anti-hyperglycaemic drugs, and changes in lifestyle or diet only) were included if they were at least 18 years old and visited the GP within the screening week period, independently of the reason for their visit. Patients with type 1 or untreated type 2 diabetes mellitus and those unable to sign the informed consent were excluded. Ethics committee approvals were obtained according to local regulations.
Anonymous data on patient actual HbA1c, fasting blood glucose (FBG), body weight and blood pressure, standard laboratory parameters including lipid profile and serum creatinine, as well as current anti-diabetic medication (cross-sectional survey), were recorded directly by the treating physician into a standardised case report form (CRF). If not available in the records, low-density lipoprotein (LDL) cholesterol was calculated by the Friedewald Formula [13]. Similar data from the earlier time point when diabetes therapy was initiated were also recorded (retrospective survey obtained from data written in the patient’s chart). Data management and data-base entry was performed by an independent data coordinating centre (PFC Pharma Focus AG, Zurich, Switzerland). Population data of Switzerland was obtained from the Swiss Federal Statistical Office (Bern).
Continuous variables with a normal distribution were described as means with standard deviations (SD) and group comparisons were performed with the Mann-Whitney Test. Discrete variables are presented as frequencies and percentages and group comparisons were performed using the Chi-square Test. To compare changes of variables over time, for continuous variables the Wilcoxon signed-rank Test and for discrete variables the McNemar Test were used. The analysis comparing different regions was performed by one-way ANOVA with subsequent application of a generalised linear model (multiple linear regression) controlling for the factor of gender and the covariate of therapy duration. Data were analysed using SPSS Statistics 18.0 software (SPSS Inc.).
For the main comparison of measured parameters between the different regions, a p-value <0.01 was considered significant (Bonferroni correction applied) and a p-value <0.001 was considered highly significant.
The project was funded by sanofi-aventis (suisse) sa, Meyrin, Switzerland. Data collection, data management and analysis were independent from the sponsor.
In total, 1121 patients were enrolled into the study between November 3rd and November 7th, 2008. A total of 134 physicians participated in the study, and the enrolment rate was 8.4 ± 4.3 patients per physician. The mean age of the patients was 66.1 ± 12.0 years, and 626 (55.8%) were male (table 1).
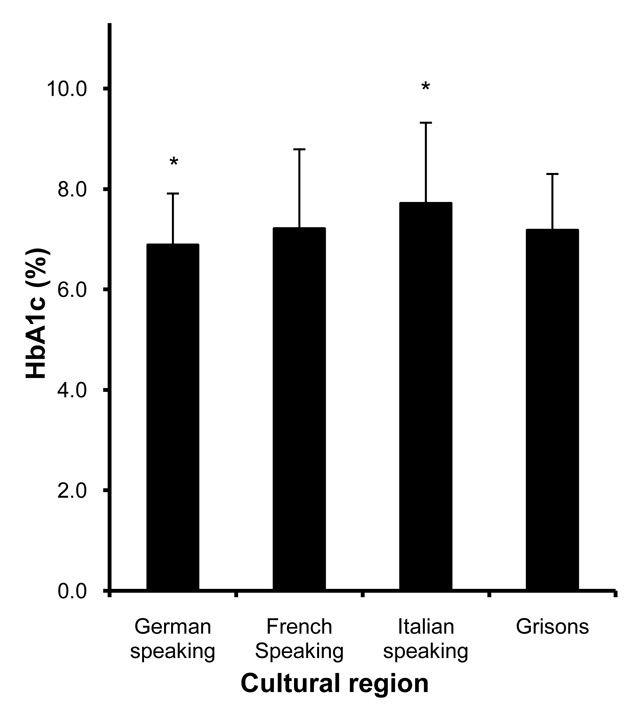
Figure 2
HbA1c measurements at the time of the survey in different cultural regions of Switzerland. * indicates regions in which HbA1c measurements differed from the other regions, p <0.001.
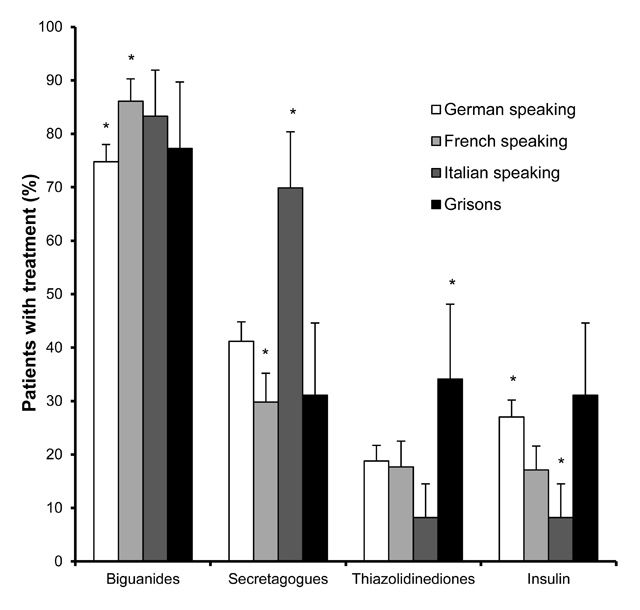
Figure 3
Diabetes therapy with different anti-hyperglycaemic drugs at the time of the survey in different cultural regions of Switzerland. * indicates regions in which therapy differed from the other regions, p <0.01.
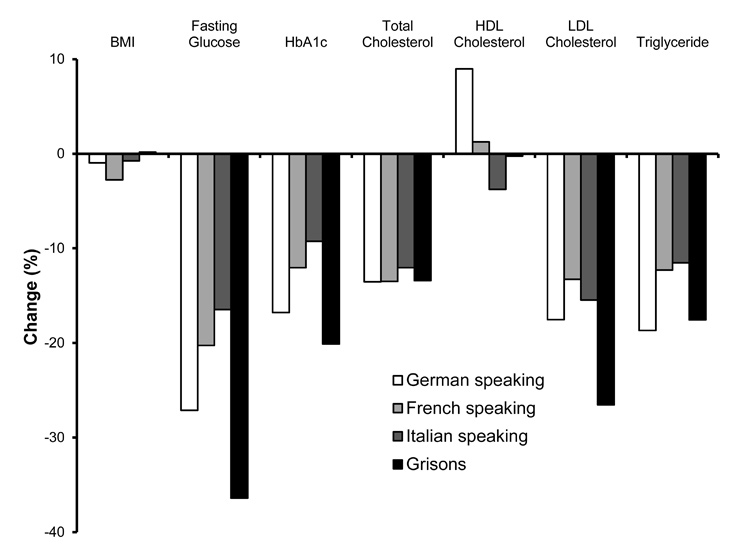
Figure 4
Changes (%) in BMI, fasting glucose, HbA1c and serum lipids at the time of the survey compared to the retrospective survey, in different cultural regions of Switzerland.
Fasting glucose, HbA1c, serum creatinine and serum lipids, as well as body mass index (BMI) and blood pressure at the time when diabetes therapy was started are shown in table 2, and the same parameters at the time of the current survey are shown in table 3. As not every measurement was done in all patients, the number of available measurements is reported for every parameter as n in the tables. Overall, glucose control improved throughout the course of diabetes therapy. HbA1c decreased from 8.28 ± 2.01% to 7.03 ± 1.24% and fasting glucose decreased from 9.97 ± 3.86 mmol/l to 7.52 ± 2.23 mmol/l (p <0.001 for both parameters). Serum lipids also ameliorated: Total cholesterol, LDL cholesterol and triglycerides were lowered, whereas high-density lipoprotein (HDL) cholesterol levels increased (p <0.001 for all parameters). Systolic and diastolic blood pressure were lower at the time of the current survey compared to the start of diabetes therapy (p <0.001 for both parameters). At the same time, BMI decreased from 30.2 ± 5.5 kg/m2 to 29.8 ± 5.6 kg/m2 (p <0.001), while serum creatinine increased (p <0.001).
Anti-hyperglycaemic medical therapy recorded at the start of treatment and at the time of the cross-sectional survey is summarised in tables 2 and 3. During the treatment period, the proportion of patients treated with at least one anti-diabetic medication increased from 92.1 to 98.7%, and of those receiving insulin from 5.7 to 23.6%. Treatment with more than one anti-hyperglycaemic drug class increased from 23.7 to 54.3% during the course of therapy with 42.1% of the patients being treated with a combination of 2, 11.6% with a combination of 3 and 0.6% with a combination of 4 different anti-hyperglycaemic medications. Among the patients treated with insulin at the time of the current survey, 75.2% had at least one additional oral anti-hyperglycaemic agent.
Region-specific patient characteristics at the beginning of anti-hyperglycaemic treatment are shown in table 1. There was no significant difference in age between the regional groups at the beginning of diabetes therapy. In the Italian speaking part of Switzerland, the proportion of male patients was significantly higher than in the other regions (69.9% vs. 54.9%, p <0.01). The duration of treatment was longer in the German speaking (5.9 ± 5.3 y) and shorter in the French speaking part of Switzerland (4.7 ± 4.5 y) as well as in the canton of Grisons (3.4 ± 2.9 y) compared to other regions. Therefore, all further analyses were done with an adjustment for gender and therapy duration usimg a generalised linear model.
At the start of diabetes treatment, fasting glucose was higher in the canton of Grisons (11.8 ± 4.4 mmol/l, p <0.001) compared to the other regions. However, HbA1c levels did not significantly differ between the regions (table 2). At the time of the survey, fasting glucose and HbA1c were higher (9.0 ± 2.5 mmol/l and 7.7 ± 1.6%, respectively, p <0.001) in the Italian speaking part of Switzerland, whereas in patients from the German speaking part, both these parameters were lower (7.3 ± 2.0 mmol/l and 6.9 ± 1.0%, respectively, p <0.001) than in the other regions (fig. 2, table 3).
The use of anti-hyperglycaemic drugs also differed between regions. At the start of diabetes treatment, insulin secretagogues (sulfonylureas and meglitinides) were more often used in the Italian speaking part of Switzerland than in other regions (57.5%, p <0.01). This difference was also apparent at the time of survey (69.9%), when these substances were less often used in the French speaking part (29.8%, p <0.01). In contrast, the use of biguanides (metformin) was highest in the French speaking part of Switzerland (86.1%), and lowest in the German speaking part (74.8%, p <0.01). The use of thiazolidinedions was higher in the canton of Grisons compared to the other regions (34.1%, p <0.01). Insulin was used significantly more often in the German speaking part of Switzerland (27.0%) and less often in the Italian speaking part (8.2%, p <0.01) (fig. 3, table 3).
There was no significant difference in total cholesterol, HDL cholesterol or LDL cholesterol between the cultural regions at the start of anti-diabetic treatment and at the time of survey. In contrast, triglyceride levels were lower in the French speaking part of Switzerland at both time points (2.16 ± 1.28 mmol/l, 1.90 ± 1.08 mmol/l) and higher in the canton of Grisons at the time of survey (2.81 ± 1.86 mmol/l, p <0.01). These were differences that persisted when adjusted for insulin treatment.
Small differences in serum creatinine and blood pressure were present at the start of anti-diabetic therapy between the different regions, but did not last until the time of survey.
Patients in the German speaking part of Switzerland were somewhat leaner at the beginning of anti-diabetic therapy (BMI 29.7 ± 5.3 kg/m2), and patients in the French speaking part had a higher BMI (31.2 ± 6.0 kg/m2), but these were differences that did not persist during study enrolment. A significant reduction in BMI was seen in both the German and French speaking parts of Switzerland between the time of therapy initiation and the time of the survey (–0.3 and –0.9 kg/m2, respectively, p <0.001). Region specific changes in BMI as well as in parameters of glucose and lipid metabolism are shown in figure 4.
There was no direct correlation between the change in glycaemic control (HbA1c) and change in BMI between initiation of therapy and current survey.
However, insulin therapy at the current survey was associated with a significantly larger improvement of HbA1c (–1.66 ± 2.33% with insulin, and –1.15 ± 1.91% without insulin therapy; p = 0.001), compared to the start of anti-diabetic therapy. Similarly, when comparing only patients newly treated with insulin at the time of the current survey (without insulin at the start of diabetes therapy) with those never receiving insulin, there was a significant difference in HbA1c improvement (–1.57 ± 2.30% vs. –1.13 ± 1.85%; p = 0.03). At the same time, BMI decreased by 0.63 ± 2.60 kg/m2 without insulin, and increased by 0.36 ± 2.92 kg/m2 with insulin therapy (p <0.001).
| Table 1: Demographic characteristics. | |||||
| Patient characteristic | Whole patient population | German speaking region | French speaking region | Italian speaking region | Grisons |
| Whole population of the region (2008), n (%) | 7701856 (100) | 5500323 (71.4) | 1678338 (21.8) | 332736 (4.3) | 190459 (2.5) |
| Number of patients, n (%) | 1121 (100) | 731 (65.2) | 272 (24.3) | 73 (6.5) | 45 (4.0) |
| Number of physicians, n (%) | 134 (100) | 86 (64.2) | 37 (27.6) | 7 (5.2) | 4 (3.0) |
| Patients per physician (no ± SD) | 8.4 ± 4.3 | 8.5 ± 4.8 | 7.3 ± 2.9 | 10.4 ± 2.4 | 11.3 ± 3.9 |
| Age (at start of therapy) (yrs ± SD) | 60.5 ± 11.7 | 60.9 ± 11.2 | 59.7 ± 12.8 | 60.5 ± 12.2 | 59.8 ± 12.3 |
| Duration of diabetes treatment (yrs ± SD) | 5.5 ± 5.1 | 5.9 ± 5.3 * | 4.7 ± 4.5 * | 5.5 ± 5.1 | 3.4 ± 2.9 * |
| Male gender (%) | 55.8 (52.9–58.7) | 54.6 (51.0–58.2) | 55.5 (49.6–61.4) | 69.9 (59.4–80.4) * | 55.6 (41.1–70.1) |
| Basic characteristics of treating physicians and patients belonging to the four cultural regions of Switzerland Mean ± SD or % (95% CI) (* parameter differs from other regions p <0.01). | |||||
| Table 2: Retrospective survey. | ||||||
| Parameter | Whole collective | German s. | French s. | Italian s. | Grisons | N |
| Metabolic parameters | ||||||
| Fasting glucose (mmol/l) | 9.97 ± 3.86 | 9.81 ± 3.82 | 9.78 ± 3.85 | 10.81 ± 3.46 | 11.83 ± 4.43 ** | 959 |
| HbA1c (%) | 8.28 ± 2.01 | 8.20 ± 1.93 | 8.27 ± 2.13 | 8.51 ± 2.01 | 8.97 ± 2.30 | 904 |
| Creatinine (µmol/l) | 82.2 ± 23.4 | 80.4 ± 22.0 * | 84.9 ± 23.3 | 85.4 ± 20.5 | 85.3 ± 39.2 | 893 |
| Total cholesterol (mmol/l) | 5.75 ± 1.27 | 5.77 ± 1.31 | 5.71 ± 1.18 | 5.67 ± 1.33 | 5.81 ± 1.12 | 941 |
| HDL cholesterol (mmol/l) | 1.20 ± 0.40 | 1.19 ± 0.41 | 1.26 ± 0.40 | 1.16 ± 0.32 | 1.10 ± 0.30 | 801 |
| LDL cholesterol (mmol/l) | 3.40 ± 1.13 | 3.37 ± 1.11 | 3.46 ± 1.19 | 3.45 ± 1.12 | 3.39 ± 0.91 | 793 |
| Triglycerides (mmol/l) | 2.46 ± 1.69 | 2.54 ± 1.83 | 2.16 ± 1.28 * | 2.59 ± 1.42 | 3.22 ± 1.88 | 850 |
| Blood pressure and BMI | ||||||
| Systolic blood pressure (mm Hg) | 144.1 ± 17.9 | 143.9 ± 18.3 | 146.4 ± 18.0 * | 140.9 ± 14.5 | 139.4 ± 13.7 | 1051 |
| Diastolic blood pressure (mm Hg) | 86.5 ± 10.2 | 86.7 ± 10.4 | 86.5 ± 10.2 | 86.7 ± 9.1 | 82.2 ± 6.1 * | 1052 |
| Body mass index (kg/m2) | 30.2 ± 5.5 | 29.7 ± 5.3 ** | 31.2 ± 6.0 ** | 30.1 ± 5.6 | 31.1 ± 4.7 | 1057 |
| Diabetes treatment | ||||||
| Biguanides (%) | 72.1 (69.4–74.8) | 71.1 (67.7–74.5) | 75.7 (70.5–80.9) | 68.5 (57.8–79.2) | 72.1 (58.7–85.5) | 1077 |
| Insulin secretagogues, total (%) | 38.7 (35.7–41.7) | 40.1 (36.4–43.8) | 31.0 (25.2–36.8) | 57.5 (46.2–68.8) * | 27.9 (14.5–41.3) | 1033 |
| Thiazolidinediones (%) | 5.3 (3.9–6.7) | 5.1 (3.4–6.8) | 5.4 (2.6–8.2) | 4.2 (0–8.8) | 9.3 (0.6–18.0) | 1018 |
| Insulin (%) | 5.7 (4.3–7.1) | 4.9 (3.3–6.5) | 8.7 (5.3–12.1) | 2.8 (0–6.6) | 4.7 (0–11.0) | 1069 |
| Other (%) | 2.7 (1.7–3.7) | 2.7 (1.5–3.9) | 3.9 (1.4–6.4) | 1007 | ||
| Metabolic parameters blood pressure and BMI (Mean ± SD) as well as diabetes related medication (% 95% CI) of the patients at the start of anti-diabetic treatment (retrospective survey). N indicates the number of patients with this parameter available. (parameter differs from other regions * p <0.01, ** p <0.001). | ||||||
| Table 3: Current survey. | ||||||
| Parameter | Whole collective | German s. | French s. | Italian s. | Grisons | N |
| Metabolic parameters | ||||||
| Fasting glucose (mmol/l) | 7.52 ± 2.23 | 7.25 ± 2.02 ** | 7.79 ± 2.40 | 9.03 ± 2.49 ** | 7.83 ± 2.77 | 1064 |
| HbA1c DCCT (%) | 7.03 ± 1.24 | 6.89 ± 1.02 ** | 7.21 ± 1.58 | 7.72 ± 1.60 ** | 7.18 ± 1.12 | 1071 |
| Creatinine (µmol/l) | 86.4 ± 27.5 | 86.6 ± 28.1 | 87.2 ± 26.5 | 83.5 ± 20.3 | 83.1 ± 33.1 | 999 |
| Total cholesterol (mmol/l) | 4.97 ± 1.09 | 4.96 ± 1.12 | 4.97 ± 1.05 | 4.99 ± 1.11 | 5.02 ± 0.95 | 1040 |
| HDL cholesterol (mmol/l) | 1.27 ± 0.43 | 1.29 ± 0.47 | 1.28 ± 0.34 | 1.11 ± 0.29 | 1.13 ± 0.29 | 951 |
| LDL cholesterol (mmol/l) | 2.80 ± 1.00 | 2.75 ± 0.99 | 2.94 ± 1.06 | 2.87 ± 0.97 | 2.54 ± 0.83 | 953 |
| Triglycerides (mmol/l) | 2.07 ± 1.18 | 2.09 ± 1.16 | 1.90 ± 1.08 * | 2.27 ± 1.21 | 2.81 ± 1.86 * | 978 |
| Blood pressure and BMI | ||||||
| Systolic blood pressure (mm Hg) | 138.5 ± 16.6 | 138.2 ± 16.4 | 139.7 ± 17.4 | 137.1 ± 17.4 | 140.0 ± 12.7 | 1118 |
| Diastolic blood pressure (mm Hg) | 81.4 ± 10.3 | 81.1 ± 10.4 | 82.1 ± 10.5 | 82.7 ± 9.3 | 79.3 ± 9.8 | 1114 |
| Body mass index (kg/m2) | 29.8 ± 5.6 | 29.5 ± 5.4 | 30.4 ± 6.2 | 29.9 ± 5.3 | 31.2 ± 4.5 | 1114 |
| Diabetes treatment | ||||||
| Biguanides (%) | 78.2 (75.8–80.6) | 74.8 (71.6–78.0) * | 86.1 (81.9–90.3) * | 83.3 (74.7–91.9) | 77.3 (64.9–89.7) | 1097 |
| Insulin secretagogues, total (%) | 39.9 (37.0–42.8) | 41.2 (37.6–44.8) | 29.8 (24.4–35.2) * | 69.9 (59.4–80.4) * | 31.1 (17.6–44.6) | 1063 |
| Thiazolidinediones (%) | 18.5 (16.1–20.9) | 18.8 (15.9–21.7) | 17.7 (12.9–22.5) | 8.2 (1.9–14.5) | 34.1 (20.1–48.1) * | 1035 |
| Insulin (%) | 23.6 (21.1–26.1) | 27.0 (23.8–30.2) * | 17.1 (12.6–21.6) | 8.2 (1.9–14.5) * | 31.1 (17.6–44.6) | 1112 |
| Other (%) | 9.6 (7.8–11.4) | 7.6 (5.6–9.6) | 18.7 (13.7–23.7) | 2.9 (0–6.8) | 7.9 (0–16.2) | 1012 |
| Metabolic parameters blood pressure and BMI (Mean ± SD) as well as diabetes related medication (% 95% CI) of the patients at the time of the survey (cross sectional study). N indicates the number of patients with this parameter available. (parameter differs from other regions * p <0.01, ** p <0.001). | ||||||
This cross-sectional and retrospective study shows that glycaemic control and the type of anti-hyperglycaemic therapy in patients with type 2 diabetes mellitus in general practice in Switzerland are associated with the cultural region of the patient’s and physician’s place of residence.
With regard to regional group allocation, our patient sample was representative for Switzerland. The anthropometric and metabolic parameters of the cohort are comparable with other studies describing patients with type 2 diabetes mellitus and similar characteristics in Switzerland and other European countries [8, 14, 15].
When comparing HbA1c levels of patients from the different regions, there was no difference at the time when anti-hyperglycaemic treatment was initiated. Fasting glucose was, however, higher in the canton of Grisons. One could speculate that people from this more rural and mountainous region tend to visit their doctor less frequently, resulting in a delay of diagnosis or treatment initiation. At the time of study enrolment, however, fasting glucose had reached a similar level as in the rest of the country. While HbA1c-levels and fasting glucose were significantly lower in the German speaking part compared to the other parts of Switzerland at the time of survey, they were the highest in the Italian speaking part. The HbA1c-levels in the French speaking part of Switzerland did not differ from the other regions, and interestingly, they were also similar to the HbA1c levels observed in general practice in a European study (7.21% vs. 7.2%) [8].
To look for possible reasons for these differences, we also assessed the use of anti-diabetic therapy. In the Italian speaking part, insulin secretagogues were used more often at the most recent consultation compared to the other regions, and insulin itself was used less frequent. On the other hand, the use of insulin in the German speaking part was more common than in the rest of Switzerland. The non-randomised and cross-sectional study design does not allow direct conclusions to be drawn concerning the effect of choice of therapy on blood glucose control. When we compared the change in HbA1c in all patients, however, the improvement was larger in those receiving insulin. It is therefore likely that these factors are not independent. In particular, the association of a lower rate of insulin use with worse glycaemic control leads to the assumption that, in some regions, cultural barriers towards a more intensive and invasive therapy delay the escalation of therapy from the easier, more applicable insulin secretagogues to insulin. This assumption is supported by our finding that other factors such as blood pressure, kidney function or serum lipids did not show similar striking regional differences, which blood glucose control did. The only one of these parameters that showed a slight difference between regions at the time of the survey was serum triglycerides (lower in the French speaking part of Switzerland, higher in the canton of Grisons). A beneficial influence of the “Mediterranean Diet” on this parameter in the French speaking region compared to the lack of such diet habits in the mountainous region is a possible explanation for this finding [16]. However, this would contrast with other results that do not show an inter-regional difference in nutrition habits [17].
Weight gain may also be one of the obstacles towards appropriate glycaemic control. Overall, BMI was lower at the time of the survey compared to the beginning of therapy. However, patients with insulin treatment showed, along with the advantage of better HbA1c, a gain in weight.
There are limitations to this study. As mentioned, the study was neither conducted in a completely randomised nor in a prospective way. Due to this design, the demographic and anthropometric features of the study populations were not completely equal. There was a higher proportion of male patients in the Italian speaking part of Switzerland. However, we did not find a difference in the change in HbA1c or the use of anti-hyperglycaemic drugs between the two genders between initiation of therapy and the current survey. Nevertheless, all analyses were performed by adjusting for gender and for duration of therapy. Another limitation is a possible selection bias because only 134 (56%) of the 240 invited physicians finally participated in the study. However, with the exception of the canton of Grisons, there was no statistically significant difference in the participation of physicians among the different regions. Furthermore, due to the study design aiming at the accordance of the patient distribution with the population distribution between different regions, the power of the study to detect differences in glycaemic control was not equal among the regions. Finally, neither were outcome parameters measured at a central location / central laboratory nor was it possible to assure certain standard conditions (e.g., fasting state for triglyceride measurements). Therefore, differences due to various locations and conditions of outcome measurements cannot be excluded.
In summary, this study shows that the cultural background of patients and their physicians within a country might be an important predictor of the use and outcome of hyperglycaemic medical therapy. Efforts to identify region-specific cultural differences and the attempt to overcome potential associated barriers should be emphasised in any health care system when aiming for better patient care.
We would like to thank Dr. Diana Frey, Irena Senn, Annette Magnin and Kathryn Voegeli from PFC Pharma Focus AG for their competent support in project and data management and statistical analysis.
1 Khaw KT, Wareham N, Bingham S, Luben R, Welch A, Day N. Association of hemoglobin A1c with cardiovascular disease and mortality in adults: the European prospective investigation into cancer in Norfolk. Ann Intern Med. 2004;141(6):413–20.
2 Intensive blood-glucose control with sulphonylureas or insulin compared with conventional treatment and risk of complications in patients with type 2 diabetes (UKPDS 33). UK Prospective Diabetes Study (UKPDS) Group. Lancet. 1998;352(9131):837–53.
3 Holman RR, Paul SK, Bethel MA, Matthews DR, Neil HA. 10-year follow-up of intensive glucose control in type 2 diabetes. N Engl J Med. 2008;359(15):1577–89.
4 Patel A, MacMahon S, Chalmers J, Neal B, Billot L, Woodward M, et al. Intensive blood glucose control and vascular outcomes in patients with type 2 diabetes. N Engl J Med. 2008;358(24):2560–72.
5 Turnbull FM, Abraira C, Anderson RJ, Byington RP, Chalmers JP, Duckworth WC, et al. Intensive glucose control and macrovascular outcomes in type 2 diabetes. Diabetologia. 2009 Aug 5.
6 Standards of medical care in diabetes – 2009. Diabetes care. 2009;32(Suppl 1):S13–61.
7 Nathan DM, Buse JB, Davidson MB, Ferrannini E, Holman RR, Sherwin R, et al. Medical management of hyperglycaemia in type 2 diabetes mellitus: a consensus algorithm for the initiation and adjustment of therapy: a consensus statement from the American Diabetes Association and the European Association for the Study of Diabetes. Diabetologia. 2009;52(1):17–30.
8 Alvarez Guisasola F, Mavros P, Nocea G, Alemao E, Alexander CM, Yin D. Glycaemic control among patients with type 2 diabetes mellitus in seven European countries: findings from the Real-Life Effectiveness and Care Patterns of Diabetes Management (RECAP-DM) study. Diabetes, obesity & metabolism. 2008;10(Suppl 1):8–15.
9 Hoerger TJ, Segel JE, Gregg EW, Saaddine JB. Is glycemic control improving in U.S. adults? Diabetes care. 2008;31(1):81–6.
10 Liebl A, Mata M, Eschwege E. Evaluation of risk factors for development of complications in Type II diabetes in Europe. Diabetologia. 2002;45(7):S23–8.
11 Melander A, Folino-Gallo P, Walley T, Schwabe U, Groop PH, Klaukka T, et al. Utilisation of antihyperglycaemic drugs in ten European countries: different developments and different levels. Diabetologia. 2006;49(9):2024–9.
12 Philippe J, Brändle M, Carrel J, Diem P, Keller U, Kuntschen F, et al. Massnahmen zur Blutzuckerkontrolle bei Patienten mit Typ-2-Diabetes-mellitus. Schweiz Med Forum. 2009;9(3):50–5.
13 Friedewald WT, Levy RI, Fredrickson DS. Estimation of the concentration of low-density lipoprotein cholesterol in plasma, without use of the preparative ultracentrifuge. Clin Chem. 1972;18(6):499–502.
14 Allemann S, Saner C, Zwahlen M, Christ ER, Diem P, Stettler C. Long-term cardiovascular and non-cardiovascular mortality in women and men with type 1 and type 2 diabetes mellitus: a 30-year follow-up in Switzerland. Swiss Med Wkly. 2009;139(39-40):576–83.
15 Brandle M, Goodall G, Erny-Albrecht KM, Erdmann E, Valentine WJ. Cost-effectiveness of pioglitazone in patients with type 2 diabetes and a history of macrovascular disease in a Swiss setting. Swiss Med Wkly. 2009;139(11–12):173–84.
16 Rumawas ME, Meigs JB, Dwyer JT, McKeown NM, Jacques PF. Mediterranean-style dietary pattern, reduced risk of metabolic syndrome traits, and incidence in the Framingham Offspring Cohort. Am J Clin Nutr. 2009;90(6):1608–14.
17 Eichholzer M, Bovey F, Jordan P, Probst-Hensch N, Stoffel-Kurt N. Data on overweight and nutrition in the 2007 Swiss Health Survey. Praxis. 2010;99(1):17–25.
Funding / potential competing interests: The project was funded by sanofi-aventis (suisse) sa, Meyrin, Switzerland. Dr. Spirk and Dr. Thoenes are employees of sanofi-aventis (suisse) sa, Meyrin, Switzerland. The other authors have no competing interests to declare.