Figure 1
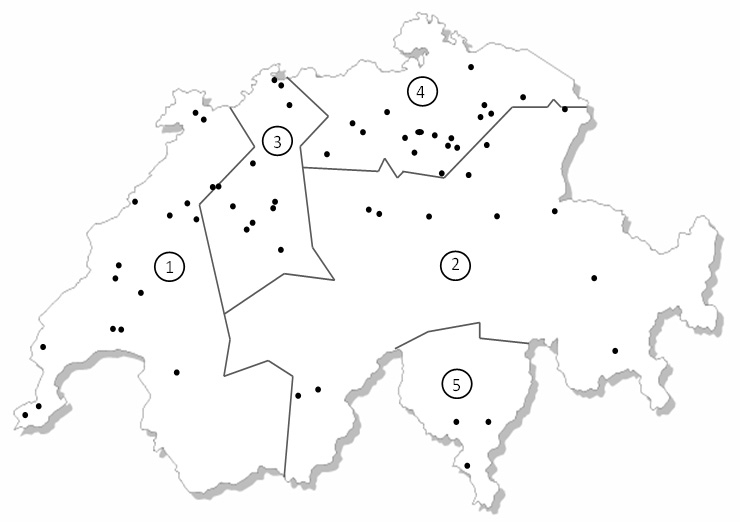
Map of Switzerland showing the five different regions used in the probability-proportionate-to-size cluster sampling as well as the locations of the 60 sampled schools.
DOI: https://doi.org/10.4414/smw.2011.13227
Excess body fat already leads to metabolic complications in childhood [1, 2], but central (intra-abdominal) distribution of body fat increases the risk for the metabolic syndrome more than peripheral distribution [3]. Waist circumference (WC) measurements have been used to estimate intra-abdominal fat in adults [4], and the importance of intra-abdominal fat in childhood obesity has also been confirmed [5]. Paediatric studies consistently show direct correlations of WC with components of the metabolic syndrome, including dyslipidaemia and fasting insulin concentrations [6–8]. The current definition of the International Diabetes Federation (IDF) of the metabolic syndrome in children also recommends using increased WC and not BMI as a criterion for the diagnosis of the metabolic syndrome [9].
Despite this, the tool most widely used to determine overweight and obesity in children is the body mass index (BMI). The determination of BMI is simple and BMI references for clinical use in children are available [10, 11]. However, the use of BMI to identify overweight children, specifically those at risk for metabolic disorders, has limitations. Due to its low sensitivity, a considerable number of children with high body fat may be misclassified as normal weight [12]. Furthermore, using the BMI, it is not possible to distinguish between changes in fat and fat free mass during treatment, and it provides no indication on fat distribution [13]. WC percentiles could therefore be a useful additional tool in the clinical assessment of childhood obesity, especially for estimating the risk for the development of the metabolic syndrome.
Even though WC has been shown to be well correlated to intra-abdominal fat depots measured by advanced imaging techniques, over- and underestimations may occur for very tall or very short persons with similar WC [14]. To overcome those difficulties, several authors suggest using the waist-to-height ratio (WHtR) for a more accurate estimation of fat distribution and body shape [15, 16]. Even in children, WHtR has been shown to be a useful predictor of cardiovascular risk, superior to BMI or waist to hip ratio [17, 18].
As there is no consensus on international WC or WHtR references in children, and as to our knowledge no references exist for Switzerland, the aim of this study was to develop WC and WHtR percentiles from a nationally representative sample of 6 to 13 year old children in Switzerland.
To obtain a nationally representative sample of 6 to 13 year old children in Switzerland a probability-proportionate-to-size cluster sampling based on census data from the year 2000 was used. This sample size represented about 1 in 250 children in this age group in Switzerland in the year 2007 when the study was conducted (Swiss Federal Department of Statistics, personal communication). By stratified random selection, 60 schools were identified across Switzerland. Figure 1 shows the distribution of the schools throughout the country. After acceptance of participation of a school, three or four classes (depending on class sizes) were randomly selected from each school and all students from the selected classrooms were invited to participate. The average number of participants per school was 38 students. Ethical approval for the study was obtained from the Swiss Federal Institute of Technology, Zürich, Switzerland. Written informed consent was obtained from all parents or guardians of the participating children and oral assent was received from the children prior to the measurements.
Figure 1
Map of Switzerland showing the five different regions used in the probability-proportionate-to-size cluster sampling as well as the locations of the 60 sampled schools.
All measurements were carried out by two trained examiners (RA and MK). Children left the classroom in pairs and measurements were carried out in a separate room. For the measurements the subjects removed their shoes, emptied their pockets and wore light indoor clothing. Height and weight were measured using standard anthropometric techniques [19]. Body weight was measured to the nearest 0.1 kg by using a digital scale (BF 18; Breuer, Ulm, Germany) calibrated with standard weights. Height was measured to the nearest 0.1 cm by using a portable stadiometer (Seca 214, Seca Medizinische Waagen und Messsysteme, D-Hamburg). BMI was calculated as weight (kg) divided by height2 (m). For the measurement of WC a non streachable measuring tape (Prym tape measure Junior yellow/white, William Prym GmbH & Co., Stolberg, Germany) was used and the measurement site was midway between the lowest rib and the top of the iliac crest. Subjects were asked to stand erect with their abdomen relaxed and their weight equally divided over both legs and to gently breathe out at the time of the measurement [20]. The measurements were done in duplicate for each child. Skinfold thickness (SFT) was measured using a Harpenden Skinfold Calliper (HSC-5, British Indicators, West Sussex, United Kingdom) with a constant spring pressure of 10 g/mm, a resolution of 0.2 mm and a measuring range of 80 mm. The measurements were performed at four different sites of the body (triceps, biceps, subscapular and suprailiac) [21]. For the measurements of the triceps skinfold, the midpoint of the back of the upper arm between the tips of the olecranal and acromial processes was determined by measuring with the arm flexed at 90° and was marked with a soft pen. With the arm hanging freely at the side, the calliper was applied vertically above the olecranon at the marked level. Over the biceps, the SFT was measured at the same level as the triceps, again with the arm hanging freely and the palm facing outwards. At the subscapular site, the SFT was picked up just below the inferior angle of the scapula at 45° to the vertical along the natural cleavage lines of the skin. The suprailiac SFT was measured above the iliac crest, just posterior to the mid axillary line and parallel to the cleavage lines of the skin, with the arm held lightly forward. All sites were measured on the left site of the body in duplicate. For both waist circumference and skinfold thickness, 10% of the measurements were repeated by the second examiner to calculate interobserver variability.
Body density (D) and body fat% (BF%) were calculated according to the following equations by Deurenberg et al. [22] using the mean of the repeated SFT measurements:
Statistical analysis was performed using SPLUS (Version 8, Insightful Corporation, Seattle, USA) SPSS 16.0 for Windows (SPSS Inc, Chicago, IL, USA) as well as EXCEL 2003 (Microsoft Crop., Redmond, USA). The percentiles for % BF and WC were calculated for boys and girls separately by the LMS-Method of Cole and Green [23] (Software lmsChartMaker Pro version 2.43 April 2010, http://www.healthforallchildren.co.uk/ ).
lmsChartMaker provides several graphical and numerical tools for testing the goodness of fit of the estimated centiles: these include the Q Tests by Royston and Wright [24] and the Detrended Q-Q plots [25]. lmsChartMaker also includes a number of suggestions for the effective estimation of the degrees of freedom of the L-, M- and S-curves.
For easier practical application, the values for the 5th, 10th, 15th, 25th,50th, 85th, 90th and 95th percentiles for WC and WHtR were calculated for boys and girls of all ages in 0.5 year steps. To define underweight, overweight and obesity according to BMI, the 5th, 85th and 95th BMI for age CDC reference percentiles were used [11].
Students t-test was used to compare genders and one way ANOVA for comparisons between regions. P values <0.05 were considered significant.
The basic characteristics of the subjects participating in the study, by region and gender, are displayed in tables 1 and 2. The final sample size recruited from 60 schools throughout Switzerland consisted of 2303 children (1128 boys and 1175 girls) between the age of 6 and 13 years. In the 60 schools participating a total of 3188 children were invited to take part. Of these, 2395 accepted, but 85 were absent on the day of measurement. The overall participation rate was 72.5% and it ranged from 69.9 to 74.7 for the different regions (compare table 1). Of the remaining group an additional seven were excluded because their age was either below 6 or above 13.9 years. Mean WC, WHtR and %BF significantly differed between boys and girls (p <0.05), while BMI did not. For WC and skinfold thickness measurements intraobserver variability (CV%) was 0.10 and 1.43, respectively, while interobserver variability was 0.17 and 1.74, respectively.
The prevalences (SE) of underweight, overweight and obesity for boys were 3.5 (0.54), 11.3 (0.94) and 5.4 (0.67), respectively, while they were 2.6 (0.45), 9.9 (0.87) and 3.2 (0.52) for girls. There were no significant gender differences for underweight and overweight, but the prevalence of obesity was significantly higher in boys than in girls (p <0.05). A more detailed description of the prevalence of over- and underweight in this group of children as well as its development over time has been published elsewhere [26].
WC, WHtR and BF% percentile curves for boys and girls as calculated by lmsChartMaker are depicted in figure 2. Displayed are the 5th, 10th, 15th, 25th, 50th, 75th, 85th, 90th and 95th percentiles in all three graphs. For WC and WHtR the corresponding age and gender specific percentile values are given for the 5th, 50th, 85th, 90th and 95th percentile in table 3.
The estimated percentiles for WC, WHtR and BF% passed the Q Tests and the Detrended Q-Q plots without showing any important lack of fit. The fit was excellent for the girls’ data; it was good for the boys’ data, where for BF% the Detrended Q-Q indicated that some moderate amount of kurtosis could be present.
| Table 1: Descriptive characteristics of a nationally representative sample of Swiss children aged 6 to 13 years by region. | |||||
| Region 1 | Region 2 | Region 3 | Region 4 | Region 5 | |
| n | 410 | 610 | 407 | 740 | 136 |
| Response rate (%) | 74.9 | 69.9 | 73.0 | 72.5 | 74.7 |
| nr schools sampled (aim) | 14 (14) | 14 (14) | 11 (12) | 18 (17) | 3 (3) |
| Age (y) | 10.1 ± 1.61,a | 10.2 ± 1.9a | 10.2 ± 1.8a | 10.3 ± 1.9a | 9.3 ± 1.6b |
| Height (m) | 1.40 ± 0.10a | 1.41 ± 0.12a | 1.41 ± 0.12a | 1.42 ± 0.12a | 1.36 ± 0.11b |
| Weight (kg) | 35.0 ± 8.9a,b | 34.7 ± 9.9a,b | 36.1 ± 10.3a | 36.1 ± 9.9a | 33.0 ± 9.1b |
| BMI (kg/m2) | 17.6 ± 2.8a,b | 17.2 ± 2.6a | 17.8 ± 2.9b | 17.6 ± 2.5b | 17.6 ± 3.0a,b |
| Body fat % | 21.6 ± 10.5a | 19.2 ± 10.3b | 21.5 ± 10.6a | 22.4 ± 10.2a | 23.8 ± 11.1a |
| Waist circumference (cm) | 64.4 ± 8.2a,b | 63.1 ± 7.9a | 64.9 ± 8.7b | 65.1 ± 8.0b | 63.7 ± 8.7a,b |
| Waist to height ratio (%) | 46.0 ± 5.01a | 44.9 ± 4.13b | 46.0 ± 4.85a | 45.9 ± 4.19a | 46.9 ± 5.21a |
| 1 mean ± SD (all such values) Means not sharing a common superscript letter differ significantly from each other (p <0.05) | |||||
| Table 2: Anthropometric characteristics of a nationally representative sample of Swiss children aged 6 to 13 years by age and gender. | |||||||
| n | Height (m) | Weight (kg) | BMI (kg/m2) | Body Fat % | Waist circumference | Waist to height ratio (%) | |
| Boys | |||||||
| 6 | 25 | 1.21 ± 0.06 | 23.5 ± 3.60 | 15.9 ± 1.33 | 13.6 ± 6.06 | 56.9 ± 3.92 | 47.0 ± 2.83 |
| 7 | 141 | 1.27 ± 0.06 | 26.8 ± 5.11 | 16.5 ± 2.27 | 15.1 ± 8.58 | 59.6 ± 5.84 | 46.8 ± 3.81 |
| 8 | 174 | 1.32 ± 0.05 | 28.8 ± 4.73 | 16.5 ± 1.89 | 15.0 ± 7.12 | 60.5 ± 5.05 | 45.0 ± 3.33 |
| 9 | 186 | 1.37 ± 0.06 | 32.8 ± 6.28 | 17.4 ± 2.50 | 19.0 ± 9.17 | 63.5 ± 6.74 | 46.4 ± 4.50 |
| 10 | 191 | 1.42 ± 0.06 | 35.9 ± 7.19 | 17.6 ± 2.64 | 21.4 ± 9.83 | 65.2 ± 7.80 | 45.8 ± 4.76 |
| 11 | 174 | 1.48 ± 0.07 | 39.9 ± 8.17 | 18.1 ± 2.80 | 23.6 ± 9.81 | 68.3 ± 8.03 | 46.2 ± 4.79 |
| 12 | 191 | 1.53 ± 0.07 | 43.8 ± 8.63 | 18.6 ± 2.76 | 23.1 ± 9.41 | 69.3 ± 7.75 | 45.3 ±4.68 |
| 13 | 46 | 1.58 ± 0.08 | 49.9 ± 9.20 | 19.7 ± 2.97 | 23.6 ± 9.97 | 72.6 ± 9.02 | 45.7 ± 5.49 |
| all | 1128 | 1.41 ± 0.12 | 35.4 ± 9.60 | 17.6 ± 2.70 | 18.8 ± 8.70 | 64.8 ± 8.10 | 46.0 ± 4.41 |
| Girls | |||||||
| 6 | 31 | 1.20 ± 0.03 | 22.8 ± 2.77 | 15.8 ± 1.46 | 11.9 ± 6.83 | 56.4 ± 3.88 | 46.9 ± 2.99 |
| 7 | 176 | 1.26 ± 0.06 | 26.0 ± 4.69 | 16.2 ±2.08 | 16.5 ± 9.80 | 58.6 ± 5.38 | 46.5 ± 3.90 |
| 8 | 153 | 1.31 ± 0.06 | 28.2 ± 4.73 | 16.4 ± 2.01 | 17.7 ± 9.71 | 59.5 ± 5.78 | 45.5 ± 4.03 |
| 9 | 191 | 1.37 ± 0.06 | 32.1 ± 6.02 | 17.1 ±2.40 | 21.6 ±9.98 | 62.7 ± 7.11 | 45.8 ± 4.59 |
| 10 | 196 | 1.43 ± 0.07 | 36.3 ± 7.88 | 17.7 ± 2.94 | 24.7 ± 11.06 | 64.6 ± 8.20 | 45.2 ± 5.12 |
| 11 | 181 | 1.48 ± 0.07 | 40.7 ± 8.12 | 18.4 ± 2.69 | 27.6 ± 10.14 | 67.7 ± 7.89 | 45.6 ± 4.77 |
| 12 | 208 | 1.54 ± 0.07 | 44.7 ± 8.73 | 18.6 ± 2.80 | 26.7 ± 9.33 | 68.1 ± 8.51 | 44.1 ± 4.99 |
| 13 | 39 | 1.56 ± 0.07 | 48.2 ± 8.64 | 19.7 ± 2.88 | 32.6 ± 9.15 | 72.0 ± 8.62 | 46.1 ± 5.16 |
| all | 1175 | 1.41 ± 0.12 | 35.2 ± 10.0 | 17.5 ± 2.70 | 21.1 ± 9.90 | 63.9 ± 8.30 | 45.5 ± 4.66 |
| 1 mean ± SD (all such values) | |||||||
| Table 3: Selected waist circumference and waist to height ratio percentiles by age and gender as calculated by lmsChartMaker in a national sample of 6 to 13 year old children in Switzerland (n = 2303, 1128 boys, 1175 girls). | ||||||||||
| Boys Age (y) | Waist circumference percentiles | Waist to height ratio percentiles | ||||||||
| 5th | 50th | 85th | 90th | 95th | 5th | 50th | 85th | 90th | 95th | |
| 6.5 | 50.6 | 56.2 | 61.3 | 62.8 | 65.2 | 42.3 | 46.4 | 50.0 | 51.0 | 52.8 |
| 7 | 51.4 | 57.2 | 62.6 | 64.1 | 66.8 | 42.1 | 46.2 | 50.0 | 51.1 | 52.9 |
| 7.5 | 52.1 | 58.2 | 63.9 | 65.5 | 68.4 | 41.8 | 46.1 | 50.0 | 51.1 | 53.0 |
| 8 | 52.9 | 59.2 | 65.2 | 67.0 | 70.0 | 41.6 | 46.0 | 50.0 | 51.2 | 53.2 |
| 8.5 | 53.6 | 60.2 | 66.5 | 68.4 | 71.6 | 41.2 | 45.8 | 50.0 | 51.2 | 53.3 |
| 9 | 54.3 | 61.2 | 67.8 | 69.8 | 73.3 | 41.1 | 45.7 | 50.0 | 51.3 | 53.5 |
| 9.5 | 55.1 | 62.2 | 69.2 | 71.3 | 75.0 | 40.8 | 45.5 | 50.0 | 51.3 | 53.7 |
| 10 | 55.8 | 63.2 | 70.5 | 72.8 | 76.7 | 40.6 | 45.4 | 50.0 | 51.4 | 53.8 |
| 10.5 | 56.5 | 64.2 | 71.9 | 74.3 | 78.4 | 40.4 | 45.2 | 50.0 | 51.5 | 54.0 |
| 11 | 57.3 | 65.2 | 73.3 | 75.8 | 80.2 | 40.4 | 45.1 | 50.0 | 51.5 | 54.2 |
| 11.5 | 58.0 | 66.2 | 74.6 | 77.3 | 82.0 | 39.9 | 44.9 | 50.0 | 51.6 | 54.4 |
| 12 | 58.7 | 67.2 | 76.0 | 78.8 | 83.9 | 39.7 | 44.8 | 50.0 | 51.6 | 54.6 |
| 12.5 | 59.4 | 68.2 | 77.4 | 80.4 | 85.7 | 39.4 | 44.6 | 50.0 | 51.7 | 54.8 |
| 13 | 60.1 | 69.3 | 78.8 | 82.0 | 87.7 | 39.2 | 44.5 | 50.0 | 51.8 | 55.0 |
| 13.5 | 60.8 | 70.3 | 80.3 | 83.6 | 89.6 | 39.0 | 44.3 | 50.0 | 51.8 | 55.2 |
| Girls Age (y) | Waist circumference percentiles | Waist to height ratio percentiles | ||||||||
| 5th | 50th | 85th | 90th | 95th | 5th | 50th | 85th | 90th | 95th | |
| 6.5 | 50.1 | 55.4 | 60.0 | 61.4 | 63.4 | 41.7 | 46.2 | 50.1 | 51.3 | 53.2 |
| 7 | 50.6 | 56.4 | 61.5 | 63.0 | 65.4 | 41.3 | 46.0 | 50.1 | 51.3 | 53.2 |
| 7.5 | 51.2 | 57.4 | 63.1 | 64.7 | 67.4 | 41.0 | 45.8 | 50.0 | 51.3 | 53.3 |
| 8 | 51.7 | 58.4 | 64.6 | 66.4 | 69.5 | 40.7 | 45.6 | 50.0 | 51.3 | 53.4 |
| 8.5 | 52.3 | 59.4 | 66.1 | 68.1 | 71.5 | 40.4 | 45.4 | 49.9 | 51.2 | 53.5 |
| 9 | 52.9 | 60.4 | 67.6 | 69.8 | 73.5 | 40.1 | 45.2 | 49.9 | 51.2 | 53.6 |
| 9.5 | 53.6 | 61.4 | 69.1 | 71.4 | 75.5 | 39.9 | 45.0 | 49.8 | 51.2 | 53.7 |
| 10 | 54.3 | 62.4 | 70.5 | 72.9 | 77.3 | 39.6 | 44.8 | 49.7 | 51.2 | 53.8 |
| 10.5 | 55.0 | 63.4 | 71.8 | 74.4 | 79.0 | 39.3 | 44.6 | 49.7 | 51.2 | 53.9 |
| 11 | 55.8 | 64.4 | 73.0 | 75.8 | 80.5 | 39.0 | 44.4 | 49.6 | 51.2 | 54.0 |
| 11.5 | 56.6 | 65.4 | 74.3 | 77.0 | 81.9 | 38.7 | 44.2 | 49.6 | 51.2 | 54.1 |
| 12 | 57.4 | 66.4 | 75.4 | 78.3 | 83.3 | 38.5 | 44.0 | 49.5 | 51.2 | 54.3 |
| 12.5 | 58.2 | 67.4 | 76.6 | 79.6 | 84.7 | 38.2 | 43.8 | 49.5 | 51.3 | 54.4 |
| 13 | 59.1 | 68.4 | 77.8 | 80.8 | 86.1 | 37.9 | 43.6 | 49.4 | 51.3 | 54.4 |
| 13.5 | 59.9 | 69.4 | 79.0 | 82.1 | 87.5 | 37.6 | 43.4 | 49.4 | 51.3 | 64.7 |
This study presents the first age and gender specific percentile curves for WC and WHtR in 6 to 13 year old children in Switzerland. The most widely used tool for defining overweight and obesity in epidemiological studies and most clinical settings is still the BMI. Even though it is a simple measurement and generally shows good agreement with body fat measurements, there are several limitations to this technique including the impossibility to distinguish between different distributional patterns of body fat. There is a clear link between intra-abdominal fat and metabolic abnormalities, such as plasma cholesterol, triglyceride and insulin concentrations [5–8]. In the most recent definition of the metabolic syndrome in children issued by the IDF in 2007, increased WC (>90th percentile) is used as the “sine qua non” factor for diagnosing the syndrome [9].
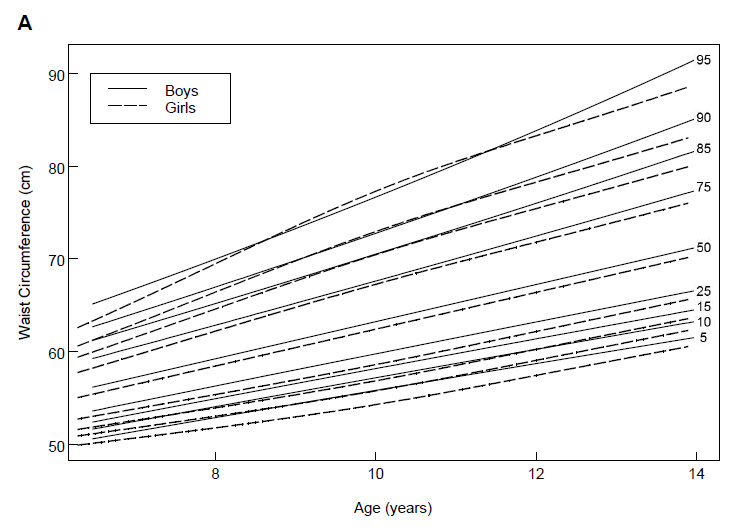
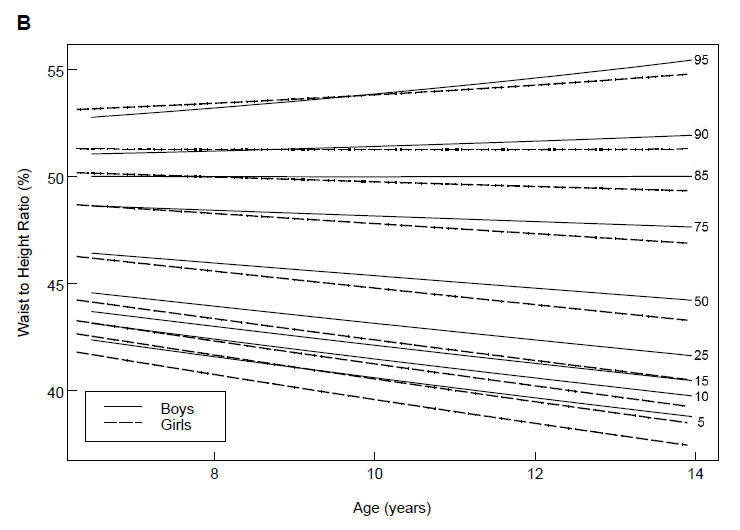
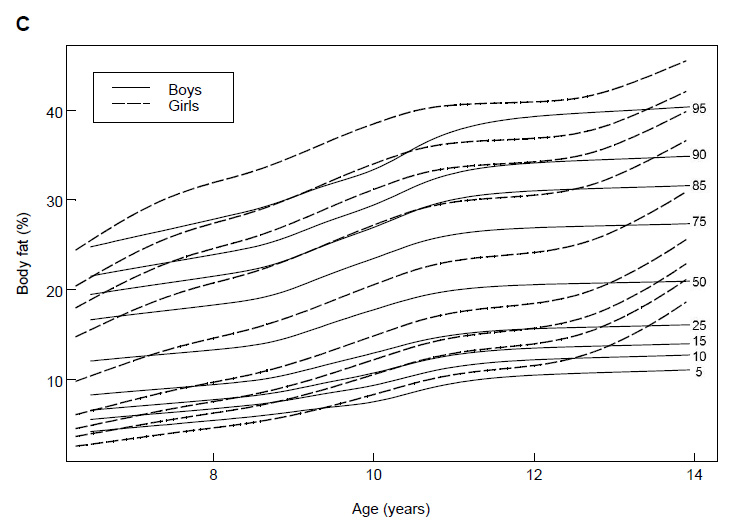
Figure 2
Waist circumference (A), waist to height ratio (B) and body fat % (C) percentiles for boys and girls calculated by lmsChartMaker in a national sample of 6 to 13 year old children in Switzerland (n = 2303).
Despite the acknowledged importance of WC in relation to disease, there are no international WC references for children available to date. Several countries, including the United Kingdom [27, 28], Germany [29], Italy [30], Spain [31], Turkey [32], Australia [33], New Zealand [34], the USA [35], Canada [36], the Netherlands [37], Bulgaria [38], Cyprus [39] and Mexico [40] have published national references for varying age groups. Comparison between countries, however, is difficult because the landmark used to measure WC and the cut off points for the definition of children at risk vary. In some studies, WC is measured midway between the lowest rib and the top of the iliac crest and in others at the umbilicus [13]. To identify children at risk for the metabolic syndrome, different WC cut-off percentiles have been proposed. A study conducted in 1087 10 to 14 year old children in Cyprus suggests the 75th percentile [39]. In a study in 580 3 to 19 year old children in New Zealand, the 80th percentile was suggested as the cut off [34]. A third study including 3531 3 to 11 year old children in Germany used the 90th percentile [29]. The 90th percentile is also recommended in the IDF definition for the metabolic syndrome [9].
Another potentially useful anthropometric measure to better define body shape is WHtR. It has specifically been postulated to be superior in certain population groups, such as very tall or short people, where WC may over- or under estimate the risk for chronic disease [14]. In our sample of children we have further been able to show, that at a certain cut-off level (85th percentile for boys and 90th percentile for girls) this ratio remains constant over the entire age range of 6 to 13 years. Whether those cut-offs are of clinical relevance remains to be determined, but if this were the case it would bring the advantage of an age independent cut-off for all children. It has already been suggested that for adults, where for WC gender as well as ethnicity specific cut-off values are necessary, a single, universal WHtR cut-off of 50% may be sufficient. It was even suggested by the same authors, that this same cut-off value may also be useful in children [41]. Our data seem to support this suggestion, as the 85th WHtR percentile lies exactly on the value of 50% throughout all age groups for boys while it crosses the 50% cut-off for girls, decreasing slightly with age (ranging from 50.1 at 6.5 y to 49.4 at 13.5 y). However, large scale prospective studies assessing disease outcome will be necessary to validate this universal cut-off, especially in children.
Using probability-proportionate-to-size cluster sampling we have aimed at a nationally representative study population. It has been possible to stick to the original sampling scheme for all except one of the schools included and response rate was similar in all regions. However, participation in the study was voluntary and we have no information on the children who did not participate. This may, of course, introduce a certain bias into the data, as one might expect the proportion of non-participants to be higher in overweight children for fear of stigmatization as has been discussed previously [42, 43]. If this was the case in our study population, this would mean, that the higher percentiles might be slightly underestimated, thus possibly leading to slightly more ‘false positive’ values, which may even be to the advantage of the children, as more would be examined carefully for cardiovascular disease risk. Until now, national Swiss data on WC or WHtR have not been available. The percentile curves and values presented here, which are derived from a large nationally representative sample of 6 to 13 year old children, may therefore be useful for Swiss clinicians and scientists even though additional data will be required to set up official Swiss references.
In order to simplify diagnosis as well as international comparisons, standardized, international references including exact instructions on the site of measurement would be valuable. As long as these references are not available, national WC and WHtR references will have to be used together with references for BMI and, if possible, BF% for epidemiologic studies as well as clinical diagnosis, unless more precise measurements to quantify body fat distribution are available.
We would like to thank all participating schools, teachers, children as well as their parents for their cooperation. The Swiss Federal Office of Public Health is gratefully acknowledged for financially supporting this survey.
1 Dietz WH. Health consequences of obesity in youth: childhood predictors of adult disease. Pediatrics. 1998;101:518–25.
2 Weiss R, Caprio S. The metabolic consequences of childhood obesity. Best Pract Res Clin Endocrinol Metab. 2005;19:405–19.
3 Pouliot MC, Despres JP, Lemieux S, et al. Waist Circumference and Abdominal Sagittal Diameter - Best Simple Anthropometric Indexes of Abdominal Visceral Adipose-Tissue Accumulation and Related Cardiovascular Risk in Men and Women. Am J Cardiol. 1994;73:460–8.
4 Lean ME, Han TS, Morrison CE. Waist circumference as a measure for indicating need for weight management. BMJ. 1995;311:158–61.
5 Goran MI, Gower BA. Relation between visceral fat and disease risk in children and adolescents. Am J Clin Nutr. 1999;70:149S–156S.
6 Cowin I, Emmett P. Cholesterol and triglyceride concentrations, birthweight and central obesity in pre-school children. ALSPAC Study Team. Avon Longitudinal Study of Pregnancy and Childhood. Int J Obes Relat Metab Disord. 2000;24:330–9.
7 Flodmark CE, Sveger T, Nilsson-Ehle P. Waist measurement correlates to a potentially atherogenic lipoprotein profile in obese 12-14-year-old children. Acta Paediatr. 1994;83:941–5.
8 Freedman DS, Serdula MK, Srinivasan SR, Berenson GS. Relation of circumferences and skinfold thicknesses to lipid and insulin concentrations in children and adolescents: the Bogalusa Heart Study. Am J Clin Nutr. 1999;69:308–17.
9 Zimmet P, Alberti G, Kaufman F, et al. The metabolic syndrome in children and adolescents. Lancet. 2007;369:2059–61.
10 Cole TJ, Bellizzi MC, Flegal KM, Dietz WH. Establishing a standard definition for child overweight and obesity worldwide: international survey. BMJ. 2000;320:1240–3.
11 Ogden CL, Kuczmarski RJ, Flegal KM, et al. Centers for Disease Control and Prevention 2000 growth charts for the United States: improvements to the 1977 National Center for Health Statistics version. Pediatrics. 2002;109:45–60.
12 Zimmermann MB, Gubeli C, Puntener C, Molinari L. Detection of overweight and obesity in a national sample of 6-12-y-old Swiss children: accuracy and validity of reference values for body mass index from the US Centers for Disease Control and Prevention and the International Obesity Task Force. Am J Clin Nutr. 2004;79:838–43.
13 McCarthy HD. Body fat measurements in children as predictors for the metabolic syndrome: focus on waist circumference. Proc Nutr Soc. 2006;65:385–92.
14 Browning L, Hsieh S, Ashwell M. A systematic review of waist-to-height ratio as a screening tool for the prediction of cardiovascular disease and diabetes: 0.5 could be a suitable global boundary value Nutrition Research Reviews 2010;23:247–69.
15 Ashwell M, Cole TJ, Dixon AK. Ratio of waist circumference to height is strong predictor of intra-abdominal fat. BMJ. 1996;313:559–60.
16 Hsieh SD, Yoshinaga H. Waist/height ratio as a simple and useful predictor of coronary heart disease risk factors in women. Intern Med. 1995;34:1147–52.
17 Hara M, Saitou E, Iwata F, Okada T, Harada K. Waist-to-height ratio is the best predictor of cardiovascular disease risk factors in Japanese schoolchildren. J Atheroscler Thromb. 2002;9:127–32.
18 Kahn HS, Imperatore G, Cheng YJ. A population-based comparison of BMI percentiles and waist-to-height ratio for identifying cardiovascular risk in youth. J Pediatr. 2005;146:482–8.
19 WHO. Physical status: the use and interpretation of anthropometry. Report of a WHO expert committee 1995.
20 Gibson RS. Principles of Nutritional Assessment. 2. ed. New York: Oxford University Press, 2005.
21 Gibson RS. Nutritional Assessment: A Laboratory Manual. Oxford: Oxford University Press, 1993.
22 Deurenberg P, Pieters JJ, Hautvast JG. The assessment of the body fat percentage by skinfold thickness measurements in childhood and young adolescence. Br J Nutr. 1990;63:293–303.
23 Cole TJ, Green PJ. Smoothing reference centile curves: the LMS method and penalized likelihood. Stat Med. 1992;11:1305–19.
24 Royston P, Wright EM. Goodness-of-fit statistics for age-specific reference intervals. Statistics in Medicine. 2000;19:2943–62.
25 van Buuren S, Fredriks M. Worm plot: a simple diagnostic device for modelling growth reference curves. Statistics in Medicine. 2001;20:1259–77.
26 Aeberli I, Ammann RS, Knabenhans M, Molinari L, Zimmermann MB. Decrease in the prevalence of paediatric adiposity in Switzerland from 2002 to 2007. Public Health Nutrition. 2010;13:806–11.
27 McCarthy HD, Ellis SM, Cole TJ. Central overweight and obesity in British youth aged 11-16 years: cross sectional surveys of waist circumference. BMJ. 2003;326:624.
28 McCarthy HD, Jarrett KV, Crawley HF. The development of waist circumference percentiles in British children aged 5.0–16.9 y. Eur J Clin Nutr. 2001;55:902–7.
29 Schwandt P, Kelishadi R, Haas GM. First reference curves of waist circumference for German children in comparison to international values: the PEP Family Heart Study. World Journal of Pediatrics. 2008;4:257–64.
30 Zannolli R, Morgese G. Waist percentiles: a simple test for atherogenic disease? Acta Paediatr. 1996;85:1368–9.
31 Moreno LA, Fleta J, Mur L, Sarria A, Bueno M. Fat distribution in obese and nonobese children and adolescents. J Pediatr Gastroenterol Nutr. 1998;27:176–80.
32 Hatipoglu N, Ozturk A, Mazicioglu MM, Kurtoglu S, Seyhan S, Lokoglu F. Waist circumference percentiles for 7- to 17-year-old Turkish children and adolescents. Eur J Pediatr. 2007.
33 Eisenmann JC. Waist circumference percentiles for 7- to 15-year-old Australian children. Acta Paediatr. 2005;94:1182–5.
34 Taylor RW, Jones IE, Williams SM, Goulding A. Evaluation of waist circumference, waist-to-hip ratio, and the conicity index as screening tools for high trunk fat mass, as measured by dual-energy X-ray absorptiometry, in children aged 3–19 y. Am J Clin Nutr. 2000;72:490–5.
35 Fernandez JR, Redden DT, Pietrobelli A, Allison DB. Waist circumference percentiles in nationally representative samples of African-American, European-American, and Mexican-American children and adolescents. J Pediatr. 2004;145:439–44.
36 Katzmarzyk PT. Waist circumference percentiles for Canadian youth 11–18 y of age. Eur J Clin Nutr. 2004;58:1011–5.
37 Fredriks AM, van Buuren S, Fekkes M, Verloove-Vanhorick SP, Wit JM. Are age references for waist circumference, hip circumference and waist-hip ratio in Dutch children useful in clinical practice? Eur J Pediatr. 2005;164:216–22.
38 Galcheva SV, Iotova VM, Yotov YT, Grozdeva KP, Stratev VK, Tzaneva VI. Waist circumference percentile curves for Bulgarian children and adolescents aged 6–18 years. International J Pediatr Obesity. 2009;4:381–8.
39 Savva SC, Tornaritis M, Savva ME, et al. Waist circumference and waist-to-height ratio are better predictors of cardiovascular disease risk factors in children than body mass index. Int J Obes Relat Metab Disord. 2000;24:1453–8.
40 Gomez-Diaz RA, Martinez-Hernandez AJ, Aguilar-Salinas CA, et al. Percentile distribution of the waist circumference among Mexican pre-adolescents of a primary school in Mexico City. Diabetes Obes Metab. 2005;7:716–21.
41 Ashwell M, Hsieh SD. Six reasons why the waist-to-height ratio is a rapid and effective global indicator for health risks of obesity and how its use could simplify the international public health message on obesity. Int J Food Sci Nutr. 2005;56:303–7.
42 Crosbie A, Eichner J, Moore W. Body mass index screening and volunteer bias. Annals of Epidemiology. 2008;18:602–4.
43 Peneau S, Salanave B, Maillard-Teyssier L, et al. Prevalence of overweight in 6- to 15-year-old children in central/western France from 1996 to 2006: trends toward stabilization. Int J Obes. (Lond) 2009.
Funding / competing conflicts of interests: This study was supported by the Swiss Federal Office of Public Health.