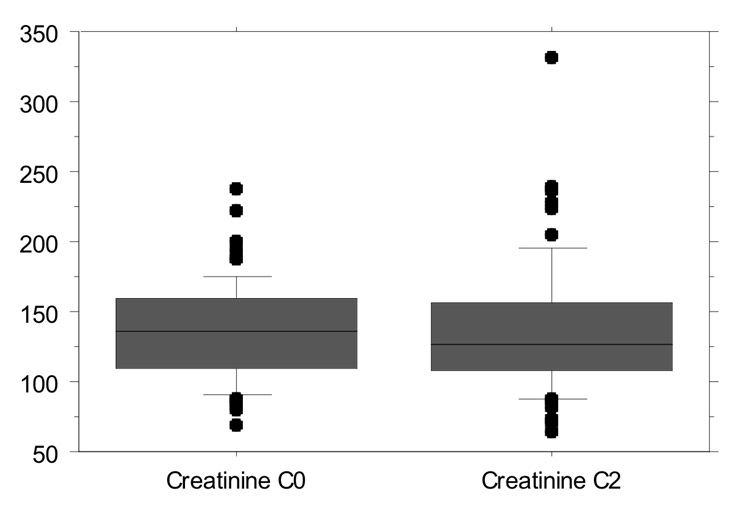
Figure 1
Creatinine levels: 135.4 ± 34.88 µmol/L during C0 monitoring vs. 137.4 ± 47.08 µmol/L during C2 monitoring (p = 0.521).
DOI: https://doi.org/10.4414/smw.2011.13149
1 contributed equally
Design and performance of study: MH and AEF
Data analysis: MH, FE, AEF, AF, TFL, FR and GN
Paper writing: MH, AF, AEF, FE, TFL, FR and GN
Since the introduction of cyclosporine (CsA) in the early 1980’s the incidence of graft failure with acute rejection decreased and survival rates improved [1]. However, individual monitoring of drug exposure became necessary and the initially suggested method to monitor CsA blood levels was the determination of trough levels (C0). Later on, CsA 2-hour post-dose level (C2) monitoring has been reported to be superior in predicting outcomes [2]. Indeed, in stable adult heart transplant patients, C2 levels showed an excellent correlation with absorption profiling and clinical outcomes [3–5]. However, data from heart transplantation patients are limited [6]. In addition, most available reports focus on de novo rather than maintenance patients. Therefore, the purpose of our study was to determine whether C0 or C2 monitoring beneficially impacts on clinical outcome after heart transplantation. Thus, we compared the number of acute cellular rejections and clinical outcome, such as renal function and blood pressure in patients seen for regular follow-up at the Cardiovascular Centre at the University Hospital Zurich, during two time periods where either C0 or C2 monitoring had been performed.
The study included 65 heart transplant recipients seen for regular surveillance at the University Hospital Zurich. Data were obtained between June 1999 and January 2006. During this time, the follow-up at our centre was switched from CsA monitoring based on C0 values to a monitoring based on C2 values. Thus, all patients treated with CsA were switched from the C0 to the C2 monitoring program. After a C2 monitoring phase of about 19 months (568 ± 267 days), C2 monitoring was abandoned and C0 monitoring was restarted. From the preceding C0 monitoring period, we analysed patient data from a comparable time period. At the time of first C2 measurement patients were 9.2 ± 3.9 years post-transplantation with an age of 56.8 ± 11.8 years. Standard immunosuppression therapy included CsA, azathioprine or mycophenolate, and prednisone. Clinical data were analysed by the investigators during regular follow-up visits. CsA levels were measured by the Institute for Clinical Chemistry at the University Hospital Zurich using the immunoassay method [7]. The creatinine clearance was calculated using the Cockcroft – Gault equation [8]. Left ventricular ejection fraction was measured using 2D-echocardiography or laevography. The study was performed in accordance with the Helsinki Declaration of 1975.
Endomyocardial biopsies were graded by the Department of Pathology at the University Hospital of Zurich using ISHLT grading guidelines [9, 10]. Endomyocardial biopsies (EMB) were performed every 3–6 months. In case of a biopsy proven rejection ≥ ISHLT grade 2, a second EMB was performed 1–2 weeks later. In our study, ISHLT grades 2, 3A, 3B and 4 were accepted as biopsy proven acute rejection (BPAR). In addition, a sub-analysis was performed including only rejections ≥ ISHLT grade 3A.
For the analysis of the BPAR, the total number of BPAR during the study period was compared. As not all the patients had the same number of biopsies during the study period, another analysis of the total number of biopsies was made. In this analysis, the number of biopsies with rejection was divided by the number of total biopsies during the respective study period for each patient. For the comparison of the values of the C0 and the C2 period, the paired t-test was used as data from both periods were available for each patient. A p-value <0.05 was considered significant. StatView was used as the statistical software.
Mean age at the time of the heart transplantation was 47.8 ± 12.2 years. At the time of first C2 measurement, patients were 9.2 ± 3.9 years post-transplantation and they were 56.8 ± 11.8 years old.
Figure 1
Creatinine levels: 135.4 ± 34.88 µmol/L during C0 monitoring vs. 137.4 ± 47.08 µmol/L during C2 monitoring (p = 0.521).
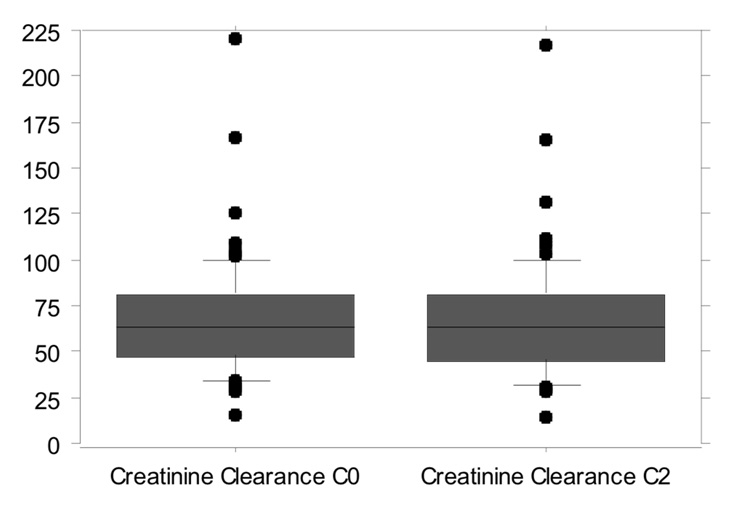
Figure 2
Creatinine clearance: 68.1 ± 32.74 ml/min during the C0 monitoring period vs. 67.9 ± 33.14 ml/min during the C2 monitoring period (p = 0.64).
Co-medication was comparable between the two measurement periods, except for prednisone. During the C0 period the number of patients treated with prednisone was significantly higher than during the following C2 period (p = 0.031) (table 1), while the mean steroid dose was significantly lower during the C0 period compared to the C2 period (6.13 ± 4.90 mg vs. 9.40 ± 5.02 mg, p = 0.03). The mean azathioprine and mycophenolate (MMF) dosages did not differ significantly between the two treatment phases: Azathioprine: 68.07 ± 32.40 mg during C0 vs. 69.95 ± 32.07 mg during C2, p = 0.79 and MMF: 2348.88 ± 601.91 mg during C0 and 2276.00 ± 627.51 mg during C2, p = 0.68. Statin medication was comparable in both groups (C0: 58 patients vs. C2: 55 patients, p = 0.083), table 1.
C-reactive protein (CRP) levels were comparable in both groups (C0: 5.21 ± 7.78 mg/l vs. C2: 5.35 ± 8.66 mg/l, p = 0.44).
In total, 411 EMBs were performed during the C0 period and 308 EMBs were performed during the C2 period. The number of BPAR with ISHLT grade ≥2 were not different during C0 monitoring (13 pts; 20%) and C2 monitoring (12 pts; 18.4%) (p = 0.829).
No difference was observed for the number of total rejections per patient during the two periods (0.35 ± 0.943 during C0 vs. 0.26 ± 0.619 during C2; p = 0.517). The number of rejection episodes per total number of biopsies was comparable between both periods (0.062 ± 0.123 for the C0 and 0.067 ± 0.141 for C2 monitoring; p = 0.805).
The sub-analysis of ISHLT grade ≥3 rejections per total number of biopsies revealed values of 0.020 ± 0.058 for C0 vs. 0.009 ± 0.047 for C2 monitoring. (p = 0.249). Hence, 10 patients experienced 12 episodes of ISHLT ≥3A rejection during the C0 phase, compared to 4 episodes in 4 patients during the C2 phase.
Left ventricular ejection fraction, as an indirect sign of rejection, did not differ between the two study phases (C0 phase: 67.13 ± 5.76%, C2 phase: 67.28 ± 11.09%, p = 0.92).
The mean C0 CsA levels were 169.3 ± 36.47 ng/ml compared to mean C2 levels of 665.0 ± 107.79 ng/ml.
During C0 monitoring the mean CsA level of patients experiencing a rejection BPAR ≥2 was 175.9 ± 33.3 ng/ml. Patients without rejection had a mean CsA level of 167.4 ± 37.5 ng/ml (p = 0.43). In addition, when defining BPAR ≥3 as a rejection no significant difference was found (p = 0.22). During the phase of C2 monitoring the mean CsA level of patients experiencing a rejection BPAR ≥2 was 670.5 ± 111.5 ng/ml. Patients without rejection had a mean CsA level of 663.5 ± 107.8 ng/ml (p = 0.83). Additionally when defining BPAR ≥3 as a rejection no significant difference was found (p = 0.57).
The CsA dose during C0 monitoring was higher (208.0 ± 53.89 mg per day) compared to the C2 monitoring (182.3 ± 46.09 mg per day; p <0.0001).
Despite the difference in CsA dosage, absolute reduction of mean daily doses during each period was comparable. CsA was reduced by 13.3 ± 34.62 mg per day during C0 and 22.5 ± 36.53 mg per day during C2 monitoring period (p = 0.259).
Mean creatinine plasma levels were 135.4 ± 34.88 µmol/L during C0 monitoring and 137.4 ± 47.08 µmol/L during C2 monitoring (p = 0.521, fig. 1). The creatinine clearance during the C0 monitoring period was 68.1 ± 32.74 ml/min vs. 67.9 ± 33.14 ml/min during the C2 monitoring period (p = 0.64, fig. 2). No changes in renal function during each period were observed. Mean plasma creatinine was 135 ± 38.29 µmol/L (start C0), 135.03 ± 42.19 µmol/L (start C2) and 133.31 ± 39.89 µmol/L (end C2) (p = 0.80). Mean urea blood levels were 11.97 ± 5.659 mg/dl during C0 and 12.68 ± 6.579 mg/dl during C2 monitoring (p=0.197).
Mean blood pressure was 139.3 ± 12.69 / 88.8 ± 6.64 mm Hg during C0 monitoring and 137.7 ± 13.45 / 87.6 ± 8.88 mm Hg during C2 monitoring (p = 0.292 for systolic and p = 0.25 for diastolic blood pressure).
| Table 1: Co-medication during C0 and the C2 periods. | |||
| Number of patients during C0 (%) | Number of patients during C2 (%) | p-value | |
| Azathioprine | 44 (6737) | 42 (64.6) | 0.418 |
| Mycophenolate | 21 (32.3) | 22 (33.8) | 0.658 |
| Prednisone | 29 (44.6) | 21 (32.3) | 0.031 |
| Diuretic Drugs | 22 (33.8) | 21 (32.3) | 0.784 |
| Ca-Antagonist Non-DHP | 26 (40.0) 11 (16.9) | 30 (46.2) 10 (15.4) | 0.289 |
| ACE-Inhibitor | 32 (49.2) | 29 (44.6) | 0.410 |
| Beta-Blockers | 16 (24.6) | 20 (30.8) | 0.159 |
| Platelet inhibitors | 25 (38.5) | 26 (40.0) | 0.741 |
| Statin | 58 (89.2) | 55 (84.6) | 0.083 |
| Anticoagulation | 3 (4.6) | 6 (9.25) | 0.083 |
Over the last few years data from pharmacological and clinical publications have been cited to suggest that C2 monitoring could confer a benefit over C0 monitoring of CsA. Despite these theoretical advantages and the publication of consensus statements in favour of C2 monitoring strategy [2], the benefit of C2 monitoring over trough levels was questioned [11] and some HTx centers including our own abandoned this monitoring system [12].
Interestingly, most studies on the comparison of C0 and C2 monitoring followed patients for up to six months only and focused mainly on de novo transplantation patients [13]. Only one study included stable maintenance patients more than five years after HTx [14]. In our study, maintenance patients were followed with either C0 or C2 monitoring for 19 months each. During these periods, no difference in BPARs, blood pressure levels or kidney function was observed. This is in line with recently published data in de novo heart transplant patients that were monitored for 12 months after heart transplantation [13]. Indeed, C2 levels were associated with the incidence of rejections only in lung but not in heart recipients.
However, our study showed that during C2 monitoring patients received lower doses of CsA, while dose reduction during both periods was comparable. The difference in dosing could at least in part be explained by the longer interval since HTx (+19 months) during the C2 monitoring phase.
Our results are comparable with data from a recently published randomized trial of stable patients 6.4 years after HTx [14]. Mathias et al. investigated 62 patients with C0-monitoring and 63 patients with C2-monitoring over a period of six months. As in our study no suspected episodes of rejection and no differences in creatinine clearance were seen. Analysis of BPAR in our populations showed no difference between both groups either with a cut-off at ISHLT ≥2 or ISHLT ≥3A. However, the absolute number of BPAR ≥3A trended to be higher in the C0-group without reaching statistical significance.
Interestingly, CsA dose reduction during the study period was greater in the C2-monitored group (26 mg/day vs. 11 mg/day) [14]. However, it is of note that available data about differences of renal function during C0 and C2 monitoring are not consistent. Indeed, while in the study by Delgado et al. again no differences for renal function (and BPAR) were observed [5], data from an earlier study on C2 monitoring in HTx patients did show an increase of serum creatinine after switching to C0 monitoring in 114 HTx patients [15]. In a different study by Cantarovic et al. [3] no differences in renal function were noted. It is of note that the higher CsA dose during the C0 phase was not associated with increased creatinine levels in this study group. On the other hand, lower CsA dosages during the C2 phase did not turn into an improvement in renal function at the end of this period. However, a lower daily dosage of CsA could slow the constant decline of renal function during the long term follow-up of patients after heart transplantation.
One limitation of our study is the significant difference in patients receiving steroids. However, although more patients were treated with steroid during the C0-period, they received significantly lower daily prednisone doses overall. Therefore, the impact of prednisone exposure remains elusive. Furthermore, there is an ongoing debate as to whether EMBs are still a reliable tool for estimating real rejection during long term follow-up of patients more than two years after heart transplantation [16]. We analysed left ventricular ejection fraction data, as an associated parameter of graft failure and did not find any difference between the two study periods.
In conclusion, C2 monitoring was not associated with beneficial effects on the number of BPAR, blood pressure levels and renal parameters compared to C0 monitoring. Therefore, in view of the recurrent logistic problems for transplantation centres and patients associated with C2-monitoring, the need for regular C2-monitoring could be questioned. However, patients received lower daily cyclosporine doses during C2 monitoring, which could partially be explained by the longer interval after HTx. Whether these results translate into beneficial effects on long term outcome can only be answered in long term large scale studies.
1 Cheung A, Menkis AH. Cyclosporine heart transplantation. Transplant Proc. 1998;30(5):1881–4.
2 Levy G, et al. Patient management by Neoral C(2) monitoring: an international consensus statement. Transplantation. 2002;73(9 Suppl):S12–8.
3 Cantarovich M, et al. Two-hour cyclosporine level determination is the appropriate tool to monitor Neoral therapy. Clin Transplant. 1998;12(3):243–9.
4 Cantarovich M, et al. History of C2 monitoring in heart and liver transplant patients treated with cyclosporine microemulsion. Transplant Proc. 2004;36(2 Suppl):442S–447S.
5 Delgado DH, et al. Monitoring of cyclosporine 2-hour post-dose levels in heart transplantation: improvement in clinical outcomes. J Heart Lung Transplant. 2005;24(9):1343–6.
6 Solari SG, et al. Cyclosporine monitoring with 2-hour postdose levels in heart transplant recipients. Ther Drug Monit. 2005;27(4):417–21.
7 Wang P, et al. A monoclonal antibody fluorescent polarization immunoassay for cyclosporine. Transplant Proc. 1990;22(3):1186–8.
8 Cockcroft DW, Gault MH. Prediction of creatinine clearance from serum creatinine. Nephron. 1976;16(1):31–41.
9 Cunningham KS, Veinot JP, Butany J. An approach to endomyocardial biopsy interpretation. J Clin Pathol. 2006;59(2):121–9.
10 Stewart S, et al. Revision of the 1990 working formulation for the standardization of nomenclature in the diagnosis of heart rejection. J Heart Lung Transplant. 2005;24(11):1710–20.
11 Campbell SB, Johnson DW. Patient management by cyclosporine C2 monitoring: not enough science yet to justify the practice. Transplantation. 2003;75(11):1917–8.
12 Birsan T, et al. Comparison between C0 and C2 monitoring in de novo renal transplant recipients: retrospective analysis of a single-center experience. Transplantation. 2004;78(12):1787–91.
13 Iversen M, et al. Cyclosporine C2 levels have impact on incidence of rejection in de novo lung but not heart transplant recipients: the NOCTURNE study. J Heart Lung Transplant. 2009;28(9):919–26.
14 Mathias HC, et al. A randomized, controlled trial of C0- Vs C2-guided therapeutic drug monitoring of cyclosporine in stable heart transplant patients. J Heart Lung Transplant. 2005;24(12):2137–43.
15 Cantarovich M, et al. Clinical benefit of neoral dose monitoring with cyclosporine 2-hr post-dose levels compared with trough levels in stable heart transplant patients. Transplantation. 1999;68(12):1839–42.
16 Klingenberg R, et al. Allograft rejection of ISHLT grade >/=3A occurring late after heart transplantation – a distinct entity? J Heart Lung Transplant. 2003;2(9):1005–13.
No funding; no competing interests.