Figure 1
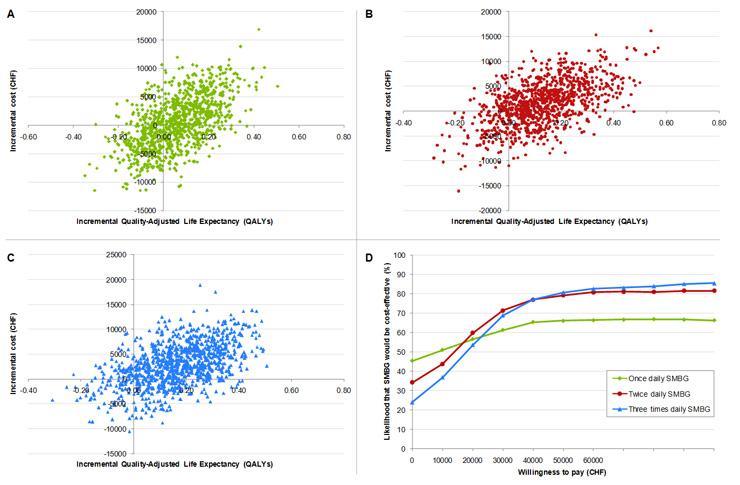
Incremental cost-effectiveness scatter plots for SMBG once (A), twice (B) and three times daily (C) SMBG versus no SMBG. Cost-effectiveness acceptability curves for once, twice and three times daily SMBG versus no SMBG (D).
DOI: https://doi.org/10.4414/smw.2010.13103
A long-term modelling study in Switzerland
The prevalence of type 2 diabetes continues to increase globally [1].While there is a paucity of Switzerland-specific prevalence data, a recent population-based study in Lausanne reported a diabetes prevalence of 6.6% amongst 35–75 year old Caucasians [2]. This high and increasing prevalence is imposing an ever greater economic burden on healthcare payers, driving efforts to optimise the management of patients with type 2 diabetes. The potential value of self-monitoring of blood glucose (SMBG), as part of a multifaceted management strategy in patients not receiving insulin treatment, has been a contentious issue in recent years. Although SMBG is widely considered to be an effective and cost-effective measure in type 1 diabetes patients [3, 4] and insulin-treated type 2 diabetes patients [5, 6], there has been much debate surrounding its use in type 2 diabetes patients on oral anti-diabetic agents (OADs) [7, 8]. This is reflected in the Swiss healthcare system where reimbursement for SMBG strips is currently restricted to 400 per year in patients with type 2 diabetes treated with OADs only [9].
There is conflicting evidence from a number of randomised clinical trials performed to assess the effectiveness of SMBG in terms of blood glucose control (as measured by HbA1c) in type 2 diabetes patients on OADs [10–16]. A number of meta-analyses have been published which attempt to address the reliability of the data resulting from these studies. A study by Welschen et al., for example, concluded that the overall effect of SMBG was a statistically significant decrease of 0.39% in HbA1c [17]. However, the authors noted that the results should be interpreted with caution as the methodological quality of the majority of studies was limited. To comprehensively assess the effectiveness of SMBG in patients on OADs, the authors concluded that a large, randomised clinical trial with long-term follow-up would be necessary to measure quality of life, well-being, patient satisfaction and hypoglycemia.
No such randomised study has yet been published, although a large 4-year observational study of 16,091 patients initiating SMBG was released shortly after publication of the Welschen meta-analysis [18]. The study was based on the Kaiser Permanente diabetes registry in the US and contained over 30,000 patients in total, stratified by history of SMBG use, daily frequency of SMBG, type of diabetes and current treatment regimen. Of these, 5,867 patients were newly initiating SMBG and were on OADs only. In this subgroup, HbA1c reductions of 0.32%, 0.77% and 1.0% were observed in patients performing once daily, twice daily and three times daily SMBG respectively. Also of note was the observation of an HbA1c reduction of 0.16% in patients with a history of SMBG use who increased testing frequency by one strip per day. No additional HbA1c benefit was observed in patients performing SMBG more than three times per day.
Based on these real-world findings, we performed a health economic analysis designed to estimate the long-term clinical and cost outcomes associated with introducing regular SMBG as part of the management of type 2 diabetes patients not on insulin, in Switzerland.
Long-term health and economic outcomes associated with the use of SMBG were modelled using the CORE Diabetes Model, a validated and peer-reviewed computer simulation model of type 1 and 2 diabetes. A detailed description of the model and its validation has been published previously [19, 20]. In brief, the model comprises of 15 inter-dependent semi-Markov sub-models, each of which models the progression of a diabetes-related complication (including non-diabetes mortality). The complications modelled are angina, myocardial infarction, congestive heart failure, stroke, peripheral vascular disease, diabetic retinopathy, macular edema, cataract, hypoglyemia, ketoacidosis, lactic-acidosis, nephropathy, neuropathy, foot ulcer and amputation. Each sub-model simulates progression through complication-specific disease states using time-, state- and diabetes type-dependent transition probabilities sourced from numerous published clinical studies. Where clinical interactions between diabetes complications have been established, the corresponding sub-models are able to reproduce such interaction by tracker variable-mediated modification of transition probabilities. The model allows disease management and economic settings to be altered to reflect country-specific patterns of care.
The health economic analysis used a non-parametric bootstrapping approach, which modelled the progression of diabetes in a simulated 1,000-patient cohort. Second-order Monte Carlo simulation methods were employed to calculate the mean and standard deviation of costs, life expectancy and quality-adjusted life expectancy over 1,000 iterations [21]. Mean results from each iteration were used to create cost-effectiveness scatter plots which compared the differences in clinical and cost outcomes for patients using SMBG with those not using SMBG. These plots were then used to generate acceptability curves to assess the likelihood of SMBG being considered cost-effective over a range of willingness-to-pay thresholds up to CHF 120'000 per quality-adjusted life year (QALY) gained.
The model estimated the impact of SMBG on life expectancy, quality-adjusted life expectancy (based on previously published health utilities), cumulative event rates of diabetes-related complications, direct medical costs and incremental cost-effectiveness ratios (ICERs) over patient lifetimes, in line with health economic evaluation guidelines [19, 22].
The baseline characteristics of a hypothetical patient cohort were defined using the baseline demographics and complication status of type 2 diabetes patients on OADs initiating SMBG in a longitudinal study of SMBG by the Kaiser Permanente healthcare group [18]. Mean baseline age was 62.8 years and mean baseline HbA1c was 8.6%. These data were supplemented, where necessary, with patient-specific data from a previous Kaiser Permanente study in type 2 diabetes patients or with data from the type 2 diabetes subpopulation of the NHANES study population survey (table 1) [5, 23, 24]. The base case analysis presented here therefore reports outcomes for a patient cohort similar to that participating in the Kaiser Permanente studies in terms of clinical and demographic characteristics, but within Swiss settings.
Treatment effects in patients initiating SMBG versus those not using SMBG were taken from trial reports provided by Kaiser Permanente relating to the published study. The study reported SMBG use by average daily frequency ranging from 0.5 to 3 times daily in intervals of 0.5 tests per day. Frequencies of 0.5–1 times, 1.5–2 times and 2.5–3 times daily corresponded to HbA1c reductions of 0.32%, 0.77% and 1.0%, respectively, when compared with patients performing SMBG 0.5 times daily or less. It was conservatively assumed that the maximum testing frequency in each range was required to achieve the corresponding HbA1c improvement. Patients followed a treatment algorithm in line with published reports involving failure of OADs after five years and progression to an insulin-based regimen thereafter. Increased costs of treatment were accounted for after the treatment switch, although it was assumed that no further improvement in glycemic control would occur after initiation of insulin, despite the continuation of SMBG. In all cases, the HbA1c improvement associated with SMBG was applied in the first year of the simulation, after which HbA1c followed a natural progression based on the UKPDS Outcomes Model, in which HbA1c values converge with time [25].
Direct medical costs were expressed in 2006 Swiss Francs (CHF). Swiss unit costs were retrieved from published sources and those not expressed in 2006 CHF were inflated using indices from the Swiss Statistical Yearbook 2006, published by the Swiss Federal Statistical Office [26]. Where Swiss costs could not be identified, no costs were accounted for. Direct medical costs were calculated as the sum of drug acquisition costs, patient management costs and the cost of complications (table 2 and 3). In the absence of health utility data specific to the Swiss setting, utilities were taken primarily from the UKPDS and, where necessary, supplemented with type 2 diabetes-specific utilities as previously reported [19].
In all analyses, costs were accounted for from the perspective of a third-party healthcare payer. To capture lifetime costs and complications, the base case analysis was run over a time horizon of 30 years (with a mean baseline age of 62.8 years). Economic and health-related outcomes were discounted at 3% per annum in line with current recommendations [27].
A number of one-way sensitivity analyses were performed on key assumptions to assess the magnitude of their influence on outcomes in the once-daily base case. To address the question of attainable SMBG-associated HbA1c benefits, the HbA1c reduction associated with once-daily SMBG was varied from 25% to 150% of that observed in the Kaiser Permanente study (absolute HbA1c reductions of 0.08% and 0.48%, respectively), in 25% intervals. Assumptions around the subsequent maintenance of HbA1c improvement were investigated by running two sensitivity analyses using a linear annual HbA1c increase of 0.15% in both arms (hence maintaining the improvement applied to SMBG patients). This linear increase assumption was applied over the first five years of the analysis (simulating a maintained HbA1c benefit on OADs) and then over the full time horizon (simulating a maintained benefit on OADs and insulin). In both cases, these assumptions replaced the UKPDS regression formula used in the base case, in which HbA1c values in the two arms converge with time. The effect of the time horizon was then evaluated by reducing it from 30 years in the base case to between 5 and 25 years in the sensitivity analyses. The impact of clinical and cost discounting was assessed by varying it from 3% in the base case to 0% and 6%. To investigate the projected effect of SMBG in a Swiss cohort, a sensitivity analysis was performed in which baseline cohort data were taken from a retrospective cost study in type 2 diabetes patients in Switzerland [28]. Finally, the effect of varying SMBG frequency was also assessed by increasing frequency to twice and three times daily tests and accounting the associated costs and HbA1c benefit in line with the Kaiser Permanente study.
| Table 1 Baseline characteristics of the simulated patient cohort. | |||
| Characteristic | Mean value (+/- SD) | Reference | |
| Demographics | Age (years) | 62.8 (11.8) | 18 |
| Duration of diabetes (years) | 12 (0) | 24 | |
| Proportion male | 0.575 | 18 | |
| Baseline risk factors | HbA1c (%) | 8.6 (2) | 18 |
| SBP (mmHg) | 135 (0) | 24 | |
| Total cholesterol (mmol/L) | 5.43 (0) | 24 | |
| HDL (mmol/L) | 1.14 (0) | 24 | |
| LDL (mmol/L) | 3.15 (0) | 24 | |
| BMI (kg/m2) | 32 (0) | 24 | |
| Current smokers (%) | 21 | 24 | |
| Baseline cardiovascular complications | Prevalence of MI (%) | 10.8 | 24 |
| Prevalence of angina (%) | 11.2 | 24 | |
| Prevalence of PVD (%) | 14 | 24 | |
| Prevalence of stroke (%) | 8.8 | 24 | |
| Prevalence of HF (%) | 8.2 | 24 | |
| Prevalence of atrial fibrillation (%) | 0.75 | 24 | |
| Prevalence of LVH (%) | 4.2 | 24 | |
| Baseline renal complications | Prevalence of MA (%) | 28.2 | 24 |
| Prevalence of GPR (%) | 7.6 | 24 | |
| Prevalence of ESRD (%) | 0.4 | 24 | |
| Other baseline complications | Prevalence of BDR (%) | 39 | 24 |
| Prevalence of PDR (%) | 3 | 24 | |
| Prevalence of SVL (%) | 2.2 | 24 | |
| Prevalence of cataract (%) | 5.2 | 24 | |
| Prevalence of healed ulcer (%) | 10.5 | 24 | |
| Prevalence of amputation (%) | 2.6 | 24 | |
| Prevalence of neuropathy (%) | 40 | 24 | |
| Concomitant medications | Taking ACE inhibitor or ARB (%) | 25 | 24 |
| Taking statins (%) | 80 | Expert opinion | |
| ACE = angiotensin-converting enzyme; ARB = angiotensin receptor blocker; BDR = background diabetic retinopathy; BMI = body mass index; ESRD = end-stage renal disease; GPR = gross proteinuria; HbA1c = glycated haemoglobin; HDL = high density lipoprotein cholesterol; HF = heart failure; LDL = low density lipoprotein cholesterol; LVH = left ventricular hypertension; MA = microalbuminuria; MI = myocardial infarction; PDR = proliferative diabetic retinopathy; PVD = peripheral vascular disease; SBP = systolic blood pressure; SVL = severe vision loss | |||
| Table 2 Annual treatment costs in 2006 Swiss Francs. | ||
| SMBG frequency | Cost in year 1 (CHF) | Cost in years 2+ (CHF) |
| No SMBG | 1848.81 | 1848.81 |
| Once daily | 2479.39 | 2399.39 |
| Twice daily | 2962.47 | 2882.47 |
| Three times daily | 3445.54 | 3365.54 |
| Annual costs are based on Switzerland-specific costs for routine treatments and medications. CHF = Swiss Franc, 2006 values. | ||
| Table 3 Annual treatment costs in 2006 Swiss Francs. | |
| Complication | Cost (CHF) |
| Myocardial infarction, year of event | 19'930 |
| Myocardial infarction, each subsequent year | 2'638 |
| Angina, year of event | 10'799 |
| Angina, each subsequent year | 2'683 |
| Congestive heart failure, year of event | 13'341 |
| Congestive heart failure, each subsequent year | 13'341 |
| Stroke, year of event | 35'499 |
| Stroke, each subsequent year | 9'184 |
| Stroke death within 30 days | 4'321 |
| Haemodialysis, first year | 80'995 |
| Annual costs of haemodialysis, each subsequent year | 80'995 |
| Peritoneal dialysis, first year | 41'944 |
| Peritoneal dialysis, each subsequent year | 41'944 |
| Kidney transplant costs, first year | 85'504 |
| Kidney transplant, each subsequent year | 15'579 |
| Major hypoglycemic event | 4'379 |
| Minor hypoglycemic event | |
| Ketoacidosis event | 5'000 |
| Laser treatment for retinal photocoagulation | 1'459 |
| Cataract operation, year of operation | 4'902 |
| Annual cost following cataract operation | 118 |
| Annual cost of blindness | 5'064 |
| Neuropathy, year of onset | 2'011 |
| Neuropathy, each subsequent year | 2'011 |
| Amputation, year of event | 25'815 |
| Amputation, prosthesis | 3'366 |
| Gangrene treatment | 6'078 |
| Annual cost after healed ulcer | 181 |
| Infected ulcer | 5'180 |
| Standard uninfected ulcer | 2'002 |
| All costs from Brändle et al. 2009 [26]. CHF = Swiss Franc, 2006 values. | |
Use of once, twice or three times daily SMBG was projected to increase life expectancy and quality-adjusted life expectancy, and to reduce diabetes complications when compared with no SMBG in SMBG-naïve patients with type 2 diabetes on OADs (tables 4 and 5). Improvements in HbA1c associated with SMBG led to long-term benefits in projected, undiscounted life expectancy of 0.104, 0.235 and 0.311 years for once, twice and three times daily SMBG respectively versus no SMBG. Acquiring patients’ quality of life in the analysis also showed long-term benefits with SMBG. Incremental quality-adjusted outcomes were found to increase with frequency of SMBG, showing discounted quality-adjusted life expectancy of 0.058, 0.128 and 0.167 QALYs for SMBG performed once, twice and three times per day respectively compared with no SMBG.
Figure 1
Incremental cost-effectiveness scatter plots for SMBG once (A), twice (B) and three times daily (C) SMBG versus no SMBG. Cost-effectiveness acceptability curves for once, twice and three times daily SMBG versus no SMBG (D).
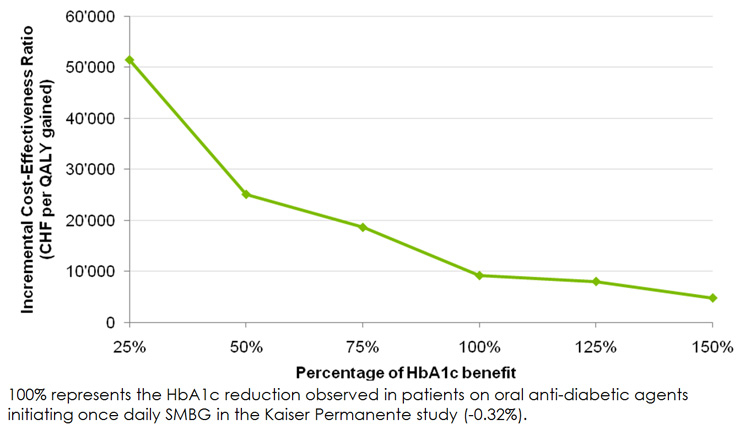
Figure 2
Incremental cost-effectiveness ratios for once daily SMBG versus no SMBG over a range of HbA1c benefits.
Increasing daily frequency of SMBG also led to decreased incidence of diabetes-related complications. The cumulative incidence of all complications projected over patient lifetimes are shown in table 5 for the base case and for twice and three times daily SMBG. Reductions in the incidence of both micro- and macrovascular complications were observed. For instance, background retinopathy was seen to decrease from 19.0% in patients not using SMBG to 15.2% in patients performing SMBG three times daily, while incidence of end-stage renal disease decreased by 33% (from 3.4% without SMBG to 2.2% in three times daily SMBG patients). A reduction in incidence was also observed across all macrovascular complications with the exception of stroke. For example, acute myocardial infarction was projected to decrease from 27.3% in patients not performing SMBG to 24.2% in three times daily SMBG patients. The projected increase in the cumulative incidence of stroke was likely due to the increased life expectancy of patients using SMBG, representing a survival paradox in which healthier patients are exposed to risk factors for longer and therefore experience more complication events.
SMBG, regardless of frequency, was associated with increased direct medical costs over patient lifetimes when compared with no SMBG (Table 6). Specifically, total costs increased by CHF 528, CHF 1'650 and CHF 2'899 in patients performing SMBG once, twice and three times daily respectively, when compared with those not performing SMBG. Pharmacy costs (including costs associated with SMBG) were markedly higher in patients using SMBG (CHF 2'203, CHF 4'150, and CHF 5'987 higher for once, twice and three times daily respectively compared with no SMBG), but this was partially offset by cost savings arising from reduced incidence of micro- and macrovascular complications, particularly renal complications (CHF –751, CHF –1'238 and CHF –1'474 respectively).
Estimated incremental cost-effectiveness ratios (ICERs; calculated as the difference in costs divided by the difference in effectiveness) were CHF 9'177, CHF 12'928 and CHF 17'342 per QALY gained for once, twice and three times daily SMBG respectively, indicating that the introduction of SMBG is likely to be cost-effective by generally accepted standards in Switzerland (table 6). Mean incremental cost and quality-adjusted life expectancy values from the 1,000 model iterations were used to generate scatter plots on the cost-effectiveness plane (figure 1 A, B and C). This analysis showed that the upper right quadrant of the plane contained the largest proportion of points (43.9%, 59.3% and 70.6% for once, twice and three times daily SMBG respectively), indicating increased effectiveness and costs associated with SMBG use when compared with no SMBG. Once daily, twice daily and three times daily SMBG was associated with both increased effectiveness and cost savings in 20.0%, 22.8% and 17.5% of model iterations, respectively. The same data were used to plot a cost-effectiveness acceptability curve to illustrate the proportion of values that fell below a range of willingness-to-pay thresholds and hence the likelihood that SMBG would be considered cost-effective (figure 1D). Assuming a willingness-to-pay threshold of CHF 80'000 per QALY, in line with a recently published analysis in the Swiss setting [29], there was a 66.8% chance that once daily SMBG would be cost-effective. This rose to 80.9% and 83.9% for twice and three times daily SMBG, respectively.
The sensitivity analyses demonstrated that projected outcomes were most sensitive to the time horizon of the simulation, the modelled HbA1c improvement and, to a lesser extent, the assumptions regarding progression of HbA1c (table 7). To assess the magnitude of the effect of HbA1c improvement on cost and effectiveness outcomes, a series of analyses were performed in which the HbA1c improvement was varied from 25% to 150% in 25% intervals, where 100% represented the HbA1c reduction observed in once daily SMBG patients in the Kaiser Permanente study. The ICERs from these analyses are presented in figure 2. The 25% “worst case” scenario gave an ICER of CHF 51'455 per QALY gained, which would still be considered cost-effective in the Swiss setting. The 150% scenario, which modelled an absolute HbA1c reduction of 0.48% in once daily SMBG users, resulted in a projected ICER of CHF 4'790 per QALY gained. Sensitivity analyses, in which the HbA1c progression was changed from the UKPDS regression formula to a linear increase of 0.15% per year, resulted in ICERs of CHF 9'990 per QALY (with the linear increase applied on both OADs and insulin) and CHF 10'046 per QALY (with the linear increase applied on OADs only and the UKPDS regression formula applied thereafter).
For time horizons less than 30 years, the corresponding ICERs were greater, but only exceeded CHF 80'000 per QALY in the five year scenario (table 7). The increase in ICER values at shorter time horizons was due to the reduced time period in which the benefits of lower HbA1c levels can be accounted. For example, any cost savings resulting from decreased incidence of complications that typically occur at later time points, such as myocardial infarction or end-stage renal disease, would not be captured over a five year time horizon. Varying discount rates to 0% and 6% had a minor effect on outcomes, changing the ICER by CHF –3'466 and CHF +5,293 per QALY respectively. Finally, the sensitivity analysis in which baseline cohort characteristics were taken from a Swiss cohort resulted in an ICER of CHF 12,056 per QALY gained, an increase of CHF 2'879 per QALY from the base case.
| Table 4 Summary of life expectancy results for once, twice and three times daily SMBG compared with no SMBG. | |||||||
| Outcome | No SMBG | 1x daily SMBG | Δ | 2x daily SMBG | Δ | 3x daily SMBG | Δ |
| Discounted life expectancy (years) | 8.139 (0.148) | 8.207 (0.153) | 0.068 (0.206) | 8.292 (0.157) | 0.153 (0.215) | 8.343 (0.161) | 0.204 (0.213) |
| Undiscounted life expectancy (years) | 10.155 (0.212) | 10.259 (0.218) | 0.104 | 10.390 (0.223) | 0.235 | 10.466 (0.233) | 0.311 |
| Discounted quality-adjusted life expectancy (QALYs) | 5.155 (0.095) | 5.212 (0.098) | 0.058 (0.133) | 5.283 (0.103) | 0.128 (0.139) | 5.322 (0.105) | 0.167 (0.140) |
| Undiscounted quality-adjusted life expectancy (QALYs) | 6.381 (0.133) | 6.464 (0.137) | 0.083 | 6.566 (0.143) | 0.185 | 6.623 (0.148) | 0.242 |
| Values are presented as mean (standard deviation). CHF = Swiss Franc, 2006 values; QALY = quality-adjusted life year | |||||||
| Table 5 Cumulative incidence of diabetes complications and complication-related mortality over patient lifetimes. | |||||||
| No SMBG | Once daily SMBG | Twice daily SMBG | Three times daily SMBG | ||||
| Complication | Incidence (%) | Incidence (%) | Δ | Incidence (%) | Δ | Incidence (%) | Δ |
| CHF event | 32.109 (1.507) | 31.225 (1.489) | –0.884 | 30.530 (1.549) | –1.579 | 30.108 (1.547) | –2.001 |
| PVD onset | 14.702 (1.207) | 13.769 (1.274) | –0.933 | 12.904 (1.135) | –1.798 | 12.483 (1.169) | –2.219 |
| Angina | 18.791 (1.257) | 18.308 (1.343) | –0.483 | 17.779 (1.274) | –1.012 | 17.742 (1.309) | –1.049 |
| Stroke event | 22.924 (1.288) | 23.238 (1.302) | +0.314 | 23.537 (1.384) | +0.613 | 23.603 (1.380) | +0.679 |
| MI event | 27.342 (1.415) | 26.154 (1.317) | –1.188 | 24.994 (1.374) | –2.348 | 24.249 (1.361) | –3.093 |
| MA | 31.266 (1.764) | 28.972 (1.803) | –2.294 | 26.766 (1.726) | –4.500 | 25.642 (1.743) | –5.624 |
| GRP | 12.292 (1.028) | 10.973 (1.006) | –1.319 | 9.637 (0.939) | –2.655 | 9.149 (0.941) | –3.143 |
| ESRD | 3.351 (0.578) | 2.797 (0.504) | –0.554 | 2.407 (0.491) | –0.944 | 2.231 (0.433) | –1.120 |
| BDR | 19.049 (1.708) | 17.398 (1.589) | –1.651 | 15.937 (1.548) | –3.112 | 15.221 (1.461) | –3.828 |
| PDR | 2.297 (0.474) | 2.102 (0.465) | –0.195 | 1.891 (0.425) | –0.406 | 1.757 (0.425) | –0.540 |
| ME | 14.758 (1.141) | 13.380 (1.078) | –1.378 | 12.250 (1.027) | –2.508 | 11.651 (1.010) | –3.107 |
| SVL | 8.427 (0.927) | 7.855 (0.883) | –0.572 | 7.364 (0.785) | –1.063 | 7.082 (0.804) | –1.345 |
| Cataract | 7.247 (0.847) | 6.998 (0.961) | –0.259 | 6.724 (0.779) | –0.523 | 6.636 (0.791) | –0.611 |
| Values are presented as mean (SD). Δ represents the difference from no SMBG. BDR = background diabetic retinopathy; CHF = congestive heart failure; ESRD = end-stage renal disease; GRP = gross proteinuria; LDL = low density lipoprotein cholesterol; LVH = left ventricular hypertension; MA = microalbuminuria; ME = macular edema; MI = myocardial infarction; PDR = proliferative diabetic retinopathy; PVD = peripheral vascular disease; SVL = severe vision loss | |||||||
| Table 6 Summary of cost and cost-effectiveness results for once, twice and three times daily SMBG compared with no SMBG. | |||||||
| Outcome | No SMBG | 1x daily SMBG | Δ | 2x daily SMBG | Δ | 3x daily SMBG | Δ |
| Treatment (CHF) | 24'651 | 26'854 | +2,203 | 28'801 | +4,150 | 30'638 | +5'987 |
| Management (CHF) | 7'757 | 7'785 | +28 | 7'842 | +85 | 7'864 | +107 |
| CVD (CHF) | 46'607 | 46'199 | –408 | 45'979 | –628 | 45'756 | –851 |
| Renal (CHF) | 5'200 | 4'449 | –751 | 3'962 | –1,238 | 3'726 | –1'474 |
| Ulcer, amputation and neuropathy (CHF) | 28'353 | 28'013 | –-340 | 27'914 | –439 | 27'835 | –513 |
| BDR, PDR, ME and SVL (CHF) | 3'459 | 3'334 | –125 | 3'177 | –282 | 3'108 | 351 |
| Hypoglycemia (CHF) | 33 | 33 | 34 | +1 | 32 | –1 | |
| Total lifetime costs (CHF) | 116'059 | 116'587 | +528 | 117'709 | +1,650 | 118'958 | +2'899 |
| ICER (CHF/year) | – | 7'731 | – | 10'706 | – | 14'229 | – |
| ICER (CHF/QALY) | – | 9'177 | – | 12'928 | – | 17'342 | – |
| Costs are presented as mean (standard deviation). BDR = background diabetic retinopathy; CHF = Swiss Franc, 2006 values; CVD = cardiovascular disease; ICER = incremental cost-effectiveness ratio; ME = macular edema; PDR = proliferative diabetic retinopathy; QALY = quality-adjusted life year; SVL = severe vision loss. | |||||||
| Table 7 Summary of sensitivity analysis results for once daily SMBG versus no SMBG. | ||||||||
| Sensitivity analysis | Quality-adjusted life expectancy (QALYs) | Direct costs (CHF) | ICER (CHF per QALY gained) | |||||
| 1x daily SMBG | No SMBG | Difference | 1x daily SMBG | No SMBG | Difference | 1x daily SMBG versus no SMBG | Difference from base case | |
| Base case | 5.212 (0.098) | 5.155 (0.095) | 0.058 (0.133) | 116'587 (3,364) | 116'059 (3,308) | 528 (4,503) | 9,177 | N/A |
| 5 year time horizon | 2.596 (0.030) | 2.586 (0.031) | 0.010 (0.041) | 41'998 (1,169) | 40'521 (12,84) | 1,477 (1,641) | 145,239 | +136,062 |
| 10 year time horizon | 4.107 (0.061) | 4.074 (0.063) | 0.033 (0.083) | 77'468 (2,007) | 76'713 (1,916) | 755 (2,670) | 22,968 | +13,791 |
| 15 year time horizon | 4.820 (0.075) | 4.769 (0.083) | 0.050 (0.103) | 99'507 (2,566) | 98'650 (2,702) | 857 (3,543) | 17,038 | +7,861 |
| 20 year time horizon | 5.099 (0.092) | 5.031 (0.093) | 0.068 (0.122) | 110'544 (2,935) | 109'550 (2,992) | 994 (3,830) | 14,551 | +5,374 |
| 25 year time horizon | 5.190 (0.099) | 5.121 (0.101) | 0.069 (0.131) | 115'151 (3,275) | 114'182 (3,158) | 969 (4,404) | 13,976 | +4,799 |
| 0% discount rates | 6.464 (0.137) | 6.381 (0.133) | 0.083 (0.188) | 153'765 (4,922) | 153'290 (4,807) | 475 (6,604) | 5,711 | -3,466 |
| 6% discount rates | 4.329 (0.074) | 4.287 (0.072) | 0.042 (0.100) | 91'857 (2,461) | 91'256 (2,446) | 602 (3,297) | 14,470 | +5,293 |
| 0.08% HbA1c reduction | 5.181 (0.098) | 5.155 (0.095) | 0.026 (0.127) | 117'413 (3,215) | 116'059 (3,308) | 1,354 (4,132) | 51,455 | +42,278 |
| 0.16% HbA1c reduction | 5.193 (0.098) | 5.155 (0.095) | 0.038 (0.130) | 117'023 (3,256) | 116'059 (3,308) | 964 (4,394) | 25,088 | +15,911 |
| 0.24% HbA1c reduction | 5.202 (0.099) | 5.155 (0.095) | 0.047 (0.132) | 116'934 (3,207) | 116'059 (3,308) | 875 (4,383) | 18,615 | +9,438 |
| 0.40% HbA1c reduction | 5.227 (0.103) | 5.155 (0.095) | 0.072 (0.141) | 116'638 (3,347) | 116'059 (3,308) | 579 (4,565) | 8,014 | -1,163 |
| 0.48% HbA1c reduction | 5.238 (0.107) | 5.155 (0.095) | 0.083 (0.142) | 116'457 (3,343) | 116'059 (3,308) | 398 (4,632) | 4,790 | -4,387 |
| Swiss cohort | 5.583 (0.104) | 5.502 (0.114) | 0.081 (0.144) | 96'001 (2,714) | 95'023 (3,000) | 978 (3,895) | 12,056 | +2,879 |
| Maintained HbA1c benefit on OADs and insulin | 5.151 (0.098) | 5.042 (0.088) | 0.109 (0.129) | 118'635 (3,142) | 117'542 (3,400) | 1,093 (4,588) | 9,990 | +813 |
| Maintained HbA1c benefit on OADs | 5.186 (0.101) | 5.095 (0.094) | 0.090 (0.133) | 117'536 (3,310) | 116'630 (3,243) | 906 (4,336) | 10,046 | +869 |
| CHF = Swiss Franc, 2006 values; HbA1c = glycated haemoglobin; ICER = incremental cost-effectiveness ratio; QALY = quality-adjusted life year. | ||||||||
Based on clinical data from the Kaiser Permanente outcomes study, the use of SMBG in type 2 diabetes patients on OADs was projected to increase life expectancy and quality-adjusted life expectancy, and to reduce diabetes complications in a Swiss setting compared with no SMBG. Direct costs were projected to increase at any frequency of SMBG, although the greatest cost increase of CHF 2'899, observed in patients performing SMBG three times daily, resulted in an ICER of CHF 17'342 per QALY, representing good value for money according to commonly quoted willingness-to-pay thresholds in Switzerland.
In light of the results of the present analysis, it is important to note that the purported benefits of SMBG in terms of glycemic control remain controversial in type 2 diabetes patients treated with OADs. As has been noted previously, the process of simply measuring blood glucose is ineffective in terms of improving clinical outcomes [8, 3]. Rather, SMBG provides information that can subsequently inform changes in treatment protocols and, potentially, lead to improved glycemic control. A number of meta-analyses investigating SMBG have reported statistically significant HbA1c reductions of between 0.16% and 0.4% in orally-treated patients performing SMBG compared with those not performing SMBG [17, 31–35]. However, as Welschen et al.reported, there is considerable inter-trial heterogeneity with regard to the included interventions and patient populations. Methodological concerns regarding the within-trial treatment allocation and provision of patient education were also cited as potential caveats.
Some of the inter-trial variability observed in the SMBG meta-analyses might be explained by the differences observed between new and prevalent users of SMBG in the Kaiser Permanente study. Pooling of users initiating SMBG with prevalent users is likely to bias outcomes depending on the proportion of each user group in the final cohort, data that are rarely reported, even in SMBG-focused studies. Reassuringly however, sensitivity analyses using a reduction of only 0.08% in HbA1c demonstrated that SMBG was still cost-effective versus no SMBG.
Furthermore, a recent systematic review and meta-analysis by Allemann et al. showed that SMBG use was associated with a larger reduction in HbA1c than no SMBG in non-insulin treated type 2 diabetes patients [36]. The analysis, which was based on 15 randomised trials including a total of 3,270 patients, reported a weighted mean difference of –0.31% between SMBG and no SMBG (95% confidence interval -0.44 to -0.17), which was 0.01% less than the reduction reported in the Kaiser Permanente study which formed the basis of the present analysis. The Allemann et al. meta-analysis also noted that the effect of SMBG use on HbA1c tended to be greatest in patients with poor glycemic control, a sub-population in which reimbursement of SMBG strips would likely represent excellent value for healthcare spending. Finally, Allemann et al.reported an increased probability of detection of hypoglycemia in SMBG users, leading to potential improvements in safety and compliance in addition to the reported benefits in glycemic control.
Another recent study, reported by Farmer et al., was based on the DiGEM primary care randomised controlled trial and lacked many of the confounding factors present in the meta-analyses [30]. The study reported a decrease in HbA1c of 0.17% over 12 months in the intensive self-monitoring group compared with no change in the control group, but the result was shown to not be statistically significant (p = 0.12). However, Farmer and colleagues’ study highlights some of the difficulties associated with assessing the impact of SMBG in a randomised controlled trial environment. With regard to the DiGEM study, for example, the criterion requiring baseline HbA1c less than 7.5% combined with a higher standard of care in the control group than is typical outside a clinical trial setting may have limited the apparent benefits of SMBG in this population. Other randomised trials investigating SMBG suffer from additional limitations. Davidson et al., for example, present a study in which patients from both arms were titrated according to fasting plasma glucose levels. In this case, an insignificant inter-arm difference in HbA1c levels after six months would be anticipated, regardless of SMBG use [15]. Similarly, O’Kane and colleagues recently presented the results of a randomised controlled trial in which patients in both arms were treated using an HbA1c target of 7.5%, by increasing metformin dose up to a maximum of 2g per day, then initiating patients on gliclazide up to 320 mg per day and finally initiating TZDs or insulin [16]. As in the Davidson study, patients being treated using an HbA1c target-based algorithm in the controlled setting of a clinical trial would be unlikely to see any benefit of SMBG relative to patients not using SMBG, but being treated in the same setting using the same algorithm. Observational studies are, therefore, an important data source reporting the efficacy associated with “everyday” use of SMBG.
The “break even” analysis presented in Figure 2 was designed to address the uncertainty regarding the magnitude of HbA1c benefit associated with SMBG. The aforementioned “worst case” scenario, which assumed an absolute HbA1c reduction of 0.08%, resulted in an ICER of CHF 51'455 per QALY gained, falling below even relatively stringent willingness-to-pay thresholds in the Swiss setting. However, a number of potential weaknesses of this cost-effectiveness analysis should be considered. The input data regarding SMBG-related HbA1c benefits were derived from an observational study rather than a randomised controlled trial or meta-analysis. Despite the study’s robust design and execution and the use of a “real world” setting as opposed to a trial environment, potential sources of bias remain, as acknowledged by Karter et al. [18] Firstly, the difference in baseline glycemic control between initiators of SMBG (baseline HbA1c of 8.6%) and the reference group (7.3%) may suggest reverse causality in that the difference may have led to changes in exposure to SMBG rather than vice versa. Second, the level of SMBG-centred patient education or instruction was unknown to the researchers. Finally, the lack of available data regarding changes in medication dose may have, for example, incorrectly attributed to OAD-driven improvement of glycemic control to SMBG, a situation that may have arisen in patients who simultaneously initiated SMBG and an intensified course of oral anti-diabetic agents. While the Karter et al. study, like all observational studies, was potentially subject to a range of additional confounding factors, the comprehensive nature of the Kaiser Permanente database allowed the researchers to adjust for patients’ diabetes self-care practices, medication adherence, and lifestyle behaviours, each of which could be independently associated with monitoring frequency. Adjusting for these variables resulted in only minimal changes in the point estimates for the effect of SMBG, demonstrating that the relationship with improved glycemic control was robust in this patient group.
A potential weakness of the present analysis was the omission of quality of life utilities associated directly with the process of SMBG. Currently, evidence surrounding such utilities is conflicting. The Welschen et al. meta-analysis of SMBG in diabetes patients not using insulin found two studies that reported quality of life outcomes [17]. Muchmore et al. used the Diabetes Quality-of-Life Inventory to assess the satisfaction, impact and worry (diabetes-related and social/vocational) quality of life dimensions in 23 obese, type 2 diabetes patients. The study reported no statistically significant differences in quality of life at 0, 24 or 44 weeks between the intervention and control groups [37]. The second study, by Schwedes et al., reported outcomes from the Patient Well-Being Questionnaire and the Diabetes Treatment Satisfaction Questionnaire in 223 patients (113 performing SMBG and 110 control subjects who received diet and lifestyle counselling) across multiple centres in Germany and Austria. The study reported similar increases in treatment satisfaction in both groups and a marked improvement in well-being in the patients performing SMBG (across all items in the Patient Well-Being Questionnaire) [38]. Conversely, Franciosi et al. reported that in a group of 2,968 Italian type 2 diabetes patients not using insulin, those performing SMBG at least once daily (n = 471) experienced significantly higher levels of distress, worry and depressive symptoms than those performing less frequent SMBG (n = 1,313) or no SMBG at all (n = 1,071) [39]. Should definitive data on changes in quality of life associated directly with SMBG be published in the future, it will be important to revisit the findings of the present analysis in the context of the new utility data.
The strengths of this cost-effectiveness analysis include the use of clinically relevant treatment effects and the use of country-specific costs to generate the most realistic assessment possible based upon currently available evidence. The sensitivity analysis in which a Swiss-specific cohort was modelled increased the ICER by CHF 2'879 per QALY for once daily SMBG, suggesting that the results would also be applicable in the Swiss setting. The recently reported Kaiser Permanente study is one of very few studies that have attempted to quantify the relationship between frequency of SMBG and glycemic control in defined patient groups with type 2 diabetes. Given the direct relationship between frequency of SMBG and the cost of this practice, demonstration of the health-economic impact of increasing testing frequency is of particular importance when making general health policy decisions. By using a validated model of diabetes to project the results from this large-scale observational study over patient lifetimes, we have demonstrated that, for type 2 diabetes patients treated with OADs and newly initiating SMBG, SMBG at a frequency of once, twice or three times per day would likely be considered cost-effective compared to no SMBG. Therefore concerns regarding the initial cost of implementing SMBG should not be a barrier to providing this intervention to SMBG-naïve, type 2 diabetes patients treated with OADs in Switzerland.
1 IDF Diabetes Atlas. Executive Summary. 2009 (last accessed May 31 2010); Fourth Edition. Available from: http://www.diabetesatlas.org/content/executive-summary
2 Firmann M, Mayor V, Vidal PM, Bochud M, Pécoud A, Hayoz D, Paccaud F, Preisig M, Song KS, Yuan X, Danoff TM, Stirnadel HA, Waterworth D, Mooser V, Waeber G, Vollenweider P. The CoLaus study: a population-based study to investigate the epidemiology and genetic determinants of cardiovascular risk factors and metabolic syndrome. BMC Cardiovasc Disord. 2008;8:6.
3 Nyomba BL, Berard L, Murphy LJ. Facilitating access to glucometer reagents increases blood glucose self-monitoring frequency and improves glycaemic control: a prospective study in insulin-treated diabetic patients. Diabet Med. 2004;21(2):129–35.
4 The Diabetes Control and Complications Trial Research Group. The effect of intensive treatment of diabetes on the development and progression of long-term complications in insulin-dependent diabetes mellitus. N Engl J Med. 1993;329(14):977–86.
5 Karter AJ, Ackerson LM, Darbinian JA, D'Agostino RB Jr, Ferrara A, Liu J, Selby JV. Self-monitoring of blood glucose levels and glycemic control: the Northern California Kaiser Permanente Diabetes registry. Am J Med. 2001;111(1):1–9.
6 Nathan DM, McKitrick C, Larkin M, Schaffran R, Singer DE. Glycemic control in diabetes mellitus: have changes in therapy made a difference? Am J Med. 1996;100(2):157–63.
7 Ipp E, Aquino RL, Christenson P. Point: self-monitoring of blood glucose in type 2 diabetic patients not receiving insulin: the sanguine approach. Diabetes Care 2005;28(6):1528–1530.
8 Davidson MB. Counterpoint: Self-monitoring of blood glucose in type 2 diabetic patients not receiving insulin: a waste of money. Diabetes Care. 2005;28(6):1531–3.
9 Mittel- und Gegenstandsliste Bundesamt für Gesundheit (last accessed February 14, 2010). http://www.bag.admin.ch/themen/krankenversicherung/00263/00264/04184/
10 Fontbonne A, Billault B, Acosta M, Percheron C, Varenne P, Besse A, Eschwege E, Monnier L, Slama G, Passa P. Is glucose self-monitoring beneficial in non-insulin-treated diabetic patients? Results of a randomized comparative trial. Diabete Metab. 1989;15(5):255–60.
11 Muchmore DB, Springer J, Miller M. Self-monitoring of blood glucose in overweight type 2 diabetic patients. Acta Diabetol. 1994;31(4):215–9.
12 Allen BT, DeLong ER, Feussner JR. Impact of glucose self-monitoring on non-insulin-treated patients with type II diabetes mellitus. Randomized controlled trial comparing blood and urine testing. Diabetes Care. 1990;13(10):1044–50.
13 Schwedes U, Siebolds M, Mertes G; SMBG Study Group. Meal-related structured self-monitoring of blood glucose: effect on diabetes control in non-insulin-treated type 2 diabetic patients. Diabetes Care. 2002;25(11):1928–32.
14 Guerci B, Drouin P, Grangé V, Bougnères P, Fontaine P, Kerlan V, Passa P, Thivolet Ch, Vialettes B, Charbonnel B; ASIA Group. Self-monitoring of blood glucose significantly improves metabolic control in patients with type 2 diabetes mellitus: the Auto-Surveillance Intervention Active (ASIA) study. Diabetes Metab. 2003;29(6):587–94.
15 Davidson MB, Castellanos M, Kain D, Duran P. The effect of self monitoring of blood glucose concentrations on glycated hemoglobin levels in diabetic patients not taking insulin: a blinded, randomized trial. Am J Med. 2005;118(4):422–5.
16 O'Kane MJ, Bunting B, Copeland M, Coates VE; ESMON study group. Efficacy of self monitoring of blood glucose in patients with newly diagnosed type 2 diabetes (ESMON study): randomised controlled trial. BMJ. 2008;336(7654):1174–7.
17 Welschen LM, Bloemendal E, Nijpels G, Dekker JM, Heine RJ, Stalman WA, Bouter LM. Self-monitoring of blood glucose in patients with type 2 diabetes who are not using insulin: a systematic review. Diabetes Care. 2005;28(6):1510–7.
18 Karter AJ, Parker MM, Moffet HH, Spence MM, Chan J, Ettner SL, Selby JV. Longitudinal study of new and prevalent use of self-monitoring of blood glucose. Diabetes Care. 2006;29(8):1757–63.
19 Palmer AJ, Roze S, Valentine WJ, Minshall ME, Foos V, Lurati FM, Lammert M, Spinas GA. The CORE Diabetes Model: Projecting long-term clinical outcomes, costs and cost-effectiveness of interventions in diabetes mellitus (types 1 and 2) to support clinical and reimbursement decision-making. Curr Med Res Opin. 2004;20 Suppl 1:S5–26.
20 Palmer AJ, Roze S, Valentine WJ, Minshall ME, Foos V, Lurati FM, Lammert M, Spinas GA. Validation of the CORE Diabetes Model against epidemiological and clinical studies. Curr Med Res Opin. 2004;20 Suppl 1:S27–40.
21 Briggs AH, Wonderling DE, Mooney CZ. Pulling cost-effectiveness analysis up by its bootstraps: a non-parametric approach to confidence interval estimation. Health Econ 1997; 6(4): 327–340.
22 NICE. National Institute for Health and Clinical Excellence. Guide to the Methods of Technology Appraisal. http://www.nice.org.uk/niceMedia/pdf/TAP_Methods.pdf 2004 (last accessed May 24, 2009).
23 Saaddine JB, Cadwell B, Gregg EW, Engelgau MM, Vinicor F, Imperatore G, Narayan KM. Improvements in diabetes processes of care and intermediate outcomes: United States, 1988–2002. Ann Intern Med. 2006 ;144(7):465–74.
24 Harris MI. Health care and health status and outcomes for patients with type 2 diabetes. Diabetes Care. 2000;23(6):754–8.
25 Clarke PM, Gray AM, Briggs A, Farmer AJ, Fenn P, Stevens RJ, Matthews DR, Stratton IM, Holman RR and UK Prospective Diabetes Study (UKDPS) Group. A model to estimate the lifetime health outcomes of patients with type 2 diabetes: the United Kingdom Prospective Diabetes Study (UKPDS) Outcomes Model (UKPDS no. 68). Diabetologia. 2004;47(10):1747–59.
26 Brändle M, Erny-Albrecht KM, Goodall G, Spinas GA, Streit P, Valentine WJ. Exenatide versus insulin glargine: A Cost-effectiveness Evaluation in Patients with type 2 diabetes in Switzerland. Int J Clin Pharmacol Ther. 2009;47(8):501–15.
27 Tarn T, Smith M. Pharmacoeconomic Guidelines Around the World. ISPOR Connections. 2004 10(4): 5–15.
28 Schmitt-Koopmann I, Schwenkglenks M, Spinas GA, Szucs TD. Direct medical costs of type 2 diabetes and its complications in Switzerland. Eur J Public Health. 2004;14(1):3–9.
29 Brändle M, Goodall G, Erny-Albrecht KM, Erdmann E, Valentine WJ. Cost-effectiveness of pioglitazone in patients with type 2 diabetes and a history of macrovascular disease in a Swiss setting. Swiss Med Wkly. 2009;139(11–12):173–84.
30 Farmer A, Wade A, Goyder E, Yudkin P, French D, Craven A, Holman R, Kinmonth AL, Neil A. Impact of self monitoring of blood glucose in the management of patients with non-insulin treated diabetes: open parallel group randomised trial. BMJ. 2007;335(7611):132.
31 Coster S, Gulliford MC, Seed PT, Powrie JK, Swaminathan R. Self-monitoring in Type 2 diabetes mellitus: a meta-analysis. Diabet Med. 2000;17(11):755–61.
32 Sarol JN Jr, Nicodemus NA Jr, Tan KM, Grava MB. Self-monitoring of blood glucose as part of a multi-component therapy among non-insulin requiring type 2 diabetes patients: a meta-analysis (1966–2004). Curr Med Res Opin. 2005;21(2):173–84.
33 Jansen JP. Self-monitoring of glucose in type 2 diabetes mellitus: a Bayesian meta-analysis of direct and indirect comparisons. Curr Med Res Opin. 2006;22(4):671–81.
34 Towfigh A, Romanova M, Weinreb JE, Munjas B, Suttorp MJ, Zhou A, Shekelle PG. Self-monitoring of blood glucose levels in patients with type 2 diabetes mellitus not taking insulin: a meta-analysis. Am J Manag Care. 2008;14(7):468–75.
35 St John A, Davis WA, Price CP, Davis TM. The value of self-monitoring of blood glucose: a review of recent evidence. J Diabetes Complications. 2010 ;24(2):129–41.
36 Allemann S, Houriet C, Diem P, Stettler C. Self-monitoring of blood glucose in non-insulin treated patients with type 2 diabetes: a systematic review and meta-analysis. Curr Med Res Opin. 2009;25(12):2903–13.
37 Muchmore DB, Springer J, Miller M. Self-monitoring of blood glucose in overweight type 2 diabetic patients. Acta Diabetol. 1994;31:215–219.
38 Schwedes U, Siebolds M, Mertes G. Meal-related structured self-monitoring of blood glucose: effect on diabetes control in non-insulin-treated type 2 diabetic patients. Diabetes Care. 2002;25:1928–32.
39 Franciosi M, Pellegrini F, De Berardis G, Belfiglio M, Cavaliere D, Di Nardo B, Greenfield S, Kaplan SH, Sacco M, Tognoni G, Valentini M, Nicolucci A; QuED Study Group. The impact of blood glucose self-monitoring on metabolic control and quality of life in type 2 diabetic patients: an urgent need for better educational strategies. Diabetes Care. 2001;24(11):1870–7.
This study was supported by an unrestricted grant from the Schweizerische Diabetes-Gesellschaft. GG provided the data. RP ran the analyses and RP, WV and MB prepared the manuscript.