Laser scanning microscopy combined with image restoration to analyse a 3D model of the human epithelial airway barrier
DOI: https://doi.org/10.4414/smw.2010.13060
B
Rothen-Rutishauser, AD
Lehmann, MJ
Clift, F
Blank, P
Gehr
Summary
A laser scanning microscope collects information from a thin, focal plane and ignores out of focus information. During the past few years it has become the standard imaging method to characterise cellular morphology and structures in static as well as in living samples. Laser scanning microscopy combined with digital image restoration is an excellent tool for analysing the cellular cytoarchitecture, expression of specific proteins and interactions of various cell types, thus defining valid criteria for the optimisation of cell culture models. We have used this tool to establish and evaluate a three dimensional model of the human epithelial airway wall.
Abbreviations
LSM Laser scanning microscopy
3D Three dimensional
GFP Green fluorescent proteins
QDs Quantum dots
MDM Monocyte-derived macrophages
MDDC Monocyte-derived dendritic cells
Introduction
Laser scanning microscopy (LSM), also described as confocal LSM, is a valuable tool for obtaining high spatial resolution and three dimensional (3D) reconstruction of specific fluorescently labelled structures at the light microscopic level [1]. During the past few years it has become the standard imaging method to characterise cellular morphology and structures in static as well as in living samples. LSM combined with digital image restoration is an excellent tool for analysing the cellular cytoarchitecture, expression of specific proteins and interactions of various cell types, thus defining valid criteria for the optimisation of cell culture models [2–4].
Not only the simple combination of different cell types in culture but also the structure in the correct 3D arrangement is important. Therefore, culture models in 3D matrices have been developed representing a more physiologically relevant situation, such as the mimicking of tissues [4]. This is of great significance to the outcome of the examination, as, in respect to the model [4], cells of the lung continuously cross-talk in vivo via intercellular signalling [5]. Recently, a triple cell co-culture system has been established and evaluated, forming a 3D model of the human epithelial airway wall composed of epithelial cells, monocyte-derived macrophages (MDM) and dendritic cells (MDDC) [4]. Since this model consists of several cell layers (i.e., >10 µm) observation of cells by LSM combined with digital image restoration is an optimal tool for the characterisation [6].
The principle of LSM
The principle of LSM was patented by Marvin Minsky in 1957 [7] and aimed to overcome some of the limitations of conventional (i.e., wide-field) fluorescence microscopy. In a conventional fluorescence microscope the entire specimen is illuminated from a light source. All parts of the specimen in the optical path are excited and the resulting fluorescence is detected, which nowadays is commonly via a CCD (charge-couple device) camera (fig. 1a). In contrast to conventional fluorescence microscopy, a laser scanning microscope uses a point illumination (i.e., a laser beam) and a pinhole in an optically conjugate plane in front of the detector to eliminate the out of focus information – from this configuration the term “confocal” has been defined. As only light produced by fluorescence very close to the focal plane can be detected, the image resolution, particularly in the sample depth direction, is heightened compared to that of conventional microscopes. This is also dependent on the size of the pinhole (fig. 1b). The key feature of LSM is its ability to produce blur-free images by discarding the out of focus information of thick specimens at various depths because of depth discrimination in fluorescently labelled samples [8]. Furthermore, the axial (z-axis), as well as the lateral resolution are significantly improved if the confocal pinhole is sufficiently small [9]. Due to its improved axial resolution, the LSM is able to record optical sections through the specimen [7, 10].
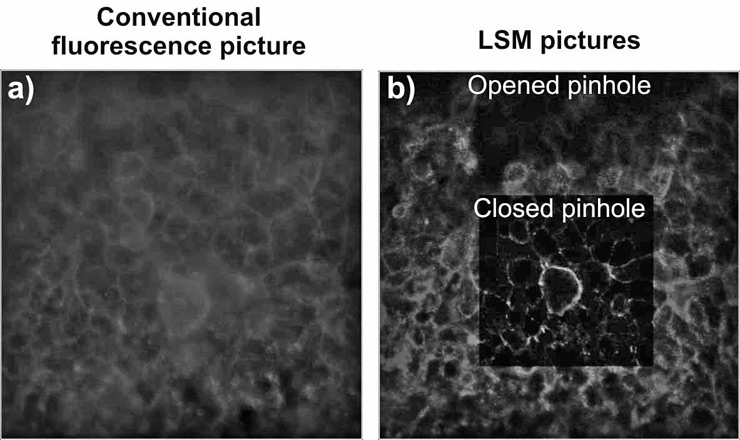
Figure 1
Comparison of conventional fluorescence microscopy and LSM. Epithelial cells (16HBE14o-) were grown to confluence and then fixed and stained for F-Actin (Phalloidin-Rhodamine). a) A micrograph taken with a CCD camera is represented,
b) shows two pictures taken with Zeiss 510 Meta laser scanning microscope using either an opened pinhole or a closed pinhole. All pictures were taken from the same region.
Images are acquired point by point and as only one point in the sample is collected at a time, two dimensional or 3D imaging require scanning over a regular raster in the specimen. The thickness of the focal plane is defined mostly by the inverse of the square of the numerical aperture of the objective lens and also by the optical properties of the specimen and the ambient index of refraction. A 3D confocal data set is recorded plane by plane and because structures are not readily accessible by looking at individual sections, image visualisation and restoration then needs to be done using a 3D multi-channel image processing software [11].
Digital image restoration
Bleed through and cross-talk is often an issue in specimens labelled with multiple fluorescent proteins. Improvements can be made by imaging different channels sequentially rather than simultaneously. Therefore, for an optimal sampling of the signals by the LSM, the channels for each fluorochrome are separated (i.e., lasers, filters and detector settings). After sampling, individual pictures need to be combined and, in addition, noisy and blurred images can be restored on the basis of mathematical models. In addition, 3D reconstructions are made from Z-series of confocal images.
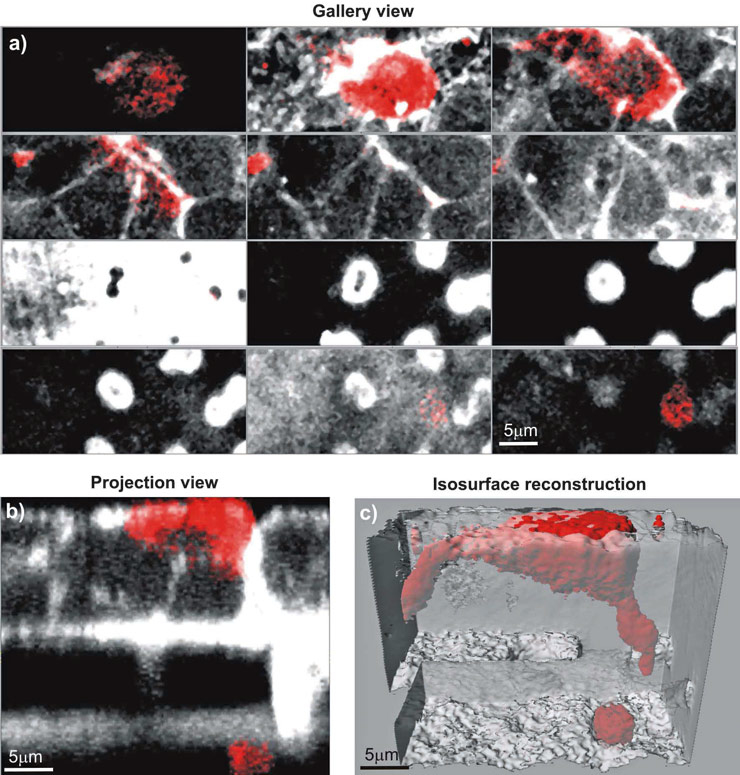
Figure 2
Visualisation modes of LSM 3D data stacks. Epithelial cells (16HBE14o-) and MDM were co-cultured, fixed and stained for F-actin (Phalloidin-rhodamine, white). Additionally, the MDM were stained for CD14, a specific surface marker (red). The cultures were observed with a Zeiss 510 Meta laser scanning microscope at a Z-interval of 0.3 µm, resulting in total 70 layers. Various visualisation modes using the IMARIS software from Bitplane AG are presented to show the spatial arrangement of the MDM and the epithelial cells. a) Gallery view, showing every 8th layer, b) Projection view across the xz-axes, c) an iso-surface rendering with a transparent epithelium.
The obtained images can be corrected for imaging errors that arise during data recoding
and some basic processing routines [12] can be
employed, such as:
– Baseline: A user-defined constant value from all voxel values (i.e., a volume element representing a value in 3D space) is subtracted to negate the electronic noise generated by the photo-multipliers.
– Contrast stretch: This tool can be used to adapt the range of intensities used to user defined boundaries in order to optimise the contrast.
– Gamma correction: This function recalculates the range of grey values in the image. The new range values will be evaluated using non-linear mapping. If the correction factor is below 1, the remapping will be achieved using a logarithmic table enhancing the lower intensities. If the correction factor is above 1, the correction uses an exponential table enhancing the high intensities and attenuating the lower ones.
– 3D noise filters: The median is useful to remove heavy bright noise in the images and preserve the high frequencies and it gives better results for very noisy images. The low pass Filter can be used to remove noise in the image. All high frequencies are attenuated. The routine has a blurring effect on the image with the aim to remove noise (high frequencies).
– Deconvolution: This image restoration package [13] will remove blur from the images, improve resolution and noise. It is especially important for the analysis of stacks in the
orientation of the z-axis.
It is very important to know what is done with the data in order to come to a correct interpretation and to record an optimal signal with the LSM rather than having to do too much data processing afterwards.
Not only is the signal optimisation important but also the visualisation of the data. We routinely employ various 3D visualisation techniques for analysing LSM data sets depending on the question addressed. For example, the gallery view (fig. 2a) displays all defined slice images of the data set. Another example is the projection view (fig. 2b), which allows the data set to be cut and portions to be defined in the x-, y-, and z-axes. Both visualisation tools are very rapid, simple and are not computer intensive. It does not need special software since most acquisition software can store the individual layers or the projections as a single image.
More advanced software packages [11] allow the user to make volume renderings or iso-surface reconstructions, thus providing true 3D information on the specimen(s), since it allows the visualisation of internal and surface structures (fig. 2c). Such software however, is intensively time consuming.
Fluorescence labelling of cells
For LSM the specimen needs to be fluorescent, but reflexion from electron dense structures or labels (i.e., gold) might also be reflected by the laser light. The most common method of introducing fluorescence (or reflexion) is to fix and permeabilise cells and label them with fluorochrome (or gold)-labelled antibodies that are used as probes for particular antigens or biomolecules [14–16]. There are, in addition, many fluorescent dyes commercially available that can be used to label specific structures, such as cell membranes, specific organelles such as lysosomes, mitochondria or cell nuclei, in fixed as well in unfixed cells. A wide variety of fluorochromes (and dyes) are available, with emitting wavelengths that range from the blue-violet end of the visible spectrum to the infrared. Individual fluorochromes are characterised by the wavelengths at which they maximally absorb excitatory and emit fluorescent light [17]. For multicolour LSM, an optimal combination of several laser lines, dichroic mirrors (used to selectively pass light of a small range of colours whilst reflecting other colours), filters and detectors are needed for the simultaneous fluorochrome detection. In addition, for simultaneous multicolour detection, sequential detection of image data at different wavelengths also plays an important role in microscopy which has the advantage of avoiding cross-talk of the fluorochromes. Here the image data for the images at the different detected light wavelengths are obtained sequentially in time and then the data is superimposed on the computer. There is also a new approach to separate the signals of fluorochromes with overlapping emission profiles. This technique is based on the initial recording of the complete emission signals originating from the labelled samples. The knowledge of these spectral signatures is then used for digital separation of the fluorescence signals, which is based on the linear comparison of the spectral emission profiles with reference spectra from the individual fluorochromes present in the sample.
During the last years, many new fluorescence imaging tools have been described. One is the green fluorescent protein (GFP) from the jellyfish Aequorea Victoria, which can be used as a genetically encoded fluorescence marker due to autocatalytic formation of the chromophore. In recent years, numerous GFP-like proteins with different emission colours ranging from cyan to red were discovered in marine organisms [18]. Recently, robust and bright light emitters, such as semiconductor nanocrystals (i.e., quantum dots (QDs)), have been adopted as a new class of fluorescent labels [19]. Many studies have shown the great potential of using QDs as new probes for in vitro and in vivo analyses.
A 3D model of the human epithelial airway barrier characterised by LSM and digital image restoration
The respiratory tract contains more than 40 different cell types in total [20]. During deposition, inhaled insoluble antigens first encounter the surfactant film which is located at the air-liquid interface of the liquid lining layer continuously covering the internal surface of the lung. Surfactant facilitates the displacement of the antigens towards the cells lying beneath [21, 22], for example macrophages (professional phagocytes) which play an important role in particle clearance. Displaced antigens are either transported out of the lung by the mucociliary escalator or come into close association with macrophages, the epithelium and dendritic cells, which are located inside or beneath the epithelium. Of particular interest is, therefore, how dendritic cells come into contact with inhaled antigens. Dendritic cells are, as sentinels and the most competent antigen-presenting cells, a surveillance network in the pulmonary tissues [23–26].
Thus, 3D cell cultures are important tools in cell biology research and tissue engineering as they pertinently resemble the architectural microenvironment of natural tissue, compared to stan-dard two-dimensional cultures. LSM offers a great opportunity to image 3D cell cultures because of the thickness of such culture layers [6]. Not only is the 3D structure important, but co-cultures of different cell types have also been shown to influence the outcome of the results [27]. For the development of the triple cell co-culture model of the human epithelial airway barrier [4], specifically epithelial cells, macrophages and dendritic cells have been concentrated upon, since it has been shown that these cell types continuously cross-talk in vivo through intercellular signalling in order to maintain homeostasis and to coordinate immune responses [5]. In addition, LSM has shown that the dendritic cells release several hundred membrane vesicles, called exovesicles, which are able to activate resting dendritic cells and therefore amplify the immune response [28]. Not only dendritic cells are stimulated by exovesicles, but epithelial cells can also be activated to release additional inflammatory mediators [29].
As previously highlighted, the in vitro triple cell culture model of the human airway wall is composed of epithelial cells, MDM and MDDC [4, 30]. In this model, monolayers of the human alveolar epithelial cell line A549 that originates from a lung carcinoma [31] or the human bronchial epithelial cell line 16HBE14o- [32] were grown on a microporous membrane in a two chamber system. MDM and MDDC were added at the apical side and at the basal side of the epithelium, respectively. The integrity of the epithelial cell monolayers was evaluated by measuring the transepithelial electrical resistance and by examining the epithelial tight junction complexes using immunofluorescence methods. Cell densities of MDM and MDDC within the culture were quantified by LSM using the specific surface markers CD14 and CD86 for the labelling of MDM and MDDC, respectively [30]. Using this model it could be demonstrated that MDDC and MDM collaborate as sentinels against fine particles by building a transepithelial interdigitating network of cell processes [30, 33]. Initial experiments have been done by replacing the epithelial cell lines with primary alveolar type II cells isolated from human lung biopsies which transdifferentiate into a thin monolayer of alveolar type I-like epithelial cells after 8–9 days in culture. Triple cell co-cultures with these primary epithelial cells, MDM and MDDC have been performed and were characterised by LSM using specific surface markers [34].
In order to stimulate an environment that more closely mimics the in vivo situation, cell cultures can be exposed to air. The cultivation of epithelial cells on permeable supports allows the culture medium to be kept separate on either side of the cultured epithelium leading to an increased differentiation of the cultured cells [35]. Furthermore, the medium can be removed from the upper side to expose the cells to air on one side and to feed them from the medium in the chamber underneath [36]. This air-liquid culture technique has been described in different cell culture models [37] and has already been applied in many studies using the in vitro 3D triple cell co-culture model [30, 38]. By using LSM the cellular morphology, as well as the expression of tight junction proteins, can be assessed in air-exposed cultures and can be subsequently compared with analysis using suspension cultur.
Live cell imaging
For an understanding of fundamental biological questions, the visualisation of dynamic cellular processes is of great importance. In 1953, Shinya Inoue designed a polarizing light microscope in which he was able to resolve the mitotic spindle in healthy cells, giving scientists a look at one of the most important dynamic processes of cell biology and beginning a revolution in live cell imaging [40]. As another example, spinning disk confocal microscopes have been shown to be suited for fast in vivoimaging by a simultaneous approach of multi-beam scanning [41]. Further equipment for live cell imaging is a laser scanning microscope with a point scanner. For thicker specimens, however, where many optical sections have to be screened, or for very fast processes, high-speed simultaneous line scanning is recommended. Recently, using the latter (line scanning mode) to investigate the uptake of fluorescent polystyrene particles (1 µm in diameter) into MDM, the cells were prelabelled with Cell Tracker Orange, a cell membrane-permeant dye freely diffusing through membranes. The cell cultures were seeded in a culture chamber with a cover glass at the bottom, making observation with a high numerical aperture objective possible. This chamber was then mounted on a 37 °C heating stage. As the uptake of the particles occurs within minutes it was not necessary to provide the cultures with CO2. The cells were imaged with a line scanning LSM each lasting 30 seconds. Afterwards the cells were visualised in a surface rendering mode and made transparent, therefore the uptake of the green particles into the cells could clearly be seen within the first minutes (fig. 4). Further studies with the 3D model to observe translocation of fluorescently labelled particles are currently being performed using this technique.
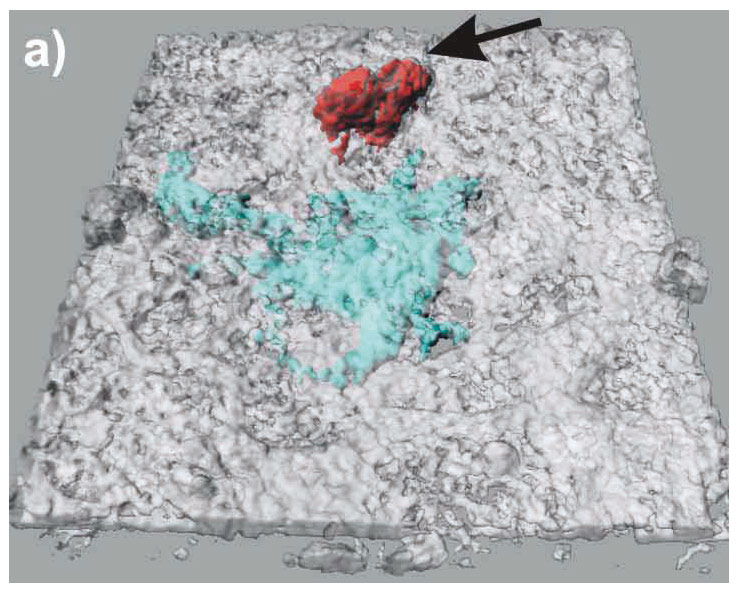
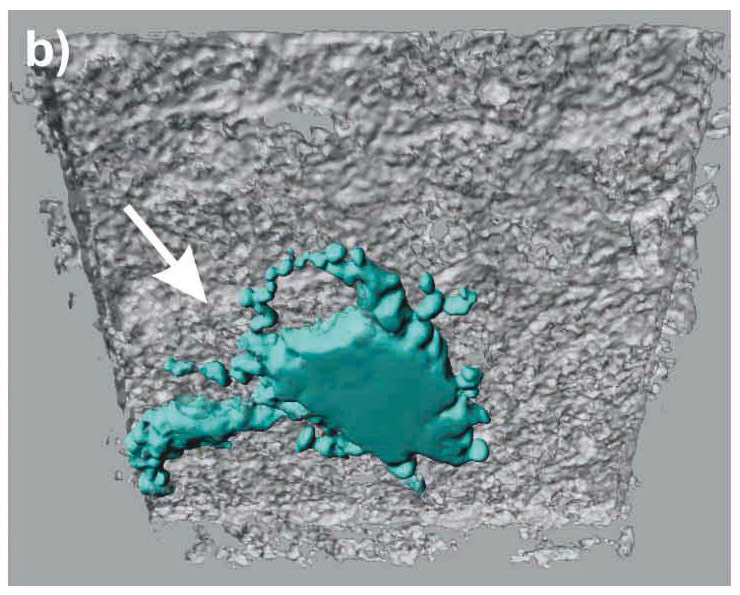
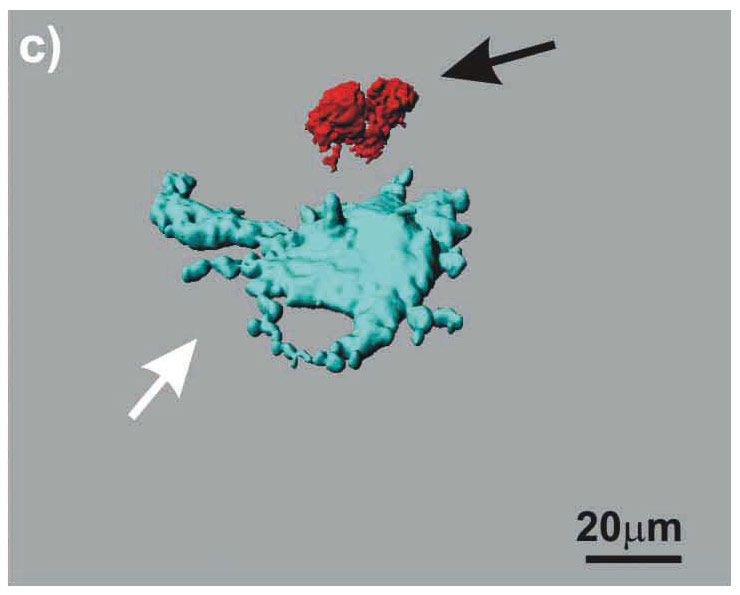
Figure 3
LSM images of the triple cell co-culture model. Epithelial cells (16HBE14o-), MDM and MDDC were co-cultured fixed and stained for F-actin (Phalloidin-rhodamine, white). Additionally, the MDM and MDDC were stained for specific surface markers CD14 (red), and CD86 (light blue), respectively. The cultures were observed with a Zeiss 510 Meta laser scanning microscope at a Z-interval of 0.3 µm, resulting in total 70 layers. Digital image restoration was performed using the IMARIS software from Bitplane AG. Epithelial cells (white, transparent volume rendering), MDM (red, surface rendering; black arrows), and MDDC (light blue, surface rendering; white arrows) are shown. The same data set is shown from top (A), from bottom (B), and without epithelial cells from top (C).

Figure 4
Uptake of polystyrene particles by MDM. MDM was pre-labelled with Cell tracker orange (red, transparent volume rendering). Fluorescently labelled polystyrene particles (1 µm, green, surface rendering) were added at time point zero to the cultures and visualized for 10 minutes using a Zeiss Duo5 laser scanning microscope with the line scan modus at a z-interval of 0.3 µm. The data restoration was done with IMARIS from Bitplane AG.
A high spatiotemporal in situ analysis of cell signalling events and cellular behaviour within living tissue conducted with fluorescence microscopy requires a highly sophisticated methodological setup, which has to cope with a number of challenges [42]. Firstly, the vitality of the cells to be observed can be impaired due to phototoxicity or insufficient sample maintenance during observation. In this regard, cells should be kept in an incubation chamber, which provides the required temperature and CO2 level and which is associated with the microscope. Additionally the scanning laser power should be minimized. Secondly, a long distance of specimen to the objective lens and moving sample may complicate the scanning pro-cess. In contrast to a properly mounted sample, the working distance of the objective lens to a specimen, which is located free floating in medium, is usually longer. As a consequence, objectives with longer working distances (e.g., water immersion or air) but also with lower numerical aperture and hence lower resolution can be used as an alternative to oil immersion objectives. The working distance can be kept short (for oil immersion objectives) by using glass bottom dishes as containers for the specimen with the objective directly fitted to the bottom using it as a “cover slip”. Thirdly, a fluorescence marker that does not impair the cellular functions has to be introduced into living cells. The problem is that many fluorescent molecules are not cell permeable, requiring lysis and fixation of the cells. Imaging of intracellular calcium in cells was one of the first areas in which cell permeable fluorescent dyes or luminescent proteins were used to follow cellular processes [43, 44]. The above mentioned discovery of GFP has provided researchers with a great tool to label and follow a specific protein in living cells [45, 46]. Genetically encoded fluorescent proteins in living systems are useful reporters of the dynamic behaviour of proteins inside cells [47]. One example is the spatial arrangement of tight junction proteins tagged with GFP that can be visualised by LSM for a certain time under various changing cell culture conditions [48]. QDs can also be used to label cells for live-cell imaging [49].
Conclusions
The LSM provides advantages over other microscope methods as the specimen preparation is fast and non-destructive. The information obtained by the scanning process is free of out of focus blur resulting in a greater depth of field. Nowadays, LSM is routinely performed by using multi-labelled specimens, allowing a comparison of the spatial arrangement of various proteins or cell structures. Once a 3D data set is collected, it can then be rotated and viewed from all angles if adequate software is employed. By using this method, a 3D model of the human epithelial airway barrier composed of various cell types, showing the spatial cellular arrangement similar to that in the human lung, has been established and extensively characterised. Using live cell imaging the very fast uptake of particles into macrophages has also been visualised, providing important information about the cellular functions of this triple cell co-culture system. The authors therefore conclude that LSM combined with an optimal visualisation of the 3D data is a promising technique with many possible applications in biological imaging.
We thank K. Dobson for comments on the manuscript.
Correspondence to:
PD Dr. Barbara Rothen-Rutishauser
Institute of Anatomy, Division of Histology
University of Bern
Baltzerstrasse 2
CH-3000 Bern 9
rothen@ana.unibe.ch
References
1 Pawley J. Handbook of biological confocal microsopcy, 3rd edn. Berlin: Springer; 2006.
2 Rothen-Rutishauser B, Kramer SD, Braun A, Gunthert M, Wunderli-Allenspach H. MDCK cell cultures as an epithelial in vitro model: cytoskeleton and tight junctions as indicators for the definition of age-related stages by confocal microscopy. Pharm Res. 1998;15:964–71.
3 Rothen-Rutishauser B, Braun A, Gunthert M, Wunderli-Allenspach H. Formation of multilayers in the caco-2 cell culture model: a confocal laser scanning microscopy study. Pharm Res. 2000;17:460–5.
4 Rothen-Rutishauser BM, Kiama SG, Gehr P. A three-dimensional cellular model of the human respiratory tract to study the interaction with particles. Am J Respir Cell Mol Biol. 2005;32:281–9.
5 Roggen EL, Soni NK, Verheyen GR. Respiratory immunotoxicity: an in vitro assessment. Toxicol In Vitro. 2006;20:1249–64.
6 Graf BW, Boppart SA. Imaging and analysis of three-dimensional cell culture models. Methods Mol Biol. 2010;591:211–27.
7 Minsky M. Microscopy Apparatus. 1957. Patent
8 White JG, Amos WB, Fordham M. An evaluation of confocal versus conventional imaging of biological structures by fluorescence light microscopy. J Cell Biol. 1987;105:41–8.
9 Inoué S. Foundations of confocal scanned imaging in light microscopy. Handbook of Biological Confocal Microscopy: Pawley, J. B.; 1995.
10 Sheppard C. Scanning optical microscopy. In Advances in optical and electron microsopcy. Edited by Barer R, Cosslett VE. Academic Press, London; 1987:1–98.
11 Messerli JM, van der Voort HT, Rungger-Brandle E, Perriard JC. Three-dimensional visualization of multi-channel volume data: the amSFP algorithm. Cytometry. 1993;14:725–35.
12 Gonzalez RC, Wintz P. Digital image restoration, 2nd edn. Addison-Wesley Publishing Company; 1987.
13 Brakenhoff GJ, van der Voort HT, van Spronsen EA, Linnemans WA, Nanninga N. Three-dimensional chromatin distribution in neuroblastoma nuclei shown by confocal scanning laser microscopy. Nature. 1985;317:748–9.
14 Pàstor MV. Direct immunofluorescent labeling of cells. Methods Mol Biol. 2010;588:135–42.
15 Watkins S. Immunohistochemistry. Curr Protoc Cytom. 2009, Chapter 12: Unit.
16 Willingham MC. Fluorescence labeling of surface antigens of attached or suspended tissue-culture cells. Methods Mol Biol. 2010;588:151.
17 Mullins JM. Overview of conventional fluorescence photomicrographie. Methods Mol Biol. 2010;588:181–6.
18 Wiedenmann J, Oswald F, Nienhaus GU. Fluorescent proteins for live cell imaging: opportunities, limitations, and challenges. IUBMB Life. 2009;61:1029–42.
19 Alivisatos AP, Gu W, Larabell C. Quantum dots as cellular probes. Annu Rev Biomed Eng. 2005;7:55–76.
20 Ochs M, Weibel E. Functional design of the human lung for gas exchange. In Fishman’s Pulmonary Diseases and Disorders. 4th ed edition. Edited by Fishman AP, Elias JA, Fishman JA, Grippi MA, Senior RM, Pack A. McGrawHill, New York 2008; 2008.
21 Gehr P, Schürch S, Berthiaume Y, Im Hof V, Geiser M. Particle retention in airways by surfactant. J Aerosol Med. 1990;3:27–43.
22 Schürch S, Gehr P, Im Hof V, Geiser M, Green Francis. Surfactant displaces particles toward the epithelium in airways and alveoli. Respir Physiol. 1990;80:17–32.
23 Blank F, von Garnier C, Obregon C, Rothen-Rutishauser B, Gehr P, Nicod L. Role of dendritic cells in the lung: in vitro models, animal models and human studies. Expert Rev Resp Med. 2008;2(2):215–33.
24 Holt PG, Schon-Hegrad MA, McMenamin PG. Dendritic cells in the respiratory tract. Int Rev Immunol. 1990;6:139–49.
25 McWilliam AS, Holt PG, Gehr P. Dendritic cells as sentinels of immune surveillance in the airways. In Particle-lung interactions. Edited by Gehr P, Heyder J. New York, Basel: Marcel Dekker; 2000:473–89.
26 Nicod LP. Lung defenses: an overview. Eur Respir Rev. 2005;95:45–50.
27 Muller L, Riediker M, Wick P, Mohr M, Gehr P, Rothen-Ru-tishauser B. Oxidative stress and inflammation response after nanoparticle exposure: differences between human lung cell monocultures and an advanced three-dimensional model of the human epithelial airways. J R Soc Interface. 2009.
28 Obregon C, Rothen-Rutishauser B, Gitahi SK, Gehr P, Nicod LP. Exovesicles from human activated dendritic cells fuse with resting dendritic cells, allowing them to present alloantigens. Am J Pathol. 2006;169:2127–36.
29 Obregon C, Rothen-Rutishauser B, Gerber P, Gehr P, Nicod LP. Active uptake of dendritic cell-derived exovesicles by epithelial cells induces the release of inflammatory mediators through a TNF-alpha-mediated pathway. Am J Pathol. 2009;175:696–705.
30 Blank F, Rothen-Rutishauser B, Gehr P. Dendritic cells and macrophages form a transepithelial network against foreign particulate antigens. Am J Respir Cell Mol Biol. 2007;36:669–77.
31 Lieber M, Smith B, Szakal A, Nelson-Rees W, Todaro G. A continuous tumor-cell line from a human lung carcinoma with properties of type II alveolar epithelial cells. Int J Cancer. 1976;17:62–70.
32 Forbes I, I: Human airway epithelial cell lines for in vitro drug transport and metabolism studies. 2000;3:18–27.
33 Rothen-Rutishauser B, Muhlfeld C, Blank F, Musso C, Gehr P. Translocation of particles and inflammatory responses after exposure to fine particles and nanoparticles in an epithelial airway model. Part Fibre Toxicol. 2007;4:9.
34 Lehmann AD, Daum N, Lehr CM, Bur M, Parak W, Gehr P, et al. An in vitro triple cell co-culture model of the human alveolar epithelial barrier including primary cells. Submitted to J R Soc Interface. 2010.
35 Handler JS, Green N, Steele RE. Cultures as epithelial models: porous-bottom culture dishes for studying transport and differentiation. Methods Enzymol. 1989;171:736–44.
36 Voisin C, Aerts C, Jakubczk E, Tonnel AB. La culture cellulaire en phase gazeuse. Un nouveau modele experimental d’etude in vitro des activites des macrophages alveolaires. Bull Eur Physiopathol Respir. 1977;13:69–82.
37 Rothen-Rutishauser B, Blank F, Muhlfeld C, Gehr P. In vitro models of the human epithelial airway barrier to study the toxic potential of particulate matter. Expert Opin Drug Metab Toxicol. 2008;4:1075–89.
38 Brandenberger Ch, Rothen-Rutishauser B, Mühlfeld Ch, Schmid O, Ferron GA, Maier KL et al. Effects and uptake of gold nanoparticles deposited at the air-liquid interface of a human epithelial airway model. Toxicol Appl Pharmacol. 2009;242:56–65.
39 Blank F, Rothen-Rutishauser BM, Schurch S, Gehr P. An optimized in vitro model of the respiratory tract wall to study particle cell interactions. J Aerosol Med. 2006;19:392–405.
40 INOUE S. Polarization optical studies of the mitotic spindle. I. The demonstration of spindle fibers in living cells. Chromosoma. 1953;5:487–500.
41 Gräf R, Rietdorf J, Zimmermann T. Live cell spinning disk microscopy. In Advances in biochemical engineering/biotechnology. Springer Berlin/Heidelberg; 2005:57–75.
42 Waters JC. Live-cell fluorescence imaging. Methods Cell Biol. 2007;81:115–40.
43 Knot HJ, Laher I, Sobie EA, Guatimosim S, Gomez-Viquez L, Hartmann H, et al. Twenty years of calcium imaging: cell physiology to dye for. Mol Interv. 2005;5:112–27.
44 Paredes RM, Etzler JC, Watts LT, Zheng W, Lechleiter JD. Chemical calcium indicators. Methods. 2008;46:143–51.
45 Chalfie M, Tu Y, Euskirchen G, Ward WW, Prasher DC. Green fluorescent protein as a marker for gene expression. Science. 1994;263:802–5.
46 Prasher DC, Eckenrode VK, Ward WW, Prendergast FG, Cormier MJ. Primary structure of the Aequorea victoria green-fluorescent protein. Gene. 1992;111:229–33.
47 Day RN, Schaufele F. Fluorescent protein tools for studying protein dynamics in living cells: a review. J Biomed Opt. 2008;13:031202.
48 Riesen FK, Rothen-Rutishauser B, Wunderli-Allenspach H. A ZO1-GFP fusion protein to study the dynamics of tight junctions in living cells. Histochem Cell Biol 2002;117:307–15.
49 Xing Y, Rao J. Quantum dot bioconjugates for in vitro diagnostics & in vivo imaging. Cancer Biomark. 2008;4:307–19.