Premature deaths in Switzerland from 1995–2006: causes and trends
DOI: https://doi.org/10.4414/smw.2010.13077
Summary
Purpose: Mortality expressed as potential years of life lost (PYLL) underscores premature and preventable mortality. We analysed causes of and trends in premature death in Switzerland to highlight the areas which provide the greatest potential outcome for preventive measures.
Methods: Premature mortality rates and trends from 1995–2006 were examined by reviewing potential years of life lost between age 1 and 70, as the upper age limit, considering 4 main categories: circulatory diseases, cancer, external causes of mortality and other causes, and 19 specific causes of death. Trends were assessed using join point analysis with PYLL expressed as age-standardised rate. The analysis was based on the official death certification files provided by the Swiss Federal Statistical Office.
Results: Age adjusted PYLL rates decreased for all categories of causes, but the decline in cancers was modest compared to circulatory diseases and external causes. The strongest downward trends were observed for AIDS, traffic accidents and ischaemic heart disease. In women breast cancer contributed most to the decline of premature mortality but remains the first cause of early death. Lung cancer in women is the only cause of premature mortality with rising trends.
Conclusions: Past efforts in prevention, early detection and treatment, but also a healthier lifestyle and other factors, have very probably contributed to the considerable reduction in the rate of potential years of life lost, but the rising rate of premature mortality caused by lung cancer in women is of concern. Persistent efforts in prevention and early detection are required to further reduce premature death and its burden on society.
Introduction
The concept of years of life lost to premature death involves both frequency of death and age at which death occurs. This measure is meant to assess the impact of major causes of death on a population. Traditional mortality indicators are calculated as age-standardised mortality rates based on a “standard” population, so that the rates can be compared in space and time. Mortality rates describe the amount of death in a society and are used to determine time trends of major causes of death, but they fail to quantify the burden of loss resulting from this mortality [1]. Different methods have been proposed to quantify the economic and social impact of untimely death, each with a slightly different emphasis, but all of them include some measure of number of deaths and distribution of age at death.
Potential years of life lost between ages 1 and 70 (PYLL) was proposed as an indicator with the primary objective of ranking major causes of premature mortality [2]. This measure complements traditional incidence and mortality rates and highlights special areas on which preventive activities might usefully focus. It is often quoted as measuring preventable death.
The relative importance of causes of premature death is changing over the course of time. Knowledge of actual trends and projection of future mortality are essential for appropriate and economically efficient health care planning, and to measure the impact and effectiveness of health care measures taken in the past. Improved medical treatments, preventive measures, but also risk behaviour (smoking) have a direct impact on mortality [3]. Socioeconomic features such as income and education may affect access to medical care or influence risk behaviour and contribute to differences in mortality and the relative importance of its causes [4, 5].
In Switzerland, premature mortality rates have been steadily decreasing. Many preventive measures have had a highly satisfactory and sometimes spectacular impact in curbing untimely deaths.
The aim of this study is to provide an updated analysis of causes and time trends of premature deaths in Switzerland from 1995 to 2006, and to highlight the areas which may benefit from additional preventive measures.
Methodology
Data sources and management
All data presented in this article are derived from the official death records of the Swiss Federal Statistical Office. Death certificates are established by certified doctors as specified by the ICD rules for completion of death certificates [6]. Cause of death is coded at the Federal Statistical Office by trained staff. The 10th revision of the International Classification of Diseases (ICD – 10) has been in use since 1995 [7]. Prior to 1995 ICD-8 codes were applied with different priority rules. This change in coding policy requires inclusion of a correcting factor for data up to 1994 [8]. For this study all individual deaths occurring in Switzerland from 1995–2006 were included. The database can be regarded as virtually complete.
Potential years of life lost (PYLL) were calculated according to the method proposed by Romeder [2]. The method consists of a summation of the number of deaths occurring at each age (between age 1 and 70) multiplied by the remaining years of life had the deceased lived up to age 70. Individual age at death was used for the computation. To compare potential years of life lost over time, the age-standardised rate of PYLL per 100 000 persons was calculated, using data of resident population (in five year groups) from the Federal Statistical Office. The European population was used as standard [9]. Only age-standardised rates were included in the analysis. PYLL rates were calculated separately for both sexes. Computation of rates of PYLL was performed with Stata version 10 [10].
Four main categories of death causes were analysed. Cancer, circulatory diseases and external causes of mortality are major contributors to premature years of life lost. The remaining causes were grouped in the category “other causes”. The cancer sites analysed as single cause were limited to the top six by rate of PYLL either in 1995 or 2006 for each sex. Within the other categories some of the more relevant and well defined causes, which either have a major impact on premature mortality (traffic accidents), are responsive to prevention programmes (alcoholic liver diseases, chronic respiratory diseases), or have been scaled down by recent medical progress (AIDS), were selected for analysis. (See classification in table 1).
Statistical analysis
The time trends for each cause or cluster of causes were analysed by joinpoint software [11] using a log linear model assuming constant variance [12]. These models identify the moments (joinpoints) at which significant changes in the time trends occur by performing several permutation tests [13]. The estimated annual percent change (APC) is computed for each identified trend by fitting a regression line to the natural logarithm of the rates using calendar year as regressor variable:
y = a + bx, where y = ln(rate) and x = calendar year, the APC is estimated as 100*(eb-1)
Average annual percent change (AAPC) was calculated that embraces the whole period, even with changing time trends. In this case AAPC is estimated as a weighted average of the join point APC’s, with the weights equal to the lengths of each segment. Significance level was fixed at 0.05%. Trends of PYLL for the main categories were compared to overall trend in PYLL by applying the join point comparability test for parallelism [14].
|
Table 1Classification of categories of causes and causes analysed for trends of PYLL. |
| Causes and clusters of causes analysed |
Classification of diseases according to ICD-10 |
| Main category |
Sub-categories or causes |
chapters |
|
Cancer
|
Lung,colorectum,breast, CNS,pancreas,ovary,stomach, ORL,liver,leukaemia
|
Neoplasms (II)
|
C00-D48 |
|
Circulatory disease
|
Ischaemic heart disease,cerebrovascular disease
|
Circulatory system (IX)
|
I00-I99 |
|
External cause
|
Traffic accident,
Suicide
|
External causes (XX)
|
V01-Y98 |
|
Other cause
|
AIDS
|
Infectious and parasitic diseases (I)
|
A00-B89 |
|
Blood & immune mechanisms (III)
|
D50-D89 |
|
Diabetes
|
Endocrine, nutritional & metabolic (IV)
|
E00-E90 |
|
Mental & behaviour (V)
|
F00-F99 |
|
Nervous system (VI)
|
G00-G99 |
|
Chronic pulmonary disease
|
Respiratory system (X)
|
J00-J99 |
|
Alcoholic liver disease
|
Digestive system (XI)
|
K00-K93 |
|
Skin and subcutaneous system (XII)
|
L00-L99 |
|
Musculoskeletal & connective tissue (XIII)
|
M00-M99 |
|
Genitourinary system (XIV)
|
N00-N99 |
|
Congenital & chromos. malformation (XVII)
|
Q00-Q99 |
|
Symptoms unknown / not classified (XVIII)
|
R00-R99 |
| * Chapters without or with very few observations of premature death were omitted |
Results
The chief causes of premature mortality in men in 2006 were external causes, responsible for 32% of potential years of life lost, followed close behind by cancer (27%) (fig. 1). In women, the leading category of causes for premature mortality is cancer, accountable for 42% of potential years of life lost in 2006. For men and women combined, cancer is the main cause of premature death: In 2006 a total of 186 916 potential years of life were lost in Switzerland; 63 496 were down to cancer. The most important single causes of premature mortality for men and women in recent years are shown in figure 2.
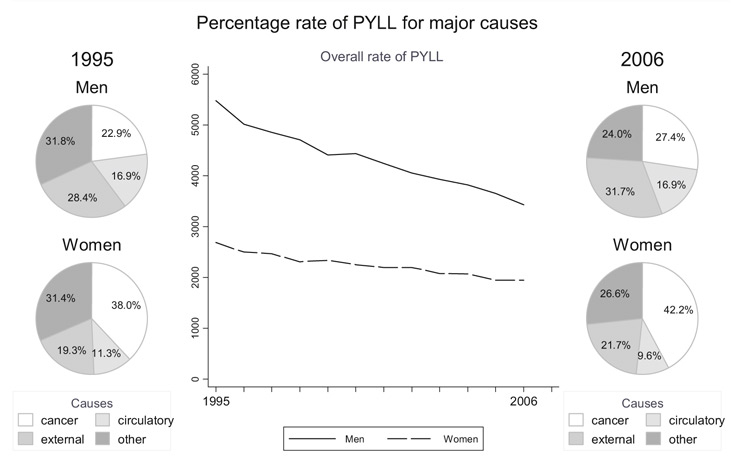
Figure 1
The relative importance of the major categories of causes of premature death expressed as percentage of overall rate of PYLL. Standardized rate of PYLL for men dropped from 5476 (/ 100’000 population) in 1995 to 3427 in 2006, and for women from 2688 to 1945
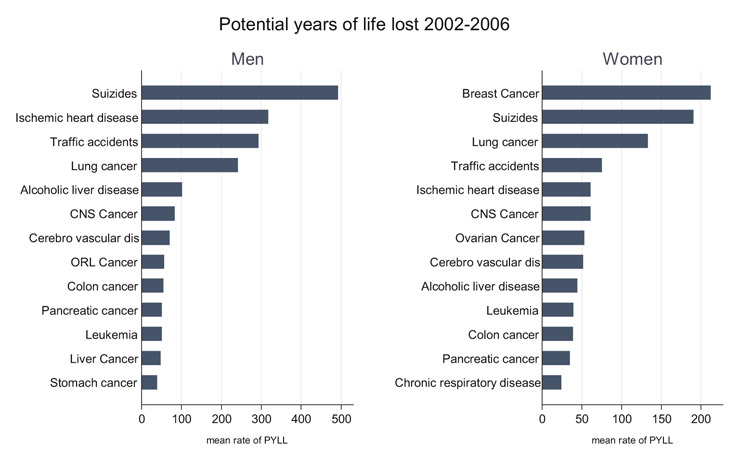
Figure 2
Leading causes of premature death based on 5-year mean of standardized rate of PYLL
Annual rates of PYLL for all cause categories have decreased substantially over the period. The rate of premature death was higher in men, and the decline more important, from 5476.4 per 100 000 in 1995 to 3427.1 per 100 000 population in 2006, with a decrease of –34%, as shown in table 2. Average annual percent change (AAPC) for all causes was –3.7%. In women the rate declined from 2687.8 to 1945.2 per 100 000 population. This implies a reduction of –25% with an AAPC of –2.7%. The male to female ratio changed little, from 2.0 to 1.8.
The prime category of causes of premature mortality in men, external causes, decreased by –31% during this period, with traffic accidents declining –48%. Cancers contributed least of all to the reduction in the rate of premature deaths: –22%, or –2.2% per year. The trend slope for cancer was significantly flatter than the trend slope for all causes (p <0.002). Premature mortality due to circulatory diseases decreased by –37% in men, or –4.6% per year, ischaemic heart disease contributing with –41% and cerebrovascular disease with –34%. The category “other causes” contributed most to the reduction of premature mortality in men, the rate declining by –45% during this period (–5.3% per year). A major contribution to this decrease came from AIDS: –90%.
Cancer caused most premature deaths in women. Cancer was also the category showing the least decline: –17% over the whole period. The trend slope was significantly less steep than the slope for all causes in women (p<0.006). Breast cancer, which remains the cancer site with the highest premature mortality, contributed to this decline with a remarkable decrease of –33% but an increase in the rates of PYLL for lung cancer by +30% was a significant counterweight to the decrease in cancer. The adverse trends of female lung and breast cancer are shown in table 2. The category external causes decreased by –20%. A reduction in rate of PYLL of traffic accidents by –55% contributed to this decline. Rate of PYLL for circulatory diseases decreased most: –41% (or –4.6% per year) and the trend slope was significantly steeper than the trend slope for all causes (P <0.003). Ischaemic heart diseases contributed to this reduction with a decline of –44%. The category of all other causes decreased by –34% in women during this period, this slope being also significantly steeper than the slope for all causes (P <0.04). The main contribution to this trend came from AIDS, with a reduction of –88%.
The comparability test showed significant differences for some time trends between men and women: the trend slopes for cancers (p <0.01) and external causes (p <0.008) were significantly steeper in men than in women.
Most trends were described by a single linear segment throughout the period studied. One breakpoint (join point) was identified in the trends for premature years of life lost to AIDS for men (in 1999) and women (in 2001) with a slow-down trend in the most recent period. On the other hand the downward trend for traffic accidents in men accelerated after a breakpoint in 2004.
Despite these trend differences the relative ranking of the major categories has not changed since 1995. The subcategories or single causes analysed represented approximately 51% of total rate of PYLL (men and women). The most notable change in relative ranking of causes was observed for AIDS.
|
Table 2Standardised rates of PYLL per 100 000 and their trends over time. |
|
Men |
Women |
|
Rate of PYLL / 100 000 population |
Trend |
Rate of PYLL / 100 000 population |
Trend |
|
Rate1995 |
in% |
Rate2006 |
in% |
AAPC |
P< |
% Change |
Rate1995 |
in % |
Rate2006 |
in % |
AAPC |
P< |
%Change |
|
All causes
|
5476.4 |
100
|
3427.1 |
100
|
–3.7 |
0.01
|
–34.2 |
2686.8 |
100 |
1945.2 |
100
|
–2.7 |
0.01
|
–25.8 |
|
Cancer:
|
1254.6 |
23
|
938.6 |
27
|
–2.2 |
0.01
|
–21.8 |
1021.9 |
38 |
820.4 |
42
|
–1.7 |
0.01
|
–16.9 |
|
ORL
|
65.4 |
1
|
50.4 |
1
|
–2.8 |
0.05
|
–26.8 |
14.8 |
1 |
12.5 |
1
|
–0.9 |
ns
|
–9.5 |
|
Stomach
|
54.8 |
1
|
32.6 |
1
|
–3.5 |
0.01
|
–32.1 |
26.9 |
1 |
22.5 |
1
|
–2.6 |
0.01
|
–25.1 |
|
Colon
|
68.7 |
1
|
56.4 |
2
|
–1.5 |
0.05
|
–14.9 |
43.6 |
2 |
33.2 |
2
|
–1.9 |
0.05
|
–19.2 |
|
Liver
|
50.0 |
1
|
54.6 |
2
|
0.6 |
ns
|
+6.2 |
12.8 |
|
19.7 |
1
|
2.1 |
ns
|
+25.1 |
|
Pancreas
|
48.0 |
1
|
49.7 |
1
|
–0.5 |
ns
|
–5.7 |
41.0 |
2 |
33.9 |
2
|
–0.6 |
ns
|
–6.4 |
|
Lung
|
302.9 |
6
|
218.3 |
6
|
–2.5 |
0.01
|
–25.7 |
111.9 |
4 |
137.8 |
7
|
+2.4 |
0.01
|
+29.5 |
|
Breast
|
* |
*
|
* |
*
|
* |
|
|
310.2 |
12 |
205.8 |
11
|
-3.5 |
0.01
|
–32.8 |
|
Ovarian
|
- |
-
|
- |
-
|
- |
|
|
68.4 |
3 |
54.6 |
3
|
-2.0 |
0.05
|
–20.2 |
|
CNS
|
93.0 |
2
|
84.2 |
2
|
–0.3 |
ns
|
–3.5 |
42.9 |
2 |
58.9 |
3
|
+2.9 |
0.05
|
+37.1 |
|
Leukaemia
|
73.6 |
1
|
44.7 |
1
|
–3.5 |
0.05
|
–32.6 |
47.2 |
2 |
21.4 |
1
|
–2.7 |
ns
|
–25.7 |
|
Other cancers
|
497.6 |
9
|
347.5 |
10
|
–2.5 |
0.01
|
–24.6 |
302.2 |
11 |
219.8 |
11
|
–2.8 |
0.01
|
–26.5 |
|
Circulatory diseases
|
923.0 |
17
|
580.0 |
17
|
–4.1 |
0.01
|
–36.6 |
304.2 |
11 |
186.7 |
10
|
–4.6 |
0.01
|
–40.7 |
|
Ischaemic heart disease
|
499.0 |
9
|
296.6 |
9
|
–4.6 |
0.01
|
–40.7 |
89.2 |
3 |
54.5 |
3
|
–5.2 |
0.01
|
–44.1 |
|
Cerebrovascular disease
|
100.3 |
2
|
68.2 |
2
|
–3.7 |
0.01
|
–34.3 |
59.8 |
2 |
51.4 |
3
|
–3.3 |
0.01
|
–30.8 |
|
Other circulatory diseases
|
323.8 |
6
|
215.2 |
6
|
–3.3 |
0.01
|
–30.8 |
155.2 |
6 |
80.8 |
4
|
–5.0 |
0.01
|
–43.1 |
|
External causes:
|
1556.7 |
28
|
1085.4 |
32
|
–3.3 |
0.01
|
–30.8 |
518.2 |
19 |
421.6 |
22
|
–2.0 |
0.01
|
–20.3 |
|
Traffic accidents
|
457.3 |
8
|
218.1 |
6
|
–6.5 |
0.01
|
–48.3 |
148.9 |
6 |
61.0 |
3
|
–7.1 |
0.01
|
–55.4 |
|
Suicides
|
654.0 |
12
|
447.9 |
13
|
–3.7 |
0.01
|
–33.9 |
219.0 |
8 |
187.2 |
10
|
–1.4 |
0.05
|
–14 |
|
Other external causes
|
445.4 |
8
|
419.4 |
12
|
–1.8 |
ns
|
–18.1 |
150.3 |
6 |
173.4 |
9
|
+0.3 |
ns
|
+2.9 |
|
Other causes:
|
1742.1 |
32
|
823.1 |
24
|
–5.3 |
0.01
|
–45.3 |
842.5 |
31 |
516.6 |
27
|
–3.8 |
0.01
|
–34.4 |
|
AIDS
|
200.4 |
4
|
21.2 |
1
|
–16.1 |
0.01
|
–90.4 |
83.2 |
3 |
9.3 |
|
–15.6 |
0.05
|
–87.7 |
|
Alcoholic liver disease
|
132.0 |
2
|
89.1 |
3
|
–4.2 |
ns
|
–32.8 |
55.8 |
2 |
46.7 |
2
|
–2.3 |
0.05
|
–22.9 |
|
Chronic respiratory disease
|
53.5 |
1
|
27.9 |
1
|
–5.8 |
0.01
|
–48 |
22.5 |
1 |
27.0 |
1
|
–0.1 |
ns
|
–0.9 |
|
Diabetes
|
25.7 |
|
26.0 |
1
|
–1.7 |
ns
|
–17.6 |
11.1 |
|
8.8 |
|
–3.6 |
0.05
|
–33.1 |
|
other causes in this group
|
1330.5 |
24
|
658.9 |
19
|
–4.9 |
0.01
|
–42.1 |
669.8 |
25 |
424.8 |
22
|
–3.3 |
0.01
|
–30.8 |
| AAPC: Average Annual Percent Change (last 10 observations). in %: sum may not reach 100 because of roundingns: not significant: the observed trend (and % change) is not significantly different from zero and may be due to random variationChange %: decrease or increase of rate of PYLL from 1995 to 2006 in percent (of modelled values)ORL: Lip, oral cavity and pharynx; CNS: central nervous system*Rates of PYLL were suppressed if the numerator was less than 30 cases per year |
Discussion
Summary of results
This analysis documents a continuous decrease in premature mortality. The declines are larger for men than for women, but overall rates remain higher for men. Overall, cancer is the primary cause of premature death, although in men rate of PYLL for external causes is, today, still slightly above the rate for cancers. The relative importance of cancer as a cause of premature mortality has been boosted by its moderate decline, together with the rising rate of female lung cancer. Major reductions in premature mortality have been observed for AIDS, traffic accidents and ischaemic heart disease, especially in women.
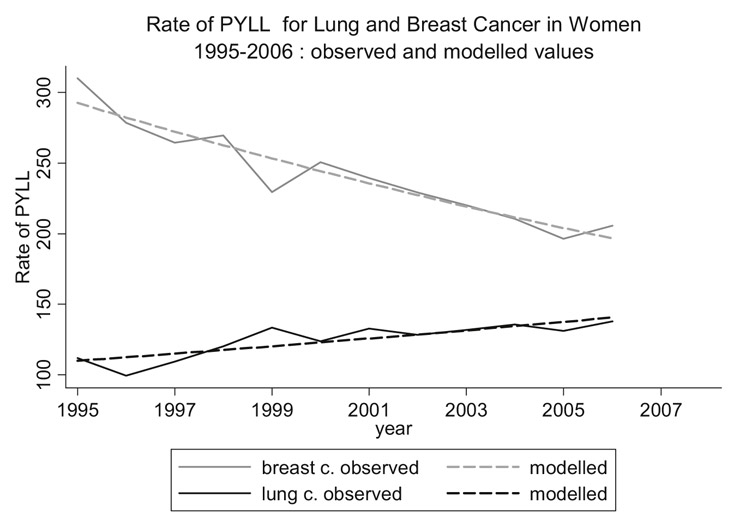
Figure 3
Evolution of rate of PYLL for lung and breast cancer in women from 1995 to 2006
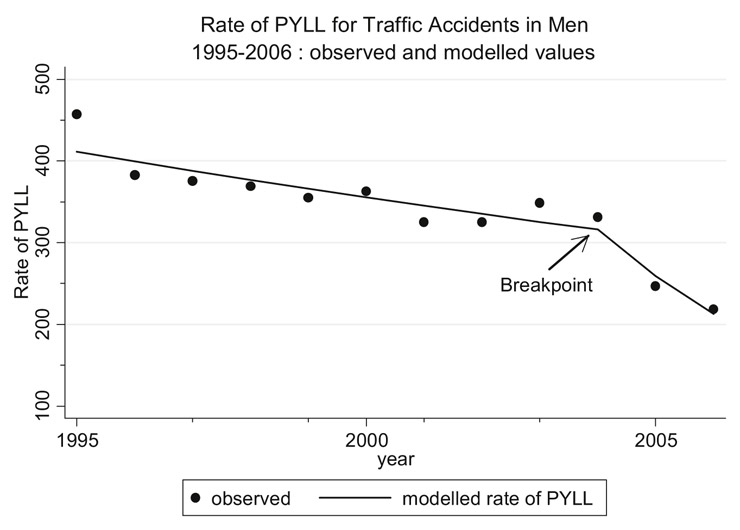
Figure 4
Breakpoint in slope of rate of PYLL for traffic accidents in men in 2004, coinciding with the reduction of the maximum blood alcohol level permitted for drivers to 0.5‰ in 2005
Higher premature mortality rates for men than for women are common in all parts of the world [15]. Rates of early death have decreased in Western countries over the last few decades [16, 17]. In high income countries and in Western Europe external causes and cancers remain the main cause of premature death for men [16, 18, 19]. Cardiovascular diseases are another leading category in early death [15].
Trends in premature mortality
In Switzerland premature mortality rates for all major categories of causes have declined since the 1970s, but the downward trend of cancer has shown a different pattern: the decline has been less marked, and the gap between the sexes is less pronounced [20]. Our results are in accordance with these findings. Lung cancer is preventable to a large extent, but mortality rates for lung cancer in women have been steadily increasing in many Western countries; since the mid-1980s a recent decline from a very high level has been observed in the United Kingdom and the Netherlands [21]. Conversely the mortality rates for lung cancer in men have started to decline in most countries, including in Switzerland [21–23], but remain at a very high level. The decrease in the mortality rate for colon cancer in Switzerland, another cancer responsive to early detection, paralleled the development in most western and northern but not southern European countries. The rate in Switzerland is among the lowest in Europe [23]. A strong downward trend in breast cancer mortality has been documented in Switzerland [24] and countries of western Europe such as the Netherlands, the United Kingdom and Germany [23]. Early detection and longer survival due to better tailored therapies are the most likely contributors to this decline, but breast cancer remained the first cause of premature death in women. Linear extrapolation of the actual time trends of breast and lung cancer suggests that their relative ranking may change within the next 10 years (fig. 3). The rate of PYLL for circulatory diseases has declined since 1951 [19]. Premature mortality from circulatory diseases is chiefly preventable through a healthier lifestyle and timely access to medical treatment. A significant decrease in in-hospital mortality has been observed between 2000 and 2007 for patients with access to percutaneous coronary intervention [25]. It has also been shown that heart failure events remained at a high level specially in men under 75 [26].
External causes of mortality are potentially preventable. Mortality due to accidents started to decrease only in 1971 [19]. Traffic accidents are particularly sensitive to preventive measures. The introduction of a new limit of 0.5‰ blood alcohol for drivers in 2005 has had an immediate effect on the number of deaths in traffic accidents [27] and also on the rate of PYLL.
This can be observed in Graph 4: the downward trend steepens in 2005. This effect may level off within a few years and other measures will be needed to curb traffic mortality further. Premature mortality due to suicides has declined only moderately. Its high level would certainly deserve increased attention.
The advent of highly active antiretroviral therapy has substantially attenuated the impact of AIDS on premature mortality [20], and additional prevention campaigns have reduced the number of new cases. This disease no longer figured among the most important causes of untimely death in Switzerland in 2006.
Among the diseases with minor impact (<= 2%) on premature mortality, notably higher rates in men than in women were observed for stomach and central nervous system cancer and alcohol-related liver diseases. Higher mortality rates for stomach cancer and alcohol-related liver diseases in men have been documented earlier in Switzerland, for the latter the median age at death is very low [20].
The persistent decline in premature death rates probably reflects the impact of medical and non-medical interventions such as prevention, early detection and improved treatment. Better education, income and occupation can affect smoking behaviour, physical activity and diet, which are direct and indirect risk factors for cardiovascular disease and many cancers. It has been shown that removal of such risk factors would considerably increase life expectancy even in populations with high healthy life expectancy such as those of Western Europe [28], especially for lung cancer, for which almost 90% of mortality is attributable to tobacco [29]. Although the prevalence of tobacco smoking has started to decline in both sexes in Switzerland [30] it remains at a very high level and its adverse effect on premature mortality can be expected to last for decades. A decisive and firm national health policy against tobacco consumption and additional, more targeted efforts are required if the current negative trends for female lung cancer are to be reversed in the foreseeable future.
Data quality
The quality and validity of mortality data rises and falls with the quality and accuracy of death certification [31]. Nevertheless, for most common death causes certification is sufficiently reliable, particularly for deaths below 70, to allow meaningful inferences to be drawn regarding trends.
Strength and limitations of the study
Premature mortality is a major public health concern but there has been little consensus on how it should be defined and reported. In particular, the definition of the cut-off age beyond which death is considered premature is still controverted. Another concern is disagreement as to what life is worth at each age and whether values should be applied to each age at death according to the economic loss [1]. Each of the proposed methods has its limitations. The method we used attributes the same value to each year lost. Rate of PYLL is therefore not equivalent to social and economic loss but a very rough approximation to it. Another methodological problem with PYLL is the fact that this approach does not take into account competing causes of death. The relative ranking of causes of premature death may be interchanged if the indicator of premature death involves independent competing risks of death [32]. PYLL is meant to highlight important causes of premature death that do not appear as a priority in conventional mortality tables. On the other hand, causes that appear as a priority in mortality tables may have a minor impact on premature mortality. Such is the case of prostate cancer. PYLL also highlights causes of premature death in a way that is comprehensible for the majority of the population, thus facilitating communication between doctors and patients.
Standardised age adjusted rates of PYLL are appropriate to detect social or regional differences in years of life lost prematurely [33, 34]. These differences tend to be higher in the younger than in the older age group [34], and conventional mortality rates are less suitable for detection of such variations.
Premature death has important social and economic consequences for society. But death is only the ultimate sequel of illness and disease and therefore represents only a part of these consequences. An analysis combining years of life lost and years lived with disability (DALY), as proposed in the Global Burden of Disease study [15], provides a comprehensive picture of the public health status. However, it requires a very extensive dataset.
Future directions
The reductions in premature death observed for all major categories of causes are highly encouraging. However, this progress has not been satisfactory for several cancer types. Many cancers have modifiable risk factors. Tobacco prevention efforts of recent decades are reflected in only slightly reduced lung cancer rates in men. These efforts must be intensified and adapted to reach young women. Years of life gained by prevention are more likely to be fully productive than years of life gained through medical care and therapy. Social and regional premature mortality patterns need to be analysed in order to further the development of targeted health policies.
We thank Erwin Wüest at the Federal Statistical Office for kindly providing information and answering questions.
Correspondence:
Anita Savidan PhD
Cancer registry
Krebsliga St. Gallen-Appenzell
Flurhofstrasse 7
9000 St. Gallen
Switzerland
anitasavidan@yahoo.com
References
1 Gardner JW, Sanborn JS. Years of potential life lost (YPLL) – what does it measure? Epidemiology. 1990;1:322–9.
2 Romeder JM, McWhinnie JR. Potential years of life lost between ages 1 and 70: an indicator of premature mortality for health planning. Int J Epidemiol. 1977;6:143–51.
3 Rask K, O’Malley E, Druss B. Impact of socioeconomic, behavioral and clinical risk factors on mortality. J Public Health. (Oxf) 2009;31:231–8.
4 Murray CJ, Lopez AD. Alternative projections of mortality and disability by cause 1990–2020: Global Burden of Disease Study. Lancet. 1997;349:1498–504.
5 Peto R, Lopez AD, Boreham J, et al. Mortality from tobacco in developed countries: indirect estimation from national vital statistics. Lancet. 1992;339:1268–78.
6 Richtlinien für die ärztliche Bescheinigung der Todesursachen. In Statistics FOf (ed) Edition Bern, Switzerland: Bundesamt für Statistik 1996; 1–60.
7 WHO. International Statistical Classification of Diseases and related Health Problems: 10th Revision. In Edition Geneva, Switzerland: World Health Organisation 1994.
8 Lutz JM, Pury P, Fioretta G, Raymond L. The impact of coding process on observed cancer mortality trends in Switzerland. Eur J Cancer Prev. 2004;13:77–81.
9 Cancer incidence in five continents. IARC Sci Publ. 1976;1–583.
10 StataCorp. 2007. Stata Statistical Software: Release 10. College Station, TX: StataCorp LP
11 Joinpoint Regression Program, Version 3.4 – September 2009; Statistical Research and Applications Branch, National Cancer Institute.
12 NCI. Join point Regression programme. Version 3.3 Software produced by the statistical research and application branch, National Cancer Insititute, Silver Springs US. In http://srab.cancer.gov/, Edition 2008.
13 Kim H, Foy MP, Fewer EJ, Midthune DN. Permutation tests for join point regression with applications to cancer rates. Stat Med. 2000;19:335–51.
14 Kim HJ, Fay MP, Yu B, et al. Comparability of segmented line regression models. Biometrics. 2004;60:1005–14.
15 Colin M, Thies B, Doris MF. Global burden of Disease: update 2004. In Edition World Health Organisation 2004.
16 Wigle DT, Mao Y, Semenciw R, et al. Premature deaths in Canada: impact, trends and opportunities for prevention. Can J Public Health. 1990;81:376–81.
17 Wheller L, Baker A, Griffiths C. Trends in premature mortality in England and Wales, 1950–2004. Health Statistics Quarterly 2006;34–41.
18 Wiesner G, Casper W. Changes in suicide mortality in Germany. Gesundheitswesen. 1993;55:367–71.
19 Guberan E. Mortality trends in Switzerland 1951–1977. Principal categories of the causes of death. Schweiz Med Wochenschr. 1979;109:1465–71.
20 Berrut S, Junker C. Von Generation zu Generation. In BFS BfS (ed) Statistik der Schweiz, Edition Neuchatel, Switzerland: 2008.
21 Levi F, Lucchini F, Negri E, La Vecchia C. Trends in mortality from major cancers in the European Union, including acceding countries, in 2004. Cancer. 2004;101:2843–50.
22 Levi F, Bosetti C, Fernandez E, et al. Trends in lung cancer among young European women: the rising epidemic in France and Spain. Int J Cancer. 2007;121:462–5.
23 La Vecchia C, Bosetti C, Lucchini F, et al. Cancer mortality in Europe, 2000–2004, and an overview of trends since 1975. Ann Oncol. 2009.
24 Bulliard JL, La Vecchia C, Levi F. Diverging trends in breast cancer mortality within Switzerland. Ann Oncol. 2006;17:57–9.
25 Stolt Steiger V, Goy JJ, Stauffer JC, et al. Significant decrease in in-hospital mortality and major adverse cardiac events in Swiss STEMI patients between 2000 and December 2007. Swiss Med Wkly. 2009;139:453–7.
26 Meyer K, Murner N, Laederach-Hofmann K, et al. Heart failure events, and case fatalities in Switzerland based on hospital statistics and cause of death statistics. Swiss Med Wkly. 2008;138:506–11.
27 Niemann S, Fahrni S, Brügger O, Cavegn M. Unfallgeschehen in der Schweiz: bfu-Statistik 2008. Bern: bfu; 2008.
28 Ezzati M, Hoorn SV, Rodgers A, et al. Estimates of global and regional potential health gains from reducing multiple major risk factors. Lancet. 2003;362:271–80.
29 Tyczynski JE, Bray F, Parkin DM. Lung cancer in Europe in 2000: epidemiology, prevention, and early detection. Lancet Oncol. 2003;4:45–55.
30 Kuntsche S, Gmel G. The smoking epidemic in Switzerland – an empirical examination of the theory of diffusion of innovations. Soz Praventivmed. 2005;50:344–54.
31 Parkin DM, Chen VW, Ferlay J, et al. Comparability and Quality control in Cancer Registration. In IARC (ed) IARC Technical Report No. 19, Edition Lyon: IARC 1994.
32 Lai D, Hardy RJ. Potential gains in life expectancy or years of potential life lost: impact of competing risks of death. Int J Epidemiol. 1999;28:894–8.
33 Blane D, Drever F. Inequality among men in standardised years of potential life lost, 1970–93. BMJ. 1998;317:255–6.
34 Blane D, Smith GD, Bartley M. Social class differences in years of potential life lost: size, trends, and principal causes. BMJ. 1990;301:429–32.